Purpose
To examine the range of practice in laboratory testing utilization among a subset of uveitis specialists using a scenario-based survey.
Design
Cross-sectional survey.
Methods
A web-based survey consisting of 13 patient scenarios was presented to the Executive Committee and Trustees of the American Uveitis Society. The participants were allowed to choose preferred testing in a free-form manner. The patterns of test utilization were studied and the cost of the testing was calculated based on Noridian Medicare reimbursal rates for Seattle, Washington.
Results
Nearly all providers recommended some testing for all scenarios. Forty-five different tests, including laboratory investigations and imaging and diagnostic procedures, were ordered. The mean number of tests ordered per scenario per provider was 5.47 ± 2.71. There was limited consensus among providers in test selection, with most tests in each scenario ordered by fewer than half of the providers. Average cost of testing per scenario per provider was $282.80, with 4 imaging tests (fluorescein angiography, magnetic resonance imaging, chest radiograph, and chest computed tomography) together contributing 59.9% of the total testing costs.
Conclusions
Uveitis specialists have a high rate of laboratory testing utilization in their evaluation of new patients. There is substantial variability in the evaluations obtained between providers. Imaging tests account for the majority of evaluation cost. The low agreement on specific testing plans suggests need for evidence-based practice guidelines for the evaluation of uveitis patients.
Uveitic conditions are commonly encountered in ophthalmology practice, with estimated incidence in large epidemiologic studies in the United States of approximately 50 per 100 000 person-years. This suggests approximately 150 000 incident cases in the United States each year. Determination of the etiology of uveitic disease typically entails laboratory testing. This testing is essential to ensure that treatable infectious diseases are identified and appropriately treated; to identify possible comorbid systemic disease associations that should be evaluated and potentially treated; and to provide prognostic information for the patient and physician. Retrospective studies have suggested that a definitive etiology (either infectious or associated with a systemic condition) is found overall in 26%–40% of patients in a tertiary referral setting.
A detailed history, review of systems, and accurate physical examination are essential in guiding the appropriate diagnostic tests in the evaluation of uveitis. There is no “standard laboratory workup” for uveitis, and unfocused ordering of diagnostic tests can be difficult to interpret and costly. Over-testing may lead to improper treatment as well, owing to false-positive results. Clinicians ordering laboratory testing are primarily interested in the positive predictive value (the probability that the patient has a given condition, given a positive test) and the negative predictive value (the probability that the patient does not have disease, given a negative test). These values can be calculated using Bayesian statistics for a given test if the sensitivity and specificity of the test are known, as well as the prevalence of the condition in the tested population. However, the result of a particular test must be interpreted with caution, given that the predictive parameters of each test can vary in different settings.
As cost containment becomes more prevalent in medical practice, scrutiny of laboratory testing practices is increasing. At present, there are no global practice guidelines for laboratory testing in uveitis. The purpose of the present study was to examine the range of practice in laboratory testing utilization among a subset of uveitis specialists and determine its cost implications.
Methods
A web-based survey was presented to the Executive Committee and Trustees of the American Uveitis Society. The University of Washington Institutional Review Board approval was waived for this research, and the study was in adherence to the Declaration of Helsinki. The survey included 13 hypothetical clinical case-based scenarios ( Supplementary Table ; Supplemental Material available at AJO.com ). The scenarios were designed to be representative of real-life diagnostic challenges. For none of the cases was an exclusive diagnosis strongly suggested by the history and findings. For each scenario, participants were asked to list the investigations that they would order. A comprehensive list of laboratory investigations, imaging modalities, and diagnostic procedures were included as a guide, but the participants were allowed to specify any testing they desired. The survey also included 5 additional questions regarding the practice pattern of the responding physicians.
The descriptive statistics and all analyses were performed with R ( www.r-project.org ). The cost of the testing was calculated based on 2013 Noridian Medicare reimbursement rates for Seattle, Washington.
Results
Twelve of 14 members of American Uveitis Society executive committee and trustees responded to the survey. One physician reported not having a majority uveitis practice (seeing fewer than 50 new uveitis patients a year) and was excluded from the analysis. The mean number of years since completion of fellowship was 17.16 (range 8–32). Fifty-percent were hospital based and 50% outpatient office based. Of the respondents, 45.45% saw approximately 101–250 new uveitis patients annually, while 27.27% each saw either between 51 and 100 or greater than 250. Demographics of respondents are shown in Table 1 .
| Provider ID | # of New Uveitis Patients Annually | Primary Practice Site a | Consideration of the Patient’s Insurance Status | Years in Practice | Majority Uveitis Practice |
|---|---|---|---|---|---|
| 1 | 101–250 | Outpatient | Weakly | 24 | True |
| 2 | 51–100 | Hospital | Weakly | 8 | True |
| 3 | 101–250 | Hospital | Moderately strongly | 11 | True |
| 4 | 101–250 | Outpatient | Not at all | 8.75 | True |
| 5 | >250 | Outpatient | Moderately strongly | 32 | True |
| 6 | 101–250 | Hospital | Moderately strongly | 8 | True |
| 7 | >250 | Hospital | Moderately strongly | 20 | True |
| 8 | 51–100 | Outpatient | Not at all | 25 | True |
| 9 | 51–100 | Hospital | Moderately strongly | 8 | True |
| 10 | 101–250 | Outpatient | Moderately weakly | 29 | True |
| 11 | >250 | Hospital | Moderately weakly | 15 | True |
a Outpatient: outpatient, office-based; hospital: hospital-based.
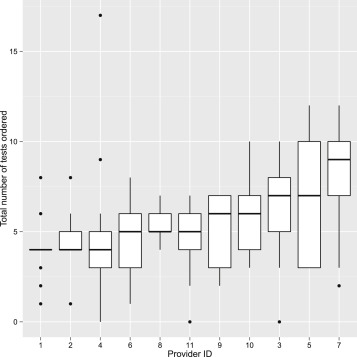
The details of the specific tests ordered by each physician are summarized in Table 2 . A total of 782 investigations were ordered by the 11 providers for the 13 scenarios. Forty-five different tests, including laboratory tests and imaging and diagnostic procedures, were ordered. The mean number of tests ordered per case scenario per provider was 5.47 ± 2.71; the median was 5.0 ( Figure 1 ). In aggregate, the highest number of tests was ordered for Scenario 5 (46-year-old man with prior Bacillus Calmette-Guérin [BCG] vaccine presenting with positive purified protein derivative [PPD] test presenting with bilateral perivenous sheathing, unilateral neovascularization and vitreous hemorrhage, 83 tests, 7.54 tests per provider) and the lowest for Scenario 12 (27-year-old woman with unilateral acute anterior uveitis in the setting of known ulcerative colitis, 31 tests, 2.82 tests per provider). The highest test utilizer ordered 105 tests (average of 8.18 tests/scenario), while the lowest ordered 54 tests (average 4.15/scenario). In only 3 instances (2.1% of opportunities) did any provider decline to order laboratory testing (Scenarios 12 and 13).
| Scenario | Tests Ordered | Average Number of Tests |
|---|---|---|
| 1 | ACE (3), CBC (1), CT chest (1), CXR (8), HLA-B27 (11), Lyme (2), Lysozyme (1), OCT (1), PPD (2), RPR (5), Syphilis ab (10) | 4.09 |
| 2 | A1C (1), ACE (4), ANA (1), B2 microglobulin (4), Bartonella (1), CBC (8), CMP (5), CXR (10), Creatinine (4), ESR (4), FA (4), Fundus photo (1), HIV (1), Lyme (2), Lysozyme (1), MRI brain (1), OCT (3), PPD (2), QuantiFERON (1), RF (1), RPR (5), Syphilis ab (10), UA (6) | 7.27 |
| 3 | ACE (5), ANA (2), CBC (6), CMP (5), CT chest (3), CXR (9), ESR (2), FA (7), ICG (1), Lyme (2), Lysozyme (2), MRI brain (1), OCT (6), PPD (4), QuantiFERON (1), RF (1), RPR (4), Skin biopsy (1), Syphilis ab (11), UA (1), Viral PCR (1) | 6.82 |
| 4 | ACE (5), CBC (2), CMP (2), CT chest (2), CXR (9), ESR (1), FA (5), Fundus photo (1), HLA-A29 (1), HTLV (1), Lyme (4), Lysozyme (1), MRI brain (5), OCT (8), PPD (3), RPR (4), Syphilis ab (11) | 5.91 |
| 5 | ACE (4), ANA (2), ANCA (1), Bartonella (2), CBC (4), CMP (3), CRP (2), CT chest (4), CXR (8), ESR (3), FA (9), Fundus photo (1), HIV (1), HLA-B51 (1), HTLV (1), Lupus ab (1), Lyme (3), Lysozyme (2), OCT (1), PPD (1), QuantiFERON (8), RF (2), RPR (4), Syphilis ab (10), Toxoplasmosis ab (1), West Nile (1), anti-CCP (1), anti-RNP (1), anti-SS (1) | 7.55 |
| 6 | ACE (1), ANA (10), CBC (5), CMP (2), CXR (4), ESR (1), HLA-B27 (2), Lyme (2), Lysozyme (1), OCT (5), PPD (1), RF (2), RPR (1), Syphilis ab (3) | 3.64 |
| 7 | Bartonella (3), CBC (6), CMP (2), CXR (4), Creatinine (1), Fundus photo (2), HIV (1), ICG (1), Liver panel (1), Lyme (1), PPD (4), QuantiFERON (1), RPR (1), Syphilis ab (8), Toxocara ab (1), Toxoplasmosis ab (10) | 4.27 |
| 8 | ACE (2), ANA (1), ANCA (1), CBC (5), CMP (4), CXR (6), ESR (1), FA (2), Fundus photo (2), HIV (3), HLA-B27 (1), HLA-B51 (1), Lyme (2), MRI brain (1), PPD (3), RPR (6), Syphilis ab (10), Toxoplasmosis ab (4), UA (2), Viral PCR (8) | 5.91 |
| 9 | ANA (6), ANCA (11), CBC (6), CMP (4), CRP (4), CXR (6), Creatinine (2), ESR (7), Lyme (2), PPD (2), RF (7), RPR (1), Syphilis ab (8), UA (5), anti-CCP (5) | 6.91 |
| 10 | ACE (3), CBC (7), CMP (4), CT chest (2), CXR (9), ESR (1), FA (5), Fundus photo (1), HTLV (1), Lyme (4), Lysozyme (1), MRI brain (4), OCT (3), PPD (4), RPR (4), Syphilis ab (10), UA (1), Viral PCR (1) | 5.91 |
| 11 | ACE (4), CBC (5), CMP (4), CT chest (2), CXR (6), Creatinine (2), ERG (2), FA (7), Fundus photo (2), GVF (1), HLA-A29 (9), HVF (2), Hepatitis panel (1), ICG (3), Liver panel (1), Lyme (2), Lysozyme (1), OCT (6), RPR (5), Syphilis ab (9), UA (1) | 6.82 |
| 12 | ACE (1), CBC (2), CMP (1), CXR (5), ESR (2), HLA-B27 (8), Lyme (1), PPD (1), RPR (4), Syphilis ab (6) | 2.82 |
| 13 | ACE (2), CXR (7), HLA-B27 (10), Lyme (2), Lysozyme (1), PPD (1), RPR (4), Syphilis ab (8) | 3.18 |
The total number of times any test could be ordered was 143 (13 scenarios multiplied by 11 respondents). The frequency of each specific test being ordered in this study, the cost per test, and the total cost of the ordered tests are presented in Table 3 . The most commonly ordered tests were treponemal antibody tests (ie, fluorescent treponemal antibody – absorption test, treponema pallidum particle agglutination, or microhemagglutination assay [114 of 143 possible orders, 79.72%]), followed by chest radiography (91, 63.63%), complete blood count (57, 39.86%), non–treponemal tests (ie, rapid plasma reagin or venereal disease research laboratory test; 48, 33.57%), purified protein derivative/QuantiFERON (39, 27.27%), fluorescein angiogram (39, 27.27%), and angiotensin-converting enzyme (34, 23.78%). Remarkably, there was almost no consensus on evaluation between providers ( Figure 2 ). Only for 1 test (antineutrophil cytoplasmic antibody) for 1 scenario (Scenario 9, unilateral scleritis) was there universal agreement. Most laboratory tests were ordered by less than half of the participants ( Figure 2 ).
| Diagnostic Test | Number of Orders | Cost per Order ($) | Total Cost ($) |
|---|---|---|---|
| Tests With No Diagnostic Value | |||
| CBC | 57 | 8.9 | 507.3 |
| CMP | 36 | 14.5 | 522 |
| Creatinine | 9 | 7 | 63 |
| Hgb A1C | 1 | 13.3 | 13.3 |
| Liver panel | 2 | 11.2 | 22.4 |
| Hepatitis panel | 1 | 20.1 | 20.1 |
| ESR | 22 | 3.7 | 81.4 |
| CRP | 6 | 7.1 | 42.6 |
| Ocular Tests | |||
| Fundus photo | 10 | 69.2 | 692 |
| FA | 39 | 199.2 | 7768.8 |
| ICG | 5 | 199.2 | 996 |
| OCT | 33 | 56.5 | 1864.5 |
| HVF | 2 | 75.1 | 150.2 |
| GVF | 1 | 50.5 | 50.5 |
| ERG | 2 | 121.9 | 243.8 |
| Viral PCR | 10 | 196 | 1960 |
| Non–Ocular Tests | |||
| ACE | 34 | 20.1 | 683.4 |
| Lysozyme | 11 | 25.8 | 283.8 |
| ANA | 22 | 16.6 | 365.2 |
| ANCA | 13 | 17.8 | 231.4 |
| RF | 13 | 7.8 | 101.4 |
| anti-CCP | 6 | 17.8 | 106.8 |
| anti-RNP | 1 | 24.7 | 24.7 |
| anti-SS | 1 | 49.3 | 49.3 |
| HLA-B27 | 32 | 37.7 | 1206.4 |
| HLA-A29 | 10 | 33.1 | 331 |
| HLA-B51 | 2 | 81.9 | 163.8 |
| Syphilis ab | 114 | 18.2 | 2074.8 |
| RPR | 48 | 6.1 | 292.8 |
| HIV | 6 | 33.1 | 198.6 |
| HTLV | 3 | 11.5 | 34.5 |
| Bartonella | 6 | 48.2 | 289.2 |
| Lupus ab | 1 | 11.7 | 11.7 |
| Lyme ab | 29 | 23.4 | 678.6 |
| Toxocara ab | 1 | 17.9 | 17.9 |
| Toxoplasmosis ab | 15 | 19.8 | 297 |
| West Nile | 1 | 58.9 | 58.9 |
| PPD | 28 | 6 | 168 |
| QuantiFERON | 11 | 103 | 1133 |
| UA with micro | 16 | 4.4 | 70.4 |
| Urine B2 | 4 | 20 | 80 |
| Skin biopsy | 1 | 0 | 0 |
| MRI brain | 12 | 539.7 | 6476.4 |
| CT chest | 14 | 307 | 4298 |
| Chest XR | 91 | 62.8 | 5714.8 |
| Total | 782 | 2677.7 | 40 439.7 |
| Per provider | 3676.34 | ||
| Per scenario per provider | 282.80 | ||
Stay updated, free articles. Join our Telegram channel

Full access? Get Clinical Tree


