Purpose
To determine patient factors and eye conditions associated with artifacts in Spectralis optical coherence tomography (OCT) retinal nerve fiber layer (RNFL) scans.
Design
Retrospective cross-sectional study.
Methods
The prevalence of 12 artifact types were described in this review of 2313 eye scans from 1188 patients who underwent a complete eye examination with Spectralis OCT scanning during the period of September 2009 to July 2013. The generalized estimating equations model was used to analyze associations between increased artifact prevalence and 10 patient characteristics, which included age, sex, race, visual acuity, refractive error, astigmatism, cataract status, glaucoma staging, visual field reliability, and glaucoma diagnosis.
Results
A total of 1070 or 46.3% of the 2313 eye scans had at least 1 artifact. Decentration error was the most common artifact (27.8%), followed by posterior vitreous detachment artifacts (14.4%). Visual acuity of less than 20/40 ( P < .0001), presence of moderate to severe cataracts ( P < .0001), advanced stage of glaucoma ( P < .0001), and a diagnosis of open-angle glaucoma ( P = .0003) were associated with increased prevalence of artifacts.
Conclusions
Clinicians should first assess scans for artifacts before making therapeutic decisions based on RNFL thickness measurements.
Glaucoma is the leading cause of irreversible blindness in the world, affecting more than 2.8 million people in the United States alone. It is an optic neuropathy characterized by the death of retinal ganglion cells, the axons of which converge to form the retinal nerve fiber layer (RNFL). As a result, glaucoma causes RNFL thinning. Imaging of the RNFL, therefore, has important clinical value not only for diagnosing glaucoma but also for following disease progression.
First developed and described in 1991 by Huang and associates, optical coherence tomography (OCT) is a noninvasive imaging technique that uses low-coherence interferometry to generate high-resolution cross-sectional images of any optically accessible tissue. OCT imaging has undergone many significant technological advances, and the current commercially available spectral-domain OCT (SD OCT) machines, such as the Spectralis OCT (Heidelberg Engineering, Heidelberg, Germany), provide ultra-high-speed images, with better resolution and sensitivity compared to older time-domain OCT (TD OCT) devices. Automated SD OCT measurements allow for quantitative and objective assessments of early RNFL thinning, which can be detected before corresponding visual field loss. However, SD OCT, or any test, is limited by the quality of the test. Errors either in data acquisition or in software analysis may result in erroneous RNFL measurements, which may lead to an inaccurate clinical assessment. Therefore, the goal of this paper is to determine when such imaging artifacts or inaccuracies occur and in which patients these artifacts are most likely to occur.
SD OCT has been reported to have a decreased incidence of segmentation errors compared to older devices. Han and Jaffe previously performed a study to characterize the types and frequencies of image artifacts with SD OCT imaging of the macula for the evaluation of retinal diseases. Several types of artifacts were observed, including inner and outer retina misidentification, degraded scan images, cut edge artifacts, incomplete segmentation errors, and retinal image shifts. As many as 90.9% of scans had at least 1 artifact, and clinically significant artifacts were observed in 8.0% of scans. More recently, Asrani and associates conducted a retrospective cross-sectional study on 277 consecutive patients with a diagnosis of glaucoma and obtained SD OCT scanning of the RNFL. They found that 19.9% of RNFL scans contained artifacts, and the most common cause of artifacts was related to epiretinal membranes. Our study has a larger study population of 1188 patients. In addition, we evaluated if RNFL artifacts were associated with patient factors or eye conditions. We hypothesize that an increased prevalence of RNFL artifacts in Spectralis OCT imaging is associated with patient factors such as older age, female sex, worse visual acuity, worsen refractive error and astigmatism, and worse glaucoma severity.
Methods
Study Population
A retrospective review of patients and their eye scans was conducted with approval from the Massachusetts Eye and Ear Infirmary (MEEI) Institutional Review Board, and the study protocol was in accordance with the Health Insurance Portability and Accountability Act.
Subjects were included in the study if they were seen in the glaucoma service at MEEI (by T.C.C.) and underwent a complete eye examination with Spectralis OCT scanning during the period of September 1, 2009 to July 31, 2013. A total of 1188 patients met the above criteria and were included in the study. Some patients had multiple scans, but only the most recent SD OCT scans were used for the study. Both eyes were included in the study if a patient had both eyes scanned. Sixty-three patients only had scans from 1 eye, so only 1 scan for these patients was included. As a result, a total of 2313 eye scans were reviewed in this study.
Spectralis Optical Coherence Tomography Imaging
All patients had peripapillary SD OCT RNFL thickness measured using a circular scan pattern. The Spectralis OCT is an SD OCT machine that has a scan speed of 40 000 A-lines per second and an eye tracking system, the TruTrack image alignment software, that reduces target motion artifacts and results in more stable captured images. The scan automatically generates a quality score of 0 to 40 decibels (dB). Multiple frames at the same location are obtained and then averaged to reduce speckle noise. The scan circle around the optic nerve is 12 degrees in diameter, and the scan circle diameter in millimeters therefore depends on the axial length. For a typical eye length, the circle would be approximately 3.5–3.6 mm in diameter. Scans were acquired in High Speed mode.
The Spectralis OCT software (version 4.0) allows for automatic segmentation of the anterior and posterior borders of the RNFL to calculate the average RNFL thickness for the overall global (360 degrees), for 4 quadrants (superior [S], inferior [I], nasal [N], and temporal [T]), and for 4 additional sectors (superior-temporal [TS, 45–90 degrees], superior-nasal [NS, 90–135 degrees], inferior-nasal [NI, 225–270 degrees], and inferior-temporal [TI, 270–315 degrees]).
Evaluation of Image Artifacts
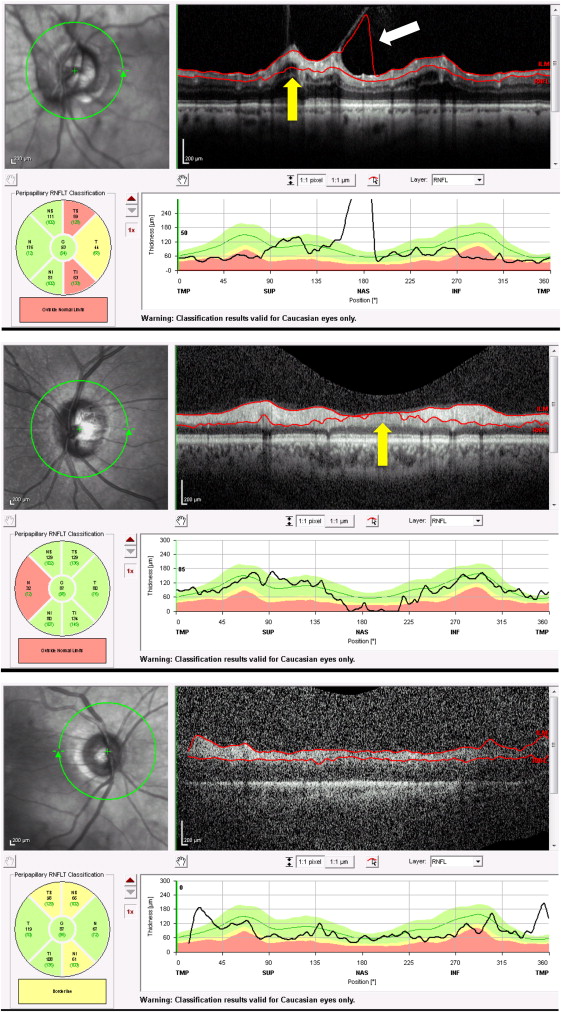
In this paper, we defined 12 artifact types. A type 1 artifact was defined algorithm failure or incorrect segmentation of the anterior RNFL ( Figure 1 , Top, white arrow), and a type 2 artifact occurred when there was posterior RNFL misidentification ( Figure 1 , Top and Middle, yellow arrows). A type 3 artifact occurred when there was incomplete segmentation ( Figure 1 , Bottom), when the algorithm failed to delineate the entire extent of the RNFL, or when the red line on the OCT printout ended before the OCT image ended. Complete absence of segmentation was considered a subtype of artifact type 3.
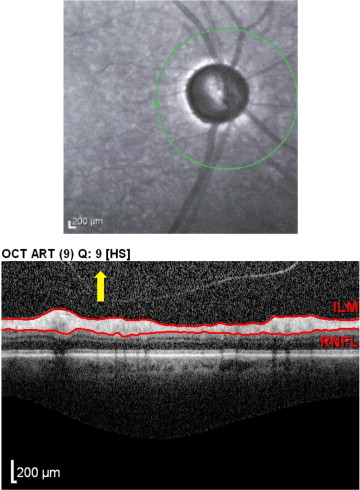
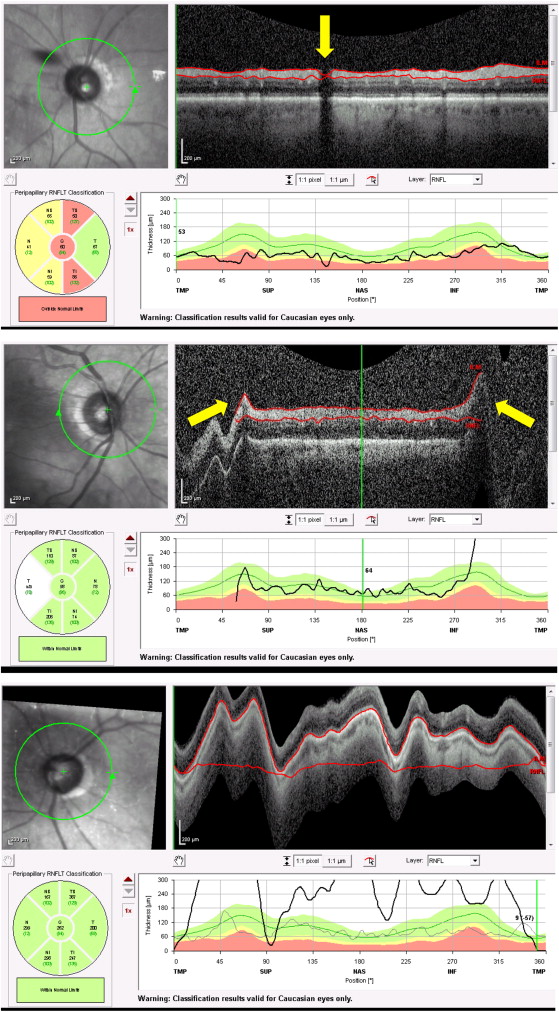
Spectralis OCT scans were considered decentered (type 4, Figure 2 , Top) when the center of the optic nerve head was more than approximately 10% off the center of the peripapillary circular scan. Spectralis SD OCT automatically generates a quality score from 0 to 40 dB. Type 5 or poor signal artifact ( Figure 2 , Bottom, yellow arrow) was defined as a quality score of less than 15, as indicated in the Spectralis user’s manual. A type 6 artifact ( Figure 3 , Top, yellow arrow) occurred when part of the scan was missing and when a portion of the RNFL across its entire thickness was completely black or indistinguishable from the background noise. Since glaucoma patients tend to have decreased RNFL thickness, cases where even the slightest signal above background noise was detected were excluded as an artifact. Type 7 cut edge artifacts ( Figure 3 , Middle, yellow arrows) were identified in cases of abrupt lateral edge truncation of the RNFL. Type 8 motion artifacts ( Figure 3 , Bottom) were attributable to patient movement during scanning. If patient movement caused parts of the OCT scan to be completely out of the rectangular display printout, this was counted as a movement artifact. If the OCT scan was characterized by a wavy or undulating appearance of the entire scan image but if the entire retina was still visible in the displayed scan, this was not considered a motion artifact in this paper.
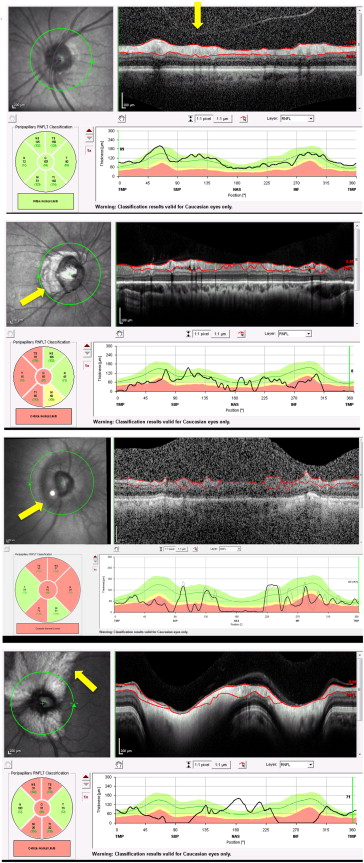
Patient ocular pathology–associated artifacts types 9–12 were identified when the RNFL scan circle involved scanning over areas of clinically documented fundus abnormalities. Type 9 posterior vitreous detachment (PVD)-associated artifacts ( Figure 4 , Top, yellow arrow) were identified in scans where a clear PVD was present on the Spectralis OCT printout. Type 10 was a peripapillary atrophy (PPA)-associated artifact ( Figure 4 , Upper middle, yellow arrow). Type 11 was a staphyloma-associated artifact ( Figure 4 , Lower middle, yellow arrow). Type 12 was a myelinated nerve fiber layer (MNFL)-associated artifact ( Figure 4 , Bottom, yellow arrow).
Patient Factors and Eye Characteristics
We recorded patient-specific factors such as age, sex, and race, as well as eye-specific factors such as visual acuity (VA), refractive error [with spherical equivalent (SE)], astigmatism (cylindrical refractive errors), cataract status, glaucoma diagnosis, glaucoma staging, and visual field reliability.
Visual acuity was either best-corrected visual acuity (cc) or visual acuity without correction (sc) if visual acuity did not improve with correction. Vision was divided into 2 categories: (1) 20/40 or better, and (2) worse than 20/40.
Refraction, if recorded within 3 months of the OCT scan, was included in this study. If there were multiple refractions, the one closest to the date of the scan was used. Of the 2313 eye scans, 1091 eye scans did not have any documented refraction within the 3-month time period. For the remaining 1222 eye scans, patients were categorized as being either within −6.00 diopters (D) SE to +5.00 D SE, inclusive, or worse than −6.00 D SE or worse than +5.00 D SE. Astigmatism was evaluated, and patients were categorized as either better than or equal to ±3.00 D of cylinder, or worse than ±3.00 D of cylinder.
Cataract status was evaluated on the day of the SD OCT scan and was classified as being: (1) clear, no cataract; (2) trace to 1+ cataract; (3) 2+ cataract or more; or (4) with a posterior (PCIOL) or anterior chamber intraocular lens. If a patient had glaucoma, glaucoma staging was evaluated based on the mean deviation (MD) value from Humphrey visual field testing (SITA-standard 24-2 strategy, model HFAII series 750i; Carl Zeiss Meditec Inc, Jena, Germany), and glaucoma stages were classified using a modified Hodapp-Anderson-Parrish system, which graded fields as: (1) normal (MD greater than or equal to 0); (2) mild (−6 ≤ MD < 0); (3) moderate (−12 ≤ MD < −6); or (4) advanced (MD < −12). Visual fields were categorized as reliable, if false positives were ≤20%, false negatives ≤20%, and fixation losses ≤33%. Patients were also categorized according to their glaucoma diagnosis. The 4 most common glaucoma diagnoses each were categorized into their own individual groups; pediatric glaucoma was categorized as a separate group, and the rest of the diagnoses were included in the category of “other.”
Statistical Analysis
All statistical analysis was performed using SAS version 9.3 (SAS Inc, Cary, North Carolina, USA). To quantify the frequency of artifacts among all scans analyzed, the number of scans with at least 1 artifact was divided by the total number of scans. Scans that had multiple artifacts were only counted once. Analyses were then performed for each artifact type. The frequencies of scans with 1, 2, and 3 or more types of different artifacts were also quantified by dividing the number of corresponding scans by the total number of scans analyzed.
Statistical analyses were performed on a per-eye basis to assess the effects of patient-specific and eye-specific factors on the prevalence and frequency of artifacts in SD OCT imaging. Generalized estimating equation models were used to account for correlations of the paired eyes of the same subjects. Univariable analyses were first conducted to determine the existence of association between each of the patient and eye specific factors (age, sex, race, visual acuity, refractive error, astigmatism, cataract status, glaucoma staging, visual field reliability, glaucoma diagnosis) and the frequency of eye scans with at least 1 artifact. Variables with a univariable significance of P < .10 were selected for the model building. Glaucoma diagnosis and glaucoma staging were highly correlated and therefore they were not entered in a model simultaneously.
A manual selection method was used, and those maintaining a P < .05 were kept. The univariable predictors not included in the model were manually reentered for an assessment of confounding effects. Interaction effects with the significant variables were also assessed. All missing data were excluded from analysis. Of note, 1091 eye scans did not have a recorded refraction, so univariable analyses were carried out with the remaining 1222 eye scans as a separate sub-group analysis.
Results
Patient Demographics
There were 1188 patients in the database with an average age of 61.3 ± 35.3 years, among whom 640 patients (53.9%) were female and 548 (46.1%) were male. In terms of race, a total of 846 patients (71.2%) were white, 143 (12%) were black, 66 (5.6%) were Asian, 37 (3.1%) were Hispanic, and 24 (2.0%) belonged to other racial groups. Seventy-two patients (6.1%) did not disclose their racial information.
Of all 1188 subjects, 1125 subjects (94.7%) had 2 eye scans, 1 for each eye, and 63 subjects (5.3%) had a scan for 1 eye. As a result, a total of 2313 eyes from 1188 subjects were scanned. There were 1160 scans from right eyes and 1153 from left eyes.
Eye Characteristics
Eye-specific characteristics are shown in Table 1 , which showed that most of the scans were associated with better than 20/40 vision (80.9%), mild glaucoma stage (55.5%), reliable visual fields (69.7%), and trace to 1+ cataracts (54.9%). Of the 1222 (52.8% of the total) eye scans from patients who had their refractive errors recorded, 1141 or 93.4% were associated with refractive errors between −6.0 D SE and +5.0 D SE while the remaining 81 or 6.6% were associated with refractive error worse than −6.0 D SE or +5.0 D SE. Of the 1222 eye scans from patients who had their refraction recorded within 3 months of the OCT scan, 1186 or 97.1% had between −3.0 to +3.0 D of cylinder, while the remaining 35 or 2.9% had astigmatism worse than −3.0 or +3.0 D of cylinder.
| Eye characteristics | Number of scans | Percentage (%) |
|---|---|---|
| Visual acuity | ||
| Better than 20/40 | 1871 | 80.9 |
| Worse than 20/40 | 437 | 18.9 |
| None recorded | 5 | 0.2 |
| Refractive error | ||
| −6.0 SE to +5.0 SE | 1141 | 49.3 |
| Worse than −6.0 SE or +5.0 SE | 81 | 3.5 |
| None recorded | 1091 | 47.2 |
| Astigmatism | ||
| −3.0 to +3.0 cylinder | 1186 | 51.3 |
| Worse than −3.0 or +3.0 cylinder | 36 | 1.56 |
| None recorded | 1091 | 47.2 |
| Glaucoma stage | ||
| Normal | 266 | 11.5 |
| Mild | 1283 | 55.5 |
| Moderate | 341 | 14.7 |
| Severe | 273 | 11.8 |
| None recorded | 15 | 6.5 |
| Visual field reliability | ||
| Reliable | 1611 | 69.7 |
| Unreliable | 526 | 22.7 |
| None recorded | 176 | 7.6 |
| Cataract | ||
| No cataract | 324 | 14.4 |
| Trace or 1+ | 1271 | 54.9 |
| 2+ or worse | 199 | 8.6 |
| IOL | 487 | 21.1 |
| None recorded | 22 | 1.0 |
Of the 2313 scans that were obtained from 1188 patients, the most common diagnosis was open-angle glaucoma, which represented 34.0% of the scans. The second most common condition was glaucoma suspect, which included 18.5% of the scans. Following that, in order of descending frequency, the findings included normal (12.6%), ocular hypertension (9.6%), narrow-angle glaucoma (8.0%), and pediatric glaucoma (0.97%). A total of 16.3% of the scans represented findings in the “other” category, including diagnoses of aphakic glaucoma, chronic angle-closure glaucoma, physiologic cupping, congenital glaucoma, juvenile open-angle glaucoma, mixed-mechanism glaucoma, normal-tension glaucoma, neovascular glaucoma, pseudoexfoliation glaucoma, pigment dispersion glaucoma, and traumatic glaucoma. A small number of patients with other ophthalmic conditions that were seen on the glaucoma service were also included, such as iridocorneal endothelial syndrome, plateau iris configuration, and retinal abnormalities.
Frequency of Artifacts
At least 1 artifact was noted in 1070 of 2313 eye scans (46.3%). Among them, 820 scans had 1 artifact, 196 scans had 2 different types of artifact, and 54 scans had 3 or more types of artifact. Of the 12 types of artifacts, decentration error was the most common artifact (27.8%, Table 2 ). The next most common artifact was related to the presence of a PVD (14.4%, Table 2 ).
| Artifact Number | Artifact | Number of Scans | Percentage of Scans (%) |
|---|---|---|---|
| 1 | Anterior RNFL misidentification | 73 | 3.16 |
| 2 | Posterior RNFL misidentification | 177 | 7.7 |
| 3 | Incomplete segmentation | 14 | 0.6 |
| 4 | Decentration | 644 | 27.8 |
| 5 | Poor signal | 118 | 5.10 |
| 6 | Missing parts | 35 | 1.51 |
| 7 | Cut edge | 4 | 0.17 |
| 8 | Motion artifact | 5 | 0.22 |
| 9 | PVD-associated error | 332 | 14.4 |
| 10 | PPA-associated error | 27 | 1.2 |
| 11 | Staphyloma-associated error | 1 | 0.04 |
| 12 | MNFL-associated error | 1 | 0.04 |
Univariable Analysis of Patient Demographics and Eye Characteristics and Artifact Frequency
Scans with at least 1 artifact were more likely to occur in patients with vision worse than 20/40 compared to those with vision better than 20/40, with an odds ratio of 1.98 (95% CI [1.59–2.48], P < .0001, Table 3 ). The presence of cataracts was also associated with an increased likelihood of artifact. The odds ratios of a scan having at least 1 artifact in those with trace to 1+ cataract, 2+ cataract, or an intraocular lens compared to no cataract were 1.79 (95% CI [1.32–2.42], P = .0002), 2.9 (95% CI [1.90–4.44], P < .0001), and 2.26 (95% CI [1.61–3.16], P < .0001), respectively ( Table 3 ).


