Purpose
To present an overview of the measurement errors for various biometric devices, as well as a meta-analysis of the agreement between biometric devices using the Pentacam, Orbscan, and IOL Master as a reference.
Design
Meta-analysis of the literature.
Methods
The meta-analysis is based on data from 216 articles that compare a total of 24 different devices with the reference devices for the following 9 parameters: mean, steep and flat curvature of the anterior and posterior cornea; central corneal thickness; anterior chamber depth; and axial length. After the weighted average difference between devices has been determined, the “two one-sided t test” was used to test for equivalence between devices within certain thresholds defined by the measurement errors and the influence of these differences on the calculated refraction.
Results
In only 17 of the 70 comparisons a device was equivalent with the reference device within the thresholds set by the measurement error. More lenient thresholds, based on a change in calculated refraction of ±0.25 diopter, increased this number to a maximum of 25/50 comparisons (excluding pachymetry). High degrees of inconsistency were seen in the reported results, which could partially explain the low agreement between devices.
Conclusion
As a rule, biometry measurements taken by different devices should not be considered equivalent, although several exceptions could be identified. We therefore recommend that clinical studies involving multiple device types treat this as a within-subject variable to avoid bias. The follow-up of individual patients using different devices should be avoided at all times.
Reliable biometry is an essential part of any ophthalmic practice. For this reason, a wide range of instruments have been put on the market, each purporting to have the highest degree of accuracy. But although these devices have undoubtedly been developed and tested according to the state of the art, they will all suffer from errors and sensitivities intrinsic to the measurement process. These present themselves as variations between consecutive acquisitions, and between acquisitions made by different observers or devices.
For individual clinics this large variety in available equipment is inconsequential, as they usually own only a few instruments operated consistently by a limited number of experienced individuals. This ensures that the best possible biometry is obtained in the clinical follow-up of each patient. But for research projects, often involving any number of clinics working together, each with their own choice of biometry devices, these equipment differences may form an important confounding factor to the study design.
Typically this problem is handled in 2 ways: either only clinics that own a particular “preferred” device are selected for participation, or equipment differences are simply ignored. Both approaches have their disadvantages, however, as selection may exclude clinics that could otherwise make interesting contributions to the study, and ignoring the differences may introduce systematic errors into the analysis. Hence, before ignoring equipment differences and inserting measurements from different devices into a single database, it is imperative that their agreement and measurement errors have been validated statistically. But although this has already been done quite extensively in the literature for many parameters and many combinations of devices, the results in these reports are often contradictory to each other and authors have very different opinions on what may be considered an acceptable error.
It is therefore the aim of this work to present an overview of the measurement errors of the biometry devices available in the literature, as well as of the agreement between these devices and 3 of the most commonly used clinical instruments: the Pentacam Scheimpflug camera (Oculus Optikgeräte, Wetzlar, Germany) and Orbscan scanning slit corneal topographer (Bausch & Lomb, Bridgewater, New Jersey, USA) for the anterior segment biometry, and the IOL Master (Carl Zeiss, Jena, Germany) for axial length measurements. Any systematic differences identified will then be compared to a number of clinical standards, in order to verify which of these differences may have an actual clinical impact.
Methods
Literature Search
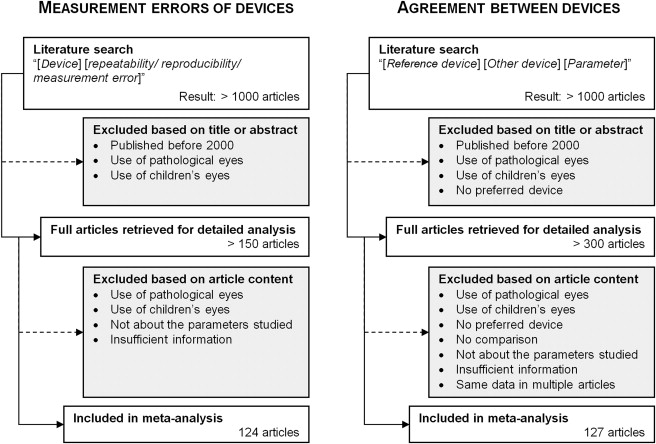
The literature search was performed in 2 parts: first, a search for reports on the measurement errors of biometric devices, followed by a second, independent search for reports comparing the measurements of biometry devices with those of the reference instruments. Given the number of parameters and number of devices involved in this work, the literature search was performed through combinations of keywords.
For the study on the measurement errors these keywords were structured as “[ Device ] [ Parameter ] [ repeatability/reproducibility/measurement error ],” with [ Device ] the name of the biometry device and [ Parameter ] the parameter of interest. For the meta-analysis of the comparison between devices, the structure of the keywords was “[ Device 1 ] [ Device 2 ] [ Parameter ],” with [ Device 1 ] being Pentacam, OrbScan, or IOL Master and [ Device 2 ] the name of another device (eg, Sirius, Galilei, …) or a generic technological name (eg, Placido, ultrasound, …).
The literature search was performed in June 2014 using PubMed and Google Scholar. It included both English and non-English references published after the year 2000, thus avoiding results obtained using outdated versions of the devices or their software. Since biometric devices are typically calibrated using eye models that are close to the epidemiologic average (eg, the Gullstrand eye model), only articles using healthy adult eyes were considered in this analysis. The only exceptions were papers comparing corneal or anterior chamber parameters in cataract patients, as these measurements are not influenced by the condition of the lens. For the comparison of axial length measurements, however, cataract patients were excluded.
Finally a selection was made based on the way the remaining articles presented their data. For the study on measurement errors, only those reporting the standard deviation of the repeated measurements, or parameters that can be calculated back to the standard deviation, were included. For the meta-analysis of the comparison, both the average and the standard deviation of the difference between devices (or the 95% limits of agreement) had to be reported, along the lines suggested by Altman and Bland and McAlinden and associates.
It should be noted that for the Orbscan a distinction was made between comparative articles that use the “acoustic factor” (AF) to report the central corneal thickness and articles that do not. This AF typically has a value of 0.92 (although different values are used as well) and aims to correct for an overestimation of the corneal thickness by the Orbscan. Also, for the anterior chamber depth (ACD) there were articles that included the cornea into the measurement value and other articles that did not. However, these articles were not considered separately owing to there being an insufficient number of articles to warrant a separate analysis.
Measurement Error
The measurement error E meas may be defined by E meas = ( E 2 repeat + E 2 reprod ) 1/2 , which is composed of the repeatability E repeat , the standard deviation of multiple measurements performed by a single operator, and the reproducibility E reprod , the standard deviation between measurements performed at different sessions or by different operators. Although in principle there could also be calibration differences between devices of the same type, we were unable to include this factor into our analysis, as very little information on this type of error is available.
To obtain a global estimate of the repeatability and reproducibility of the various biometry devices, the numerical values found in the literature review were tabulated (made available as supplemental data at AJO.com ; Supplemental Table 1 ), from which the average of the repeatability and reproducibility, weighted by number of subjects used in each study, was calculated for each available device. From these values the measurement error E meas was then estimated using the above equation.
Meta-analysis
Based on the reported differences found in the literature, a series of meta-analyses were performed per parameter and per device pair (ie, Devices 1 and 2) using the procedures described by Borenstein and associates. This provides a global average and standard deviation of the difference between devices, a P value indicating its statistical significance and a coefficient I² to quantify the homogeneity between articles (with values of 0% indicating low homogeneity and 100% high homogeneity). The Bonferroni correction was used to adjust for multiple testing.
It should be noted that a difference that is not statistically significant from zero does not automatically imply that both devices are to be considered equivalent, as the range of the differences may still be wider than what is considered clinically acceptable. For this reason, equivalence margins were defined based on either the devices’ measurement error or several common clinical calculations. These margins were used to test for equivalence by means of a “two one-sided t test” (TOST).
Analysis of Significant Differences
Although the measurement error of a biometric device ( E meas ) may be considered as the lowest possible threshold for clinical importance, providing a reliable and well-founded set of equivalence margins, it is probably too strict for most clinical applications. This means that even though a difference between 2 devices may be considered too large according to the E meas margins, it may still be clinically inconsequential.
For this reason, several other, more lenient equivalence margins were defined based on the influence measurement differences would have on typical ophthalmic and optometric calculations ( Table 1 ). These calculations included the refraction S calc calculated from the ocular biometry using the thick lens formula, and the intraocular lens (IOL) powers calculated using the SRK/T and Haigis formulas. Setting the tolerance for the changes in calculated power ( ΔS calc ) to 0.125 diopter (D) and 0.25 D, corresponding with 50% and 100% of the smallest step in spectacle correction and the measurement error on most autorefractometers, we then determined the respective biometric changes that would cause just such a change in the calculations. These changes were then used as clinically based equivalence margins.
| Parameter | K a,m | K p,m | CCT | ACD | L |
|---|---|---|---|---|---|
| Unit | D | D | μm | mm | mm |
| Measurement error E meas | |||||
| E meas a | 0.152 b | 0.093 b | 8.12 | 0.085 | 0.046 |
| Change in calculated refraction ΔS calc | |||||
| 0.125 D | 0.122 | 0.122 | – | 0.095 | 0.046 |
| 0.250 D | 0.244 | 0.244 | – | 0.192 | 0.093 |
| Change in IOL power (SRK/T) c | |||||
| 0.125 D | 0.118 | – | – | – | 0.042 |
| 0.250 D | 0.235 | – | – | – | 0.082 |
| Change in IOL power (Haigis) c | |||||
| 0.125 D | 0.087 | – | – | 0.300 | 0.037 |
| 0.250 D | 0.174 | – | – | 0.600 | 0.074 |
a Derived from the measurement errors in Table 2 , averaged over all devices except those designated outliers in the text.
b For steep and flat axes different values were used, determined in the same manner ( K a,s : 0.185 D; K a,f : 0.178 D; K p,s : 0.062 D; K p,f : 0.062 D).
c Using IOL constants of the Alcon AcrySof SA60AT IOL ( A = 118.4; Haigis a 0 = −0.111, a 1 = 0.249, a 2 = 0.179), targeting emmetropia (available at http://www.augenklinik.uni-wuerzburg.de/ulib/c1.htm , accessed August 8, 2014).
The biometric parameters required for the calculations were taken from the Gullstrand eye model, while the IOL constants were those of the AcrySof SA60AT spherical, monofocal IOL (Alcon, Hünenberg, Switzerland).
Software
All calculations were performed using Excel 2010 (Microsoft Corp, Redmond, Washington, USA) and OpenMeta[Analyst], which is an R-based open source software package for meta-analysis (available at http://www.cebm.brown.edu/open_meta ; accessed August 8, 2014).
Results
Literature Search
After the selection process detailed in the Figure , the literature search resulted in 124 articles for the measurement error analysis and 127 for the comparison between the reference instruments (Oculus Pentacam, Bausch & Lomb Orbscan, and Zeiss IOL Master) and a wide range of methods, including Scheimpflug, optical coherence tomography (OCT), Placido topography, partial coherence interferometry, immersion ultrasound, and applanation ultrasound devices.
Owing to the wide variety of Placido- and ultrasound-based devices reported in the literature, the generic name of the technology was used rather than actual brand names. Also, for a number of less commonly used devices (eg, Zeiss AC Master and slit lamp with Jaeger attachment), data were not included in the tables ( Tables 2–4 ) presented here. Instead, this information is made available as supplemental data at AJO.com ( Supplemental Tables 1–4 ).
| Device | E repeat (# Studies) | E reprod (# Studies) | E meas |
|---|---|---|---|
| Anterior mean keratometry ( K a,m ) (D) | |||
| Pentacam | 0.09 (8) | 0.15 (7) | 0.18 |
| Galilei | 0.10 (3) | 0.07 (1) | 0.12 |
| Sirius | 0.12 (4) | 0.09 (1) | 0.15 |
| Orbscan | 0.33 (1) | 0.40 (1) | 0.52 |
| Placido | 0.10 (12) | 0.10 (10) | 0.14 |
| IOL Master | 0.14 (5) | 0.07 (2) | 0.16 |
| Lenstar | 0.10 (1) | – | – |
| Aladdin | – | 0.09 (1) | – |
| Anterior steep keratometry (K a,s ) (D) | |||
| Pentacam | 0.12 (10) | 0.17 (9) | 0.20 |
| Galilei | 0.21 (2) | 0.06 (2) | 0.22 |
| Sirius | 0.11 (3) | 0.10 (1) | 0.15 |
| Orbscan | 0.17 (2) | 0.12 (2) | 0.21 |
| Placido | 0.14 (12) | 0.13 (9) | 0.19 |
| IOL Master | 0.10 (3) | 0.10 (2) | 0.14 |
| Lenstar | 0.14 (4) | 0.12 (3) | 0.18 |
| Anterior flat keratometry (K a,f ) (D) | |||
| Pentacam | 0.12 (10) | 0.19 (9) | 0.22 |
| Galilei | 0.17 (2) | 0.09 (2) | 0.19 |
| Sirius | 0.09 (3) | 0.09 (1) | 0.13 |
| Orbscan | 0.15 (2) | 0.12 (2) | 0.19 |
| Placido | 0.13 (12) | 0.11 (9) | 0.17 |
| IOL Master | 0.07 (3) | 0.08 (2) | 0.10 |
| Lenstar | 0.11 (4) | 0.22 (2) | 0.24 |
| Posterior mean keratometry (K p,m ) (D) | |||
| Pentacam | 0.03 (4) | 0.04 (5) | 0.05 |
| Galilei | 0.04 (4) | 0.04 (2) | 0.06 |
| Sirius | 0.02 (1) | – | – |
| Orbscan | 0.13 (2) | 0.11 (2) | 0.17 |
| Posterior steep keratometry (K p,s ) (D) | |||
| Pentacam | 0.04 (3) | 0.06 (4) | 0.07 |
| Galilei | 0.04 (1) | 0.04 (1) | 0.06 |
| Sirius | 0.04 (1) | – | – |
| Posterior flat keratometry ( K p,f ) (D) | |||
| Pentacam | 0.04 (3) | 0.05 (4) | 0.06 |
| Galilei | 0.03 (1) | 0.04 (1) | 0.05 |
| Sirius | 0.04 (1) | – | – |
| Central corneal thickness (CCT) (μm) | |||
| Pentacam | 4.56 (19) | 5.38 (11) | 7.05 |
| Galilei | 1.96 (10) | 1.76 (3) | 2.64 |
| Sirius | 2.92 (7) | 3.75 (1) | 4.76 |
| Orbscan | 5.60 (16) | 8.57 (5) | 10.24 |
| Ultrasound | 4.66 (31) | 8.68 (15) | 9.85 |
| Artemis | 5.23 (5) | 15.87 (1) | 16.71 |
| Visante | 3.89 (18) | 6.86 (10) | 7.88 |
| RT-Vue | 2.42 (14) | 2.56 (6) | 3.52 |
| SL-OCT | 3.92 (3) | 7.50 (1) | 8.46 |
| Lenstar | 3.77 (9) | 7.09 (5) | 8.03 |
| OA-1000 | 2.18 (1) | – | – |
| Spec Micr | 4.36 (7) | 9.24 (4) | 10.21 |
| Anterior chamber depth (ACD) (mm) a | |||
| Pentacam | 0.03 (9) | 0.03 (5) | 0.05 |
| Galilei | 0.01 (5) | 0.04 (2) | 0.05 |
| Sirius | 0.02 (4) | – | – |
| Orbscan | 0.03 (3) | 0.04 (1) | 0.05 |
| Ultrasound | 0.10 (7) | 0.23 (1) | 0.25 |
| Artemis | 0.02 (2) | – | – |
| Visante | 0.03 (4) | 0.04 (3) | 0.05 |
| SL-OCT | 0.01 (2) | – | – |
| IOL Master | 0.05 (5) | 0.04 (2) | 0.06 |
| Lenstar | 0.03 (8) | 0.08 (2) | 0.09 |
| OA-1000 | 0.09 (1) | – | – |
| Aladdin | – | 0.06 (1) | – |
| Axial length (L) (mm) | |||
| IOL Master | 0.02 (5) | 0.02 (3) | 0.03 |
| Lenstar | 0.02 (6) | 0.02 (2) | 0.02 |
| OA-1000 | 0.08 (1) | – | – |
| Aladdin | – | 0.03 (1) | – |
| Ultrasound | 0.11 (2) | – | – |
a Includes studies that define anterior chamber depth as the distance between the corneal epithelium and anterior lens, as well as those that define it as the distance between corneal endothelium and anterior lens.
| Device | M | Δ ± SEM | I² ( % ) | Meta a | TOST a , b | ||
|---|---|---|---|---|---|---|---|
| | Δ | <E meas | | ΔS calc | < 0.125 D | | ΔS calc | < 0.25 D | |||||
| Mean anterior keratometry ( K a,m ) | |||||||
| Ziemer Galilei | 2 | −0.22 ± 0.19 | 99% | 0.247 | 0.515 | 0.697 | 0.450 |
| CSO Sirius | 4 | −0.09 ± 0.16 | 100% | 0.586 | 0.211 | 0.410 | 0.159 |
| Tomey TMS-5 | 1 | −0.23 ± 0.05 | – | <0.001 | 0.630 | 0.981 | 0.394 |
| B&L Orbscan | 3 | −0.16 ± 0.28 | 99% | 0.560 | 0.428 | 0.557 | 0.384 |
| Placido device | 15 | −0.03 ± 0.04 | 98% | 0.430 | 0.001 | 0.008 | <0.001 |
| Haag-Streit Lenstar | 1 | 0.39 ± 0.20 | – | 0.051 | 0.812 | 0.910 | 0.767 |
| Zeiss IOL Master | 4 | −0.23 ± 0.08 | 97% | 0.004 | 0.585 | 0.016 | <0.001 |
| Steep anterior keratometry ( K a,s ) | |||||||
| Ziemer Galilei | 2 | 0.05 ± 0.04 | 40% | 0.155 | <0.001 | 0.037 | <0.001 |
| CSO Sirius | 2 | 0.13 ± 0.18 | 99% | 0.467 | 0.382 | 0.520 | 0.265 |
| B&L Orbscan | 2 | −0.04 ± 0.24 | 96% | 0.855 | 0.272 | 0.368 | 0.196 |
| Placido device | 14 | −0.01 ± 0.04 | 96% | 0.910 | <0.001 | 0.004 | <0.001 |
| Zeiss IOL Master | 2 | −0.23 ± 0.11 | 96% | 0.038 | 0.651 | 0.832 | 0.442 |
| Flat anterior keratometry ( K a,f ) | |||||||
| Ziemer Galilei | 2 | 0.03 ± 0.07 | 88% | 0.612 | 0.013 | 0.085 | 0.001 |
| CSO Sirius | 2 | −0.03 ± 0.05 | 90% | 0.563 | <0.001 | 0.016 | <0.001 |
| B&L Orbscan | 2 | −0.09 ± 0.18 | 95% | 0.633 | 0.304 | 0.421 | 0.190 |
| Placido device | 14 | −0.04 ± 0.04 | 97% | 0.293 | <0.001 | 0.019 | <0.001 |
| Zeiss IOL Master | 2 | −0.21 ± 0.15 | 98% | 0.140 | 0.597 | 0.737 | 0.418 |
| Mean posterior keratometry ( K p,m ) | |||||||
| Ziemer Galilei | 1 | −0.02 ± 0.01 | – | 0.004 | <0.001 | <0.001 | <0.001 |
| CSO Sirius | 1 | −0.10 ± 0.02 | – | <0.001 | 0.617 | 0.159 | <0.001 |
| Tomey TMS-5 | 1 | −0.08 ± 0.02 | – | <0.001 | 0.228 | 0.010 | <0.001 |
| B&L Orbscan | 2 | 0.18 ± 0.36 | 100% | 0.619 | 0.594 | 0.563 | 0.428 |
| Steep posterior keratometry ( K p,s ) | |||||||
| Ziemer Galilei | 1 | −0.03 ± 0.01 | – | <0.001 | <0.001 | <0.001 | <0.001 |
| Flat posterior keratometry ( K p,f ) | |||||||
| Ziemer Galilei | 1 | −0.01 ± 0.01 | – | 0.211 | <0.001 | <0.001 | <0.001 |
| Central corneal thickness (CCT) | |||||||
| Ziemer Galilei | 5 | −7.37 ± 3.13 | 99% | 0.019 | 0.405 | – | – |
| CSO Sirius | 6 | 2.16 ± 2.54 | 99% | 0.394 | 0.009 | – | – |
| Tomey TMS-5 | 1 | 17.24 ± 2.44 | – | <0.001 | 1.000 | – | – |
| B&L Orbscan (with AF) | 15 | 10.83 ± 2.57 | 97% | <0.001 | 0.854 | – | – |
| B&L Orbscan (Without AF) | 4 | −28.43 ± 9.81 | 99% | 0.004 | 0.981 | – | – |
| Ultrasound | 35 | 2.12 ± 1.14 | 98% | 0.063 | <0.001 | – | – |
| Zeiss Visante/Stratus | 6 | 13.57 ± 3.75 | 99% | <0.001 | 0.927 | – | – |
| OptoVue RT-Vue | 6 | 7.45 ± 4.21 | 99% | 0.076 | 0.436 | – | – |
| Heidelberg Eng. SL-OCT | 1 | 15.50 ± 1.37 | – | <0.001 | 1.000 | – | – |
| Haag-Streit Lenstar | 6 | 5.58 ± 1.80 | 98% | 0.002 | 0.079 | – | – |
| Oculus Corvis | 1 | 3.50 ± 26.90 | – | 0.896 | 0.432 | – | – |
| Specular microscopy | 6 | 19.76 ± 5.54 | 99% | <0.001 | 0.982 | – | – |
| Anterior chamber depth (ACD) c | |||||||
| Ziemer Galilei | 3 | −0.06 ± 0.05 | 100% | 0.226 | 0.339 | 0.269 | 0.007 |
| CSO Sirius | 5 | −0.04 ± 0.02 | 98% | 0.020 | <0.001 | <0.001 | <0.001 |
| B&L Orbscan | 11 | 0.05 ± 0.04 | 100% | 0.274 | 0.191 | 0.132 | <0.001 |
| Ultrasound | 6 | 0.07 ± 0.07 | 98% | 0.360 | 0.391 | 0.336 | 0.037 |
| Zeiss Visante/Stratus | 5 | −0.06 ± 0.02 | 97% | 0.000 | 0.113 | 0.034 | <0.001 |
| Heidelberg Eng. SL-OCT | 2 | 0.03 ± 0.00 | 0% | 0.000 | <0.001 | <0.001 | <0.001 |
| Casia SS-1000 | 1 | 0.10 ± 0.01 | – | 0.000 | 0.919 | 0.675 | <0.001 |
| Zeiss IOL Master | 9 | 0.09 ± 0.03 | 97% | 0.003 | 0.533 | 0.391 | <0.001 |
| Haag-Streit Lenstar | 5 | 0.04 ± 0.01 | 94% | 0.000 | <0.001 | <0.001 | <0.001 |
Stay updated, free articles. Join our Telegram channel

Full access? Get Clinical Tree


