Purpose
To describe the spectral-domain optical coherence tomography (SD-OCT) features of choroidal tumors imaged using enhanced depth imaging (EDI) technique.
Design
Prospective observational case series.
Methods
One tumor each from 23 eyes of 23 patients was included. All the patients underwent clinical fundus photography, ultrasonography, and EDI SD-OCT. Qualitative characteristics (tumor outline, reflectivity and/or shadowing of choroidal layers, and detection of inner sclera) and quantitative characteristics (measurement of maximum tumor thickness and the largest tumor diameter) were assessed.
Results
Patients (male = 12) were categorized as: amelanotic choroidal nevus (4), melanotic choroidal nevus (9), choroidal melanoma (3), circumscribed choroidal hemangioma (3), and choroidal metastasis (4). In all cases, EDI SD-OCT was able to identify the tumor distinctly from the surrounding normal choroid. Qualitative analysis revealed: amelanotic nevi, homogenous and medium reflective band with visible choroidal vessels; melanotic nevi and choroidal melanomas, high reflective band in the anterior choroid with shadowing, and nonvisualization of choroidal vessels and inner sclera; choroidal hemangiomas, medium/low reflective band without shadowing; and choroidal metastasis, low reflective band in the deep choroid with enlargement of the suprachoroidal space. Maximum tumor diameter and thickness was measurable by EDI SD-OCT only in 10 cases that were <9.0 mm in diameter and <1.0 mm in thickness (undetectable by ultrasonography).
Conclusions
It is possible to obtain cross-sectional views of a variety of choroidal tumors using EDI SD-OCT. Small choroidal tumors nondetectable by ultrasonography can be objectively measured by this technique.
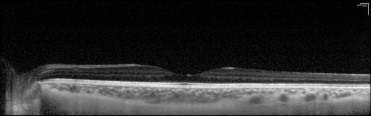
Spectral-domain optical coherence tomography (SD-OCT), also known as Fourier-domain OCT, has quickly replaced conventional time-domain OCT because of its superior speed, sensitivity, and resolution. Commercially available devices provide cross-sectional images of the retina with axial resolutions between 3 and 7 μm. In general, deeper layers of the choroid and sclera are not adequately imaged because of light scattering by the retinal pigment epithelium (RPE) and choroid, dense choroidal vasculature, and lower resolution and sensitivity with displacement of the image from zero-delay band. Recently, Spaide and associates have described a simple method using commercially available SD-OCT devices to image the choroid, called enhanced depth imaging (EDI). In this method, the OCT objective lens is pushed closer to the eye so that an inverted image is obtained on the scanner. This maneuver yields improved resolution of the deeper layers of the choroid and sclera, allowing measurement of choroidal thickness in normal and highly myopic eyes with a consequent reduction in resolution of the retinal image ( Figure 1 ).
To date, OCT studies of choroidal tumors have assessed retinal and RPE changes induced by choroidal tumors, since OCT has been less valuable to assess the intrinsic tumor patterns because of inadequate visualization of the choroid by the routine method of OCT image acquisition. In our pilot exploratory study, we describe the intrinsic optical characteristics of choroidal tumors imaged with EDI SD-OCT technique and correlate tumor measurements with ultrasonography.
Methods
Patients
After Cleveland Clinic Institutional Review Board approval, 23 consecutive patients who met the inclusion criteria were enrolled in the study. Inclusion criteria were: presence of choroidal tumor, evaluated at the Cole Eye Institute (from August to December 2009), age 18 years or more, clear media, posterior location (completely or partially posterior to the vascular arcade), and willingness to sign informed consent. All patients underwent detailed clinical examination including dilated fundus examination, digital fundus photography, and ultrasonographic evaluation. The final diagnosis and eventual management of all patients in this study were based upon clinical findings and results of the ancillary studies.
Optical Coherence Tomography Image Acquisition
In addition, all patients were imaged using the Heidelberg Spectralis (Heidelberg Engineering, Heidelberg, Germany) using EDI techniques as originally described by Spaide. To image the choroidal lesion, the SD-OCT was placed close to the eye so as to generate an inverted image on the top of the computer display. Each lesion was scanned by adding +2.00 diopter lens power setting on the focus knob with at least one vertical and one horizontal line section passing through the major diameter of the lesion. A field of 20 × 30 degrees with up to a 9-mm line section was used. The resulting SD-OCT image was an average of 100 images. A total of 1536 A-scans per second were utilized to generate an axial resolution of 7.0 microns. OCT acquisition was made along with an infrared, real-time fundus image, which allowed point-to-point correlation between the fundus image and the OCT scans. In some cases, additional SD-OCT images in conventional acquisition mode (non-EDI) were also obtained using either the Spectralis, Stratus (Carl Zeiss Meditec Inc, Newark, California, USA), or Topcon OCT-1000 (Topcon Inc, Paramus, New Jersey, USA) scanners.
Optical Coherence Tomography Image Analysis
Qualitative analysis of the SD-OCT images included identifying the tumor outline, status of the choroidal layers within the tumor (inner choriocapillaris and the outer large vessels), and detection of the inner sclera. Associated retinal and RPE changes were also recorded. The RPE and vitreous served as reference for the strength of reflectivity from the choroidal layers and the tumor, with the RPE considered the brightest intensity of reflectivity and the vitreous the lowest. Intermediate intensity between these extremes was coded as medium reflectivity ( Figure 1 ). Quantitative analysis comprised measuring the maximum tumor thickness from the hyperreflective line corresponding to the Bruch membrane/RPE junction to the inner sclera and measurement of the largest tumor diameter using the caliper within the SD-OCT machine.
Results
Twenty-three eyes of 23 patients were included in the study. There were 12 male and 11 female patients. The clinical diagnostic categories for the eyes were amelanotic choroidal nevus (4), melanotic choroidal nevus (9), choroidal melanoma (3), circumscribed choroidal hemangioma (3), and choroidal metastasis (4) ( Table 1 ).
| Clinical Diagnosis | Tumor Identification | Choroidal Reflection | Shadowing | Choriocapillaris | Large Vessels | Inner Sclera |
|---|---|---|---|---|---|---|
| Amelanotic nevus | + | Medium | − | + | + | + |
| + | Medium | − | + | + | + | |
| + | Medium | − | + | + | + | |
| + | Medium | − | + | + | + | |
| Melanotic nevus | + | High | + | + | − | − |
| + | High | + | + | − | − | |
| + | High | − | + | + | + | |
| + | High | + | − | − | − | |
| + | High | + | − | + | − | |
| + | High | + | + | − | − | |
| + | High | + | + | − | − | |
| + | High | + | − | + | − | |
| + | High | + | + | + | − | |
| Melanoma | + | High | + | − | − | − |
| + | High | + | − | − | − | |
| + | High | + | − | − | − | |
| Hemangioma | + | Medium/Low | + | + | − | − |
| + | Low | + | − | − | − | |
| + | Low | + | − | − | − | |
| Metastasis | + | Low | − | + | + | + |
| + | Low | − | + | + | + | |
| + | Low | − | + | + | + | |
| + | Low | − | + | + | + |
Qualitative analysis revealed that in all cases, EDI SD-OCT was capable of identifying the tumor distinctly from surrounding tissues, including anteriorly from the hyperreflective Bruch membrane/RPE layer and laterally from the normal choroid. However, the interphase between the posterior limit of the tumor and the inner sclera was only visible in nine tumors that were less than 0.9 mm in height. In larger tumors, the outer band was out of the field of the OCT device.
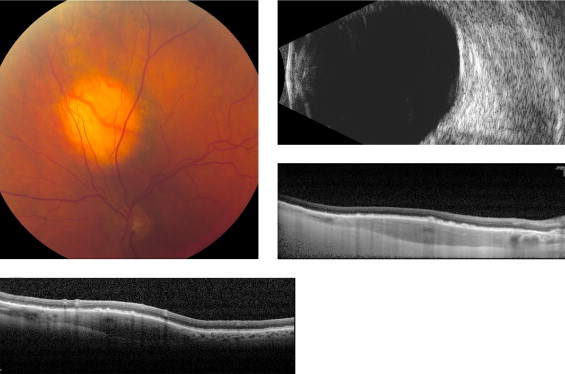
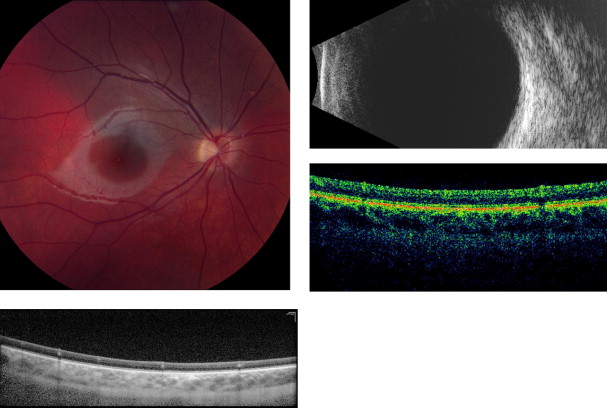
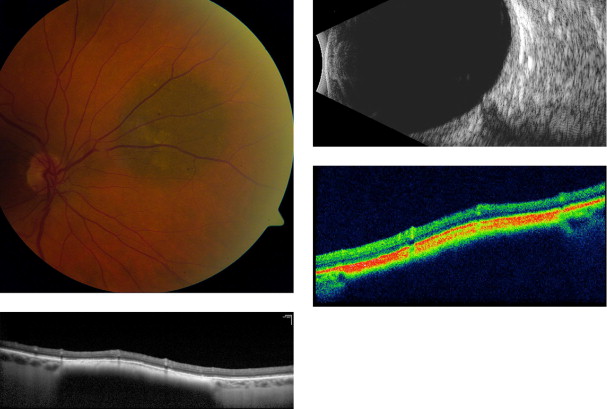
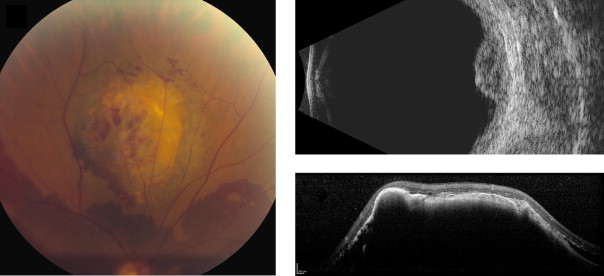
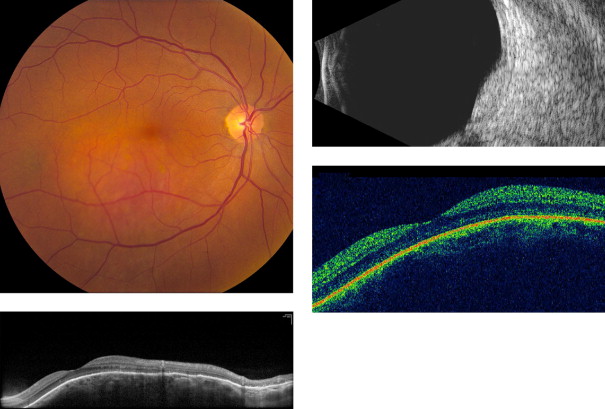
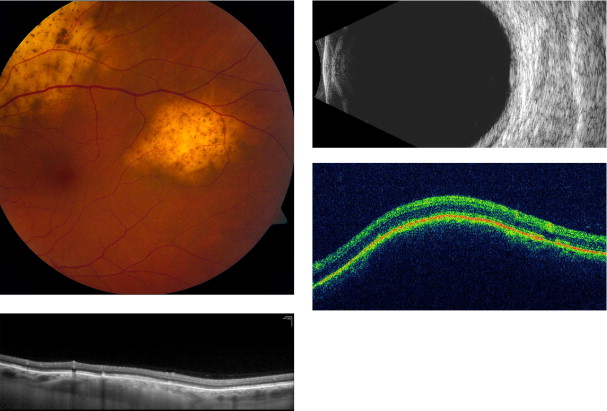
Amelanotic nevi appeared homogenous with a medium reflective band associated with visible choroidal vessels within the tumor ( Figure 2 ). One case of a diffuse melanotic nevus (melanocytosis) appeared as a highly reflective, thickened choroidal band without shadowing ( Figure 3 ). Melanotic nevi appeared as a highly reflective band within the choriocapillaris layer with posterior shadowing ( Figure 4 ). Choroidal melanomas showed a highly reflective band in the anterior choroid with lack of visibility of either the choroidal vessels or inner sclera ( Figure 5 ). Circumscribed choroidal hemangiomas appeared as a medium to low reflective band with a homogenous signal and intrinsic spaces ( Figure 6 ). Choroidal metastasis revealed a hyporeflective band in the deeper choroid causing enlargement of the suprachoroidal space ( Figure 7 ) ( Table 1 ). Overlying retinal changes on OCT included retinal atrophy, intraretinal edema, and subretinal fluid. Associated RPE changes seen on color photography included drusen, localized RPE detachment, and lipofuscin deposit ( Table 2 ).
Stay updated, free articles. Join our Telegram channel

Full access? Get Clinical Tree


