Purpose
To evaluate how optical coherence tomography (OCT) angiography depicts clinical fundus findings in patients with diabetic retinopathy (DR).
Design
Prospective study evaluating imaging technology.
Methods
Forty-seven eyes of 25 patients with DR were scanned using a high-speed 840-nm-wavelength spectral-domain optical coherence tomography instrument (RTVue XR Avanti; Optovue, Inc, Fremont, California, USA). Blood flow was detected using the split-spectrum amplitude-decorrelation angiography algorithm. Fluorescein angiography (FA) images were also obtained in all eyes and the ability to visualize microaneurysms, retinal nonperfused areas, and neovascularization was compared with that of the en face OCT angiograms.
Results
In 42 eyes, microaneurysms detected by FA near the macula appeared as focally dilated saccular or fusiform capillaries on OCT angiograms of the superficial and/or deep capillary plexus. Retinal nonperfused areas visualized by FA appeared as lesions with no or sparse capillaries on OCT angiograms. Area measurement of retinal nonperfusion near the macula in 7 eyes revealed a difference between the extent of nonperfused areas in superficial and deep plexuses. In 4 eyes, the vascular structures of neovascularization at the optic disc were clearly visualized on OCT angiograms. Decreases and re-increases of flow in new vessels were quantified in an eye treated with anti–vascular endothelial growth factor.
Conclusions
OCT angiography can clearly visualize microaneurysms and retinal nonperfused areas and enables closer observation of each layer of the retinal capillaries. Quantitative information on new vessels can also be obtained. OCT angiography may be clinically useful to evaluate the microvascular status and therapeutic effect of treatments for DR.
Diabetic retinopathy (DR) is the leading cause of blindness in the working population in industrially developed countries. Because the number of patients with DR and vision-threatening DR is expected to increase, further research is warranted on the methods for evaluating clinical conditions of DR and on treatment advances.
Fluorescein angiography (FA) is a vitally important diagnostic tool for evaluating clinical fundus features of DR. FA can detect primary vascular lesions (eg, microaneurysms) and advanced vascular abnormalities such as venous beading and intraretinal microvascular abnormalities (IRMA). Retinal nonperfusion, which represents intraretinal capillary occlusion or dropout, can be visualized as a dark area surrounded by large retinal vessels. Neovascularization can be identified by remarkable leakage of the dye toward the vitreous cavity. Diagnosis of DR progression using FA could be integral to enabling decisions on treatment indications; however, intravenous dye injections should be performed carefully because patients with severe DR tend to have systemic vascular complications such as severe renal disorder and clinical or subclinical cardiovascular disease. Even in healthy subjects, dye injections can also occasionally cause nausea and, rarely but critically, anaphylaxis. Furthermore, FA cannot separately visualize the intraretinal structures of the major capillary networks; the images of the superficial capillaries and deep capillaries overlap because FA images are limited to 2 dimensions.
Optical coherence tomography (OCT) is a noninvasive technique that provides micrometer-level axial resolution in cross-sectional retinal imaging and has been clinically adopted as the standard to observe structural changes of diabetic retinopathy, such as diabetic macular edema. Recently, several theoretically based OCT angiography methods were developed for 3-dimensional noninvasive vascular mapping at the microcirculation level. In particular, the use of the split-spectrum amplitude-decorrelation angiography algorithm improves the signal-to-noise ratio of flow detection; thus, OCT angiography applying this algorithm can clearly visualize chorioretinal vascular lesions. In this study, using newly developed OCT angiography, we evaluated its ability to visualize the pathologic vascular changes of DR, focusing especially on microaneurysms, retinal nonperfusion, and neovascularization.
Methods
Study Population
This prospective study evaluating imaging technology was conducted at Asahikawa Medical University from August 27, 2014, through November 24, 2014. The study was performed in adherence with the tenets of the Declaration of Helsinki and was approved prospectively by our institutional review board at the Asahikawa Medical University. Informed consent was obtained from all subjects to participate in this research. Twenty-five patients with diabetes mellitus were recruited. Patients diagnosed with DR underwent comprehensive ophthalmologic examinations, including measurement of the best-corrected visual acuity (BCVA), slit-lamp biomicroscopy, color fundus photography, FA, and OCT. The FA was performed with Spectralis HRA + OCT (Heidelberg Engineering, Heidelberg, Germany). Exclusion criteria were the presence of severe media opacities, such as severe cataract or vitreous hemorrhage.
Optical Coherence Tomography Angiography
The instrument used for the OCT images was based on the RTVue XR Avanti (Optovue Inc, Fremont, California, USA) and was used to obtain OCT angiograms as previously described by Spaide and associates. This instrument has an A-scan rate of 70 000 scans per second, using a light source centered on 840 nm and a bandwidth of 50 nm. The tissue resolution is 5 μm axially and there is a 15-μm beam width. Each B-scan contained 316 A-scans. Two consecutive B-scans (M-B frames) were captured at a fixed position before proceeding to the next sampling location. The volumes were registered and the B-scan images were compared to calculate the decorrelation in the images; the decorrelation was viewed as the maximal projection image of blood flow. Because the retina is a laminar structure with a corresponding stratification of blood supply, segmentation of the retina in specific layers allows simple en face visualization of the corresponding vascular supply in that layer.
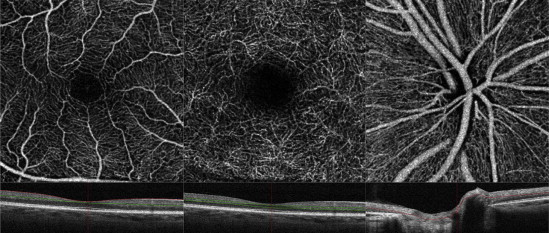
The scanning area was captured in 3 × 3-mm sections and was centered on the fovea, on the optic disc head, or on the region of interest within 6 mm of the fovea or optic disc. We segmented OCT angiograms as follows. The ganglion cell layer is invested with 1 or more layers of capillaries. The en face image was segmented with an inner boundary at 3 μm beneath the internal limiting membrane and the outer boundary was set at 15 μm beneath the inner plexiform layer (IPL) to obtain images of the superficial vascular layers (defined as superficial plexus). On the other hand, the inner nuclear layer is ordinarily bracketed by a layer of capillaries on either side. The en face image was segmented with an inner boundary at 15 μm beneath the IPL and the outer boundary was set at 70 μm beneath the IPL to obtain images of the deep vascular layers (defined as deep plexus). Regarding OCT angiograms around the optic disc head, the superficial vascular layers were imaged starting with the outer border of the vitreous cavity as reference and selecting sufficient thickness to include the ganglion cell layer. Figure 1 shows the OCT angiograms of superficial and deep plexuses centered on the fovea and a superficial OCT angiogram centered on the optic disc in a normal control case (62-year-old man). It also shows the layer segmentation in OCT B-scan for each OCT angiogram.
Evaluation of Vascular Lesions and Statistical Analysis
For evaluation of microaneurysms in this pilot study, we used 3 × 3-mm images centered on the fovea. The criterion for classifying a lesion as a microaneurysm was a distinctly round hyperfluorescent spot in early- and/or late-phase FA. Saccular capillary ends were considered to represent microaneurysms. We investigated how the microaneurysms detected by FA could be depicted in the OCT angiograms. With regard to quantitative measurement of the retinal nonperfused area, we traced the border between the area in which no or few abnormal capillaries (representing capillary pruning ) were observed and the area in which dense capillaries were visualized within 3 × 3-mm sectional OCT angiograms of superficial and deep plexuses near the macula. We measured the traced area (expressed in mm 2 ) using ImageJ 1.48 software (NIH, Bethesda, Maryland, USA). To quantify the vascular structural changes of neovascularization at the disc (NVD), the NVD flow area was calculated from the superficial OCT angiograms around the optic disc head. The NVD flow area of the same lesion above the disc was calculated by multiplying the number of pixels (for which the decorrelation value was above that of the background) and the pixel size using the contained software (ReVue, version 2014.2.0.65; Optovue Inc, Fremont, California, USA).
Measurements of nonperfused area and NVD flow area represented the average data made by 2 observers (K.S. and T.T.) who were masked to the clinical status. The measured nonperfused areas on OCT angiograms were expressed as the mean ± standard error of the mean. The Wilcoxon signed rank test was used to compare superficial nonperfused areas to the deep ones. SPSS statistics software version 19.0 (SPSS Inc, an IBM Company, Chicago, Illinois) was used for statistical analysis. A probability ( P ) value <.05 was considered statistically significant.
Results
A total of 47 eyes of 25 patients (17 male and 8 female) with DR at different stages were imaged using the RTVue XR Avanti and OCT angiograms around the macula and optic disc were obtained. The patients ranged in age from 32 to 78 years, with a mean age of 61 years. According to the International Clinical Diabetic Retinopathy and Diabetic Macula Edema Disease Severity Scales, there were 11 eyes with mild nonproliferative diabetic retinopathy (NPDR), 13 eyes with moderate NPDR, 12 eyes with severe NPDR, and 11 eyes with proliferative diabetic retinopathy (PDR) in this study. Three eyes were excluded because they could not be scanned with OCT angiography owing to severe cataract (2 eyes) and vitreous hemorrhage (1 eye).
Microaneurysms Evaluated With Fluorescein Angiography and Optical Coherence Tomography Angiography
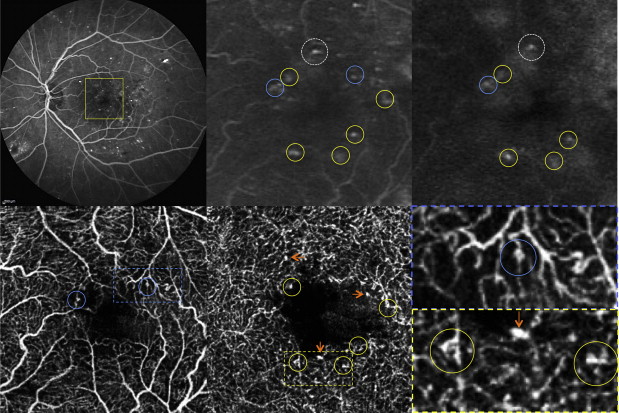
Scattered microaneurysms were detected as hyperfluorescent dots in the early and/or late phases of FA images. In 42 eyes, most of the microaneurysms were identified as focally dilated saccular or fusiform capillaries in the 3 × 3-mm area of the en face OCT angiograms centered on the fovea. The OCT angiographic technique could visualize the origin of microaneurysms within the layers: microaneurysms originated from the superficial and/or deep plexus. A typical case in which microaneurysms were visualized by OCT angiograms is shown in Figure 2 . This was a 70-year-old woman who had moderate NPDR with slight macular edema in her left eye with a BCVA of 20/25. FA showed many hyperfluorescent spots representing microaneurysms in the early and/or late phase. On OCT angiograms, microaneurysms were visualized as demarcated saccular or fusiform shapes of focally dilated capillary vessels in the superficial and deep plexuses ( Figure 2 ). Besides this, some hyperfluorescent spots on FA images were not clearly visualized on any OCT angiograms of the superficial or deep plexus. Conversely, some well-demarcated and dot-like capillaries on OCT angiograms closely resembled other microaneurysms in appearance but were not depicted by FA. No MAs were observed on OCT angiograms of the outer retina (data not shown).
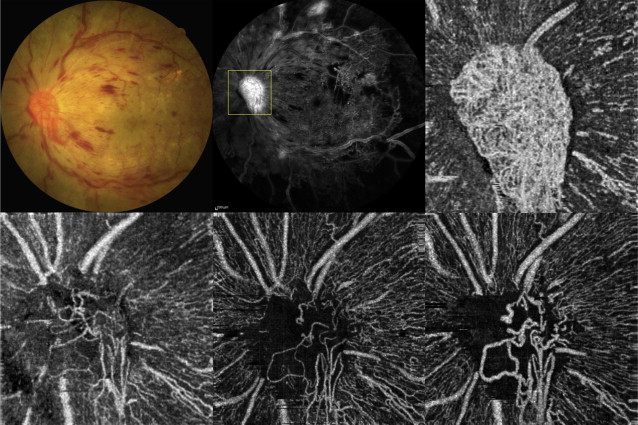
Visualization and Quantification of Retinal Nonperfused Areas
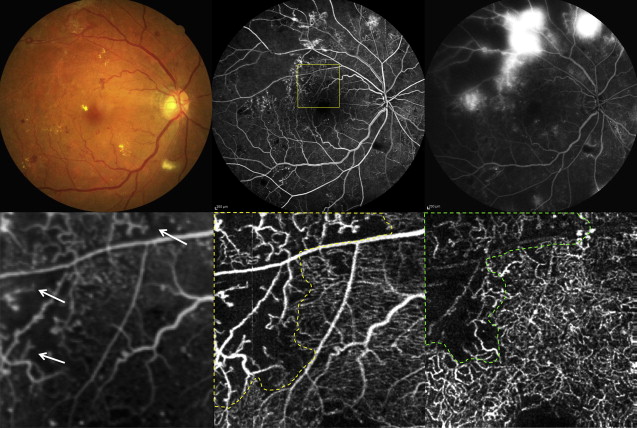
Areas of retinal nonperfusion were visualized by FA as a dark area between the relatively large retinal vessels, which represented intraretinal capillary occlusion or dropout. The edge of the retinal nonperfused area near the optic disc and the macula could be observed by OCT angiography as an area where capillaries could not be observed. Residual, irregular capillaries were also clearly observed in the edges of nonperfused areas by OCT angiography. Typical examples are shown in Figures 3 (near the optic disc) and 4 (near the macula). A 60-year-old man noticed decreased visual acuity for several years in both eyes. BCVA in his left eye was 20/25. The eye was characterized by mild cataract and severe NPDR ( Figure 3 ). FA showed extensive nonperfused areas in the nasal retina and venous beading at the superior nasal venule. On an OCT angiogram of the superficial vascular layer near the optic disc, retinal nonperfused areas were clearly visualized as a capillary-nonvisible area ( Figure 3 ). Intraretinal irregular capillaries, faintly visualized by FA in the edge of nonperfused areas between the superior large vessels near the optic disc, were clearly observed as dilated, looped, and coarse capillaries by OCT angiography. Furthermore, OCT angiography enabled the visualization of their branching points to superficial, large retinal venules. In another case, a 50-year-old woman diagnosed with type 2 diabetes mellitus about 15 years prior to the study had dropped out early from therapy. BCVA of both eyes was 20/20, but FA examination revealed extensive retinal nonperfusion and substantial neovascularization; therefore, the patient was diagnosed with PDR ( Figure 4 ). Focusing on the area near the macula, an edge of the large nonperfused area of the temporal retina was observed. On OCT angiograms of the same region as that in the FA image, the nonperfused areas in the superficial and deep plexuses were traced as dotted lines, and several intraretinal abnormal capillaries (residual coarse capillaries) were also observed at the edge of nonperfused areas ( Figure 4 ). The traced nonperfused areas in the superficial and deep plexuses on OCT angiograms were measured to be 3.66 mm 2 and 3.07 mm 2 , respectively. We also quantitatively analyzed the nonperfused areas around the macula in 7 eyes on OCT angiograms. The retinal nonperfused areas in the superficial plexus (3.67 ± 0.69 mm 2 ) were significantly larger than those in the deep plexus (3.02 ± 0.59 mm 2 , P = .018).
Visualization of Vascular Structures of Neovascularization and Quantitative Evaluation
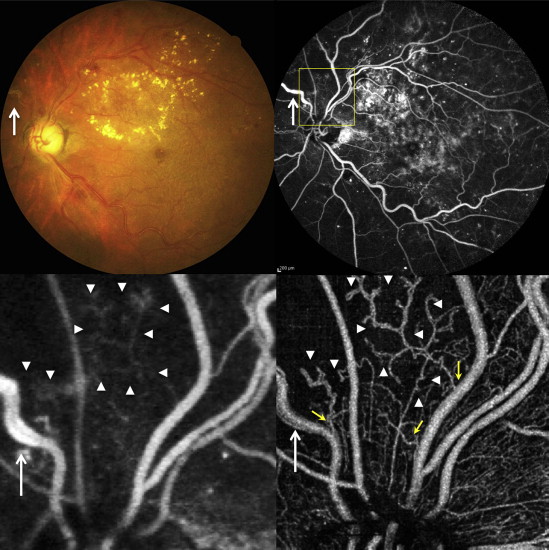
In the 4 eyes with PDR, vascular structures of the NVD could be visualized clearly on OCT angiograms. In 1 case, the changes of NVD after anti–vascular endothelial growth factor (VEGF) therapy were quantitatively observed ( Figures 5 and 6 ). A 32-year-old man was diagnosed with PDR in both eyes 6 months prior to study and immediately received panretinal photocoagulation. The condition of PDR, however, progressively worsened and the patient developed neovascular glaucoma and severe macular edema. Fundus photography and FA demonstrated a marked, fibrovascular membrane including NVD, but the vascular structures of NVD could not be visualized because of excessive leakage from NV even in the early phase of FA ( Figure 5 ). However, the OCT angiogram of the optic disc clearly showed massive neovascular structures in the fibrovascular membrane above the optic disc ( Figure 5 ). Two weeks after intravitreal injection of an anti-VEGF agent (ranibizumab), NVD was remarkably reduced and iris rubeosis and macular edema disappeared. The NVD area had further decreased 4 weeks after the injection, although spiral, looped, and irregular microvasculature in the optic disc remained. However, 8 weeks after the injection, the diameter of the abnormal vessels comprising NVD was enlarged and the amount of irregular vasculature had increased; thus, NVD had regrown and was revitalized ( Figure 5 ). The changes in the NVD flow area were quantitatively evaluated ( Figure 6 ). The NVD flow area had decreased as time had passed, but was still increased 8 weeks after the injection of ranibizumab.