Purpose
To identify visually significant spectral-domain optical coherence tomography (SD-OCT) features of epiretinal membranes (ERM) in patients with uveitis.
Design
Retrospective cohort and cross-sectional study.
Methods
Eighty consecutive eyes with uveitis and SD-OCT–documented ERM were included. Clinical data were collected at the time of diagnosis of ERM and at the final visit. SD-OCT images at the last visit were evaluated to identify fovea and ERM configuration and structural changes. Changes of 10% and 20% in central subfield thickness between initial and last SD-OCT were calculated and correlated with visual acuity (VA). An ERM thickness map was created using validated SD-OCT grading software.
Results
VA improved significantly in eyes with more than 12 months of follow-up ( P = .03). Although inflammation activity and medical treatment methods were no different in eyes with more or less than 12 months of follow-up, 16 eyes in the subset with longer follow-up underwent cataract extraction and intraocular lens implantation. Kaplan-Meier analysis demonstrated few vision losses during the follow-up period. Change in central subfield thickness did not correlate with VA. Foveal center involvement ( P < .001), focal attachment of the ERM ( P = .003), and foveal inner segment and outer segment junction disruption ( P = .006) were associated independently with lower VA. ERM was thinner in eyes with 20/40 or better VA (4.6 ± 0.6 μm) compared with eyes with VA of less than 20/200 ( P = .02). Longer duration of ERM was associated with thicker ERM ( P < .05).
Conclusions
In most eyes with uveitis and ERM, VA remains stable if ocular inflammation and comorbidities are addressed appropriately.
Epiretinal membranes (ERM) develop frequently in patients with uveitis and contribute to visual morbidity, including visual impairment, metamorphopsia, micropsia, and occasional monocular diplopia. Although ERMs may be detected by funduscopy, detection sensitivity has been increased by the use of optical coherence tomography (OCT). Among various OCT technologies, spectral-domain (SD) OCT allows better visualization and improved understanding of the pathologic features of ERM and the underlying retinal changes. Furthermore, the axial resolution of SD-OCT (generally in the 5- to 7-μm range for the most common SD-OCT instruments) is especially promising for performing a detailed evaluation of the outer retina and for facilitating correlation with visual prognosis. Although morphologic SD-OCT parameters have been correlated with visual prognosis in patients involved with idiopathic ERM, such observations have not extended to uveitic ERMs. Defining such clinically relevant, visually significant characteristics of the uveitic ERMs would help in tailoring proper follow-up and management of this complication.
Retinal thickness maps provided by built-in OCT programs have become significant diagnostic and outcome parameters in management of macular pathologic features, but such an approach does not necessarily provide specific and relevant outcome parameters in patients with ERM. Furthermore, error frequency of automated detection and segmentation of the retinal boundaries in the presence of ERM is high with built-in SD-OCT programs. This limits the reproducibility of thickness maps and the quantitative measures of the morphologic features of ERM, which may be of value in assessing patients’ visual performance and prognosis. However, Sadda and associates and Joeres and associates reported a novel OCT reading and grading approach entitled 3D-OCTOR that allows trained users to address automated segmentation errors by manual correction and segmentation of predetermined retinal, epiretinal, and subretinal layer boundaries, followed by automated calculation of relevant thickness and volume statistics. In the present study, potentially visually significant features of uveitic ERM and the underlying neurosensory retina were assessed qualitatively and quantitatively and were correlated with visual acuity.
Methods
OCT images of 80 eyes of 54 consecutive uveitic patients with an SD-OCT–supported diagnosis of ERM in a referral uveitis clinic at the Doheny Eye Institute seen between August 2009 and November 2010 were collected and analyzed. The Institutional Review Board of the University of Southern California approved the data collection and analysis protocol. The study was in accordance with Health Insurance Portability and Accountability Act requirements. All cases were documented by either 1 or both of 2 SD-OCT devices, the Cirrus HD-OCT (Carl Zeiss Meditec, Dublin, California, USA) or Spectralis HRA+OCT (Heidelberg Engineering, Heidelberg, Germany).
Clinical data types were collected from the baseline visit at the time of clinical diagnosis of ERM and from the last visit. The collected information included age, sex, anatomic and clinical diagnosis, duration of the uveitis, and clinical examination findings. Standardization for Uveitis Nomenclature (SUN) Working Group guidelines were used for uveitis anatomic classification and inflammation grading and activity. Patients with sclerouveitis were included if they met the inclusion criteria. Patients with poor-quality SD-OCT images that prevented evaluation and quantification of the SD-OCT data were excluded. Management of uveitis was based on therapeutic approaches encompassing specific treatment for the underlying systemic condition combined with topical and systemic corticosteroids. Immunomodulatory agents were added if intraocular inflammation was not controlled by corticosteroids and as corticosteroids-sparing agents. Treatment approaches were aimed at zero intraocular inflammation activity.
Qualitative Analysis of the Spectral-Domain Optical Coherence Tomography Images
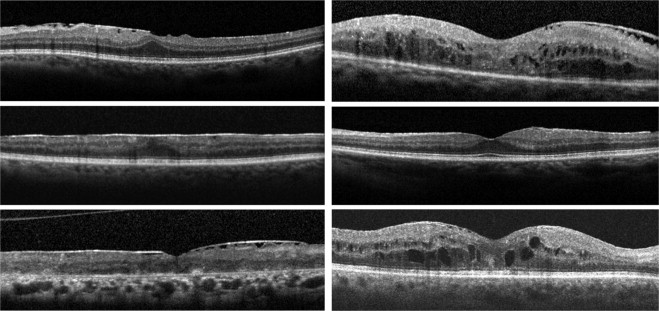
Gray-scale SD-OCT images of all study eyes at their last visit were viewed on a 22-inch liquid crystal display monitor (1920 × 1080 pixels) for the evaluation of the ERM features. All macular B-scans were evaluated for the pattern (focal or broad) of attachment of ERM to the internal limiting membrane (ILM) of the retina. Patterns of attachment were defined as focal ( Figure 1 , Top left) and broad ( Figure 1 , Middle left). If both attachment morphologic features were present to a similar extent in different parts of the macula, the pattern of attachment was recorded as both ( Figure 1 , Bottom left). The central horizontal B-scan passing through the foveal center and 8 superior and 8 inferior B-scans were evaluated for the presence or absence of specific structural features, including the following: (1) presence ( Figure 1 , Top left and Middle left) or absence ( Figure 1 , Top right) of involvement of the foveal center by the ERM; (2) normal foveal concavity ( Figure 1 , Middle right) versus lost foveal concavity ( Figure 1 , Top left and Middle left); (3) presence or absence of cystoid macular edema (CME) at the fovea ( Figure 1 , Middle right and Bottom right); (4) integrity of the inner segment/outer segment (IS/OS) junction ( Figure 1 , Top left) and minor disruption (less than 200 μm in length; Figure 1 , Bottom right) and significant disruption (more than 200 μm in length; Figure 1 , Bottom left) of IS/OS junction line; and (5) integrity of the external limiting membrane (ELM) of the retina ( Figure 1 , Top left) and minor disruption (less than 200 μm in length; Figure 1 , Bottom right) and significant disruption (more than 200 μm in length; Figure 1 , Bottom left) of the ELM. The size of the disruption of IS/OS junction and the ELM were measured with the automated calipers of the SD-OCT machines’ built-in program.
Central Subfield Thickness
OCT machines interpret scan data to calculate central subfield thickness (CST), defined as the average retinal thickness in the area enclosed in a 1000 µm diameter circle centered at the center of fovea. The CST at first and last SD-OCT examination was recorded for all eyes that were scanned with the same SD-OCT machine in both time points and for which the interval between initial and last SD-OCT was more than 3 months. A 10% and 20% change in CST was calculated for correlation with visual acuity.
Generation of Epiretinal Membrane Thickness map
ERM thickness maps were developed in 34 randomly selected eyes at their last examination with SD-OCT. The entire cohort of eyes was not used for ERM thickness map generation because of the exhaustive nature of the manual segmentation process. The Doheny Image Reading Center has developed OCTOR, a software tool that facilitates viewing and manual grading of OCT scans. OCTOR has been described and validated in previous reports. A new version of OCTOR, called 3D-OCTOR, is updated for handling large SD-OCT data sets. Each macular cube protocol of Cirrus HD-OCT consists of 128 B-scans spaced 47 μm apart within a 6 × 6-mm area centered on the fovea. The Spectralis HRA+OCT imaging protocol used in the Doheny Ophthalmic Imaging Unit consists of 37 horizontal B-scans also within a 6 × 6-mm scanning area. Based on specifications provided by previous studies evaluating the effect of interpolation and required numbers of scans for accurate thickness map generation, 3D-OCTOR was used to draw the inner and outer boundaries of the ERM on every fourth B-scan of Cirrus HD-OCT volume cube and all 37 B-scans of Spectralis HRA+OCT cube to compute thickness values at all segmented locations. The measurements at all unsampled locations, between the raster scans, were interpolated based on a linear approximation (using nearest neighbor sampling between A-scans, followed by bilinear sampling between B-scans) to yield a thickness map as previously described. For manual segmentation, the ERM was defined as the first hyperreflective line internal to the ILM. Segmentation was performed by 2 independent graders (H.N., F.M.H.), and discrepancies were resolved by open adjudication to yield a single final segmentation for each case. In eyes with apparent tight adherence of the ERM to the inner retinal surface without areas of clear separation of the ERM, the ILM was included as the outer ERM surface. Macular Early Treatment Diabetic Retinopathy Study (ETDRS) grid subfields were used to facilitate analysis and comparison of the thickness and surface areas of ERM between cases. The central circle with a diameter of 1000 μm centered on foveal center was defined as the foveal area. The middle circle with a diameter of 3000 μm was defined as foveal plus parafoveal area, and the areas encompassed in the larger circle with a diameter of 6000 μm was defined as the entire macular area.
Statistical Analysis
Visual acuity measurements with Snellen charts were converted to logarithm of minimal angle of resolution units for correlating with other parameters, including ERM duration, uveitis duration, uveitis activity, ERM attachment type to the inner retina, involvement of the fovea by the ERM, presence of CME, outer retinal disturbances in the fovea as revealed and graded with SD-OCT, and central macular thickness. A life table analysis was performed to calculate the cumulative proportion of the eyes with visual acuity dropping to 20/50 and worse and 20/200 and worse. The incidence of vision loss to 20/50 and worse and 20/200 and worse also was calculated. Additionally, patients were stratified further based on visual acuity cutoffs of 20/40 and 20/200, and Wilcoxon signed-rank tests were run to compare baseline and final visual acuity in groups. To correlate clinical features and SD-OCT findings with simultaneous visit visual acuity, generalized estimating equations were performed that adjusted for the correlation between eyes within the subjects. For analysis that included only 1 eye per subject, t-tests were used. ERM thickness, SD-OCT features, and vision were correlated using Spearman and Pearson correlation coefficients. SAS software version 9.1 (SAS Institute, Cary, North Carolina, USA) was used for all analysis. The accepted level of significance was P < .05.
Results
Eighty eyes of 54 consecutive patients with uveitis with an SD-OCT–supported diagnosis of ERM were included. Average patient age ± standard deviation at the time of data collection was 60.5 ± 13.7 years (range, 20 to 87 years); 35 patients (64.8%) were male. In 26 patients, both eyes had documented ERM and were included in the study. Anatomic classification of the uveitis in involved eyes revealed posterior uveitis (35 eyes; 43.7%), anterior uveitis (15 eyes; 18.7%), intermediate uveitis (15 eyes; 18.7%), panuveitis (10 eyes; 12.5%), and sclerouveitis (5 eyes; 6.2%). The most prevalent final diagnosis was idiopathic uveitis (31 eyes; 31.2%), followed by birdshot choroiditis (11 eyes; 13.7%), pars planitis (8 eyes; 10%), sarcoidosis-associated posterior uveitis (8 eyes; 10%), HLA-B27–associated uveitis (7 eyes; 8.7%), and multifocal choroiditis and panuveitis (6 eyes; 7.5%). Less frequent clinical diagnoses included tuberculous uveitis, Vogt-Koyanagi-Harada syndrome, uveitis associated with rheumatologic disorders, Behçet disease, presumed ocular histoplasmosis syndrome, and endophthalmitis occurring after cataract extraction. Median follow-up time after diagnosis of ERM was 24 months (mean ± standard deviation, 32 ± 38.7 months; range, 0 to 228 months). The median logarithm of minimal angle of resolution visual acuity improved slightly from 0.24 (mean ± standard deviation, 0.33 ± 0.32; range, 0 to 1.3) at the time of ERM diagnosis to 0.18 (mean ± standard deviation, 0.27 ± 0.29; range, 0 to 1.3) at the last follow-up ( P = .04). When patients were stratified based on duration of follow-up ( Table 1 ), visual acuity improvement in patients with more than 12 months of follow-up was significant ( P = .03, Wilcoxon signed-rank test). In contrast, visual acuity did not change significantly in patients with follow-up of 12 months or less. To evaluate the contribution of active intraocular inflammation to visual acuity change over time, the eyes with active inflammation at the baseline or final visits, or both, were excluded, and visual acuity change in the group with more than 12 months of follow-up was still significant ( P = .04). Twenty-seven eyes had visual acuity of 20/50 or worse at baseline, and 4 more eyes lost vision to this level during follow-up. Figure 2 , Top, reveals a cumulative hazard analysis (Kaplan–Meier curve) for eyes losing vision to 20/50 or less. The incidence of losing vision to 20/50 and worse was 0.03 eyes per each year of follow-up. Eight eyes had 20/200 vision at baseline and 1 eye lost vision to this level during follow-up ( Figure 2 , Bottom). The incidence of losing vision to 20/200 and worse was 0.005 eyes per each year of follow-up.
| BCVA of 20/40 or Better | BCVA between 20/40 and 20/200 | BCVA of 20/200 or Worse | |
|---|---|---|---|
| At time of clinical diagnosis of ERM | 53 (66.25%) | 19 (23.75%) | 8 (10%) |
| 0 to 6 mos of follow-up | 13 (65%) | 6 (30%) | 1 (5%) |
| 7 to 12 mos of follow-up | 3 (60%) | 0 | 2 (40%) |
| >12 mos of follow-up | 37 (67.3%) | 13 (23.6%) | 5 (9.1%) |
| At time of last follow-up | 59 (73.75%) | 15 (18.75%) | 6 (7.5%) |
| 0 to 6 mos of follow-up | 14 (70%) | 5 (25%) | 1 (5%) |
| 7 to 12 mos of follow-up | 3 (60%) | 0 | 2 (40%) |
| >12 mos of follow-up | 42 (76.4%) | 10 (18.2%) | 3 (5.5%) |
Median duration of uveitis before clinical diagnosis of ERM was 44 moths (mean ± standard deviation, 62 ± 78 months; range, 2 to 351 months). Uveitis duration was less than 6 months in 5 eyes, 7 to 12 months in 10 eyes, and more than 12 months in 65 eyes. Longer duration of uveitis correlated with lower visual acuity ( P < .05). Intraocular inflammation was inactive at baseline and at the last visit in 64 eyes (80%). Intraocular inflammation was active in both the initial and last visits in 5 eyes (6.2%). In 6 eyes (7.5%) that had active intraocular inflammation at the time of diagnosis of ERM, inflammation was controlled at the last visit. In contrast, 5 eyes (6.2%) had inactive inflammation at the first visit, but showed active uveitis at the last visit. Inflammation activity did not correlate with initial and final visual acuity or with the change in the vision. The level of inflammation did not correlate with the presence of structural alterations in the fovea, including CME ( P = .41).
Treatment methods at the time of the last visit included topical corticosteroids in 36 eyes (45%), systemic corticosteroids in 25 patients (46%), systemic immunomodulatory agents in 14 patients (26%), and biologic agents in 4 patients (7%). Visual acuity at last visit did not correlate with medical treatment method used for inflammation control ( P > .05). Sixteen eyes underwent cataract extraction and intraocular lens implantation during the follow-up period. All 16 eyes were in the subset of patients with more than 12 months of follow-up. Visual acuity improved in eyes with cataract extraction from 0.36 ± 0.25 to 0.19 ± 0.20 ( P = .02); However, visual acuity in eyes without surgical intervention did not change significantly during the follow-up period ( P = .21).
Qualitative Spectral-Domain Optical Coherence Tomography Features of Epiretinal Membranes
Univariate analysis for the association between SD-OCT findings and final visual acuity, as represented in Table 2 , showed that focal ERM attachment to the retina, foveal center involvement with ERM, presence of CME, and disruption of IS/OS junction line and ELM were correlated significantly with poor visual acuity. However, multivariate analysis using backward stepwise selection considering all variables revealed: (1) foveal center involvement ( P < .001, type 3 Wald chi-square value), (2) focal attachment of the ERM to the inner retina ( P = .003, type 3 Wald chi-square value), and (3) disruption of IS/OS junction line ( P = .006, type 3 Wald chi-square value) as independent predictors of poor vision.
| No. of Eyes | logMAR VA (mean ± SE) | P Value | Spearman Correlation Coefficient | |
|---|---|---|---|---|
| Pattern of attachment of ERM to inner retina | ||||
| Focal attachment | 24 | 0.45 ± 0.10 | Focal vs broad, < .05 | −0.0270 |
| Broad attachment | 38 | 0.15 ± 0.05 | Focal vs both, < .05 | P = .02 |
| Both types of attachment | 14 | 0.17 ± 0.07 | Broad vs both, > .05 | |
| Foveal center involvement with ERM | ||||
| No | 41 | 0.14 ± 0.05 | .002 | 0.503 |
| Yes | 39 | 0.35 ± 0.07 | P < .001 | |
| IS/OS junction at fovea | ||||
| Intact | 64 | 0.18 ± 0.004 | Intact vs significant, < .05 | 0.418 |
| Minor disruptions (< 200 μm) | 8 | 0.21 ± 0.08 | Minor vs significant, < .05 | P < .001 |
| Significant disruptions (> 200 μm) | 8 | 0.91 ± 0.21 | Intact vs minor, > .05 | |
| ELM at fovea | ||||
| Intact | 66 | 0.17 ± 0.04 | Intact vs significant, < .05 | 0.495 |
| Minor disruptions (< 200 μm) | 3 | 0.55 ± 0.32 | Minor vs significant, < .05 | P < .001 |
| Significant disruptions (> 200 μm) | 11 | 0.7 ± 0.16 | Intact vs minor, > .05 | |
| Cystoid macular edema | ||||
| No | 69 | 0.18 ± 0.04 | .003 | 0.364 |
| Yes | 11 | 0.78 ± 0.2 | P = .001 | |
| Foveal contour | ||||
| Normal foveal concavity | 51 | 0.18 ± 0.04 | .002 | 0.53 |
| Decreased or lost concavity | 29 | 0.41 ± 0.08 | P < .001 |
Stay updated, free articles. Join our Telegram channel

Full access? Get Clinical Tree


