Purpose
To investigate microcirculation of peripapillary retina and optic disc in eyes with primary open-angle glaucoma (POAG) and hemifield visual field (VF) defects.
Design
Prospective observational case series with normal comparison group.
Methods
Sixty eyes with POAG (41 with superior and 19 with inferior hemifield VF defects) and 21 normal eyes were included in this study. Optical coherence tomography (OCT) angiography was used to acquire 3 × 3-mm optic disc cubes, and circumpapillary retinal nerve fiber layer thickness was also measured using OCT. Vessel densities in the peripapillary superficial retina and whole-signal-mode optic disc were individually analyzed based on the sectorial division.
Results
The peripapillary vessel densities were significantly reduced at the corresponding location of the VF defects in both non–highly myopic ( P < .001, P = .006) and highly myopic glaucomatous eyes ( P < .001, P = .005) compared with the normal eyes. Vessel densities of the optic discs were significantly reduced at locations corresponding to the VF defects in eyes without high myopia but with inferior hemifield VF defects ( P = .006), but not in the other eyes. The vessel densities in the peripapillary retina were significantly associated with visual field total deviation values at their corresponding sides. The choroidal microvascular reduction in the peripapillary area extended to the α-peripapillary atrophy (PPA) as well as β-PPA zones.
Conclusions
Microvascular reduction was associated with VF defects in a region-specific manner: significantly and partially in the peripapillary retina and optic disc, respectively.
Primary open-angle glaucoma (POAG) is characterized by progressive retinal ganglion cell death and axon loss, ultimately leading to irreversible visual field (VF) loss. Although intraocular pressure (IOP) is considered to be the most important risk factor for the development and progression of glaucoma, ocular blood flow is thought to play an important role in the pathology of POAG.
The association between ocular circulation and glaucoma has been investigated using several imaging modalities, such as fluorescein angiography, Heidelberg retina flowmeter, color Doppler imaging, laser speckle flowgraphy, and laser Doppler velocimetry. Recently, 3-dimensional (3D) noninvasive vascular mapping without a dye was achieved using optical coherence tomography (OCT) angiography, which has been projected as one of the ideal modalities to investigate changes in the microvasculature resulting from retinal diseases and glaucoma. Based on using OCT angiography, it has been reported that the vessel densities in the whole circumference of the peripapillary retina and the entire area of the optic disc are reduced in glaucomatous eyes. However, the local variation of the microvasculature in glaucoma has so far not been thoroughly investigated using OCT angiography.
Myopia is an independent risk factor for glaucoma and is therefore clinically important. However, evaluation of the optic disc is difficult in highly myopic eyes because of considerable morphologic variations. Although retinal nerve fiber layer (RNFL) thickness measurement using spectral-domain (SD) OCT is helpful for glaucoma diagnosis even in highly myopic eyes, it has been known that myopic eyes have a thinner RNFL and a unique pattern of RNFL distribution, leading to inaccurate diagnosis using OCT. Using OCT angiography, it was recently reported that there is a decrease in the peripapillary vessel density in highly myopic eyes as compared to emmetropic eyes. However, it is still not known if differences exist between the microvasculatures of glaucomatous eyes, with and without high myopia.
Blood is supplied to the optic disc from 3 major sources. The retinal arterioles supply blood to the retina, the peripapillary choroidal or short posterior ciliary arteries supply blood to the prelaminar tissue, and the centripetal branches of the short posterior ciliary arteries supply blood to the lamina cribrosa (LC). For a better understanding of the association between blood flow and glaucoma, it is therefore important to understand the microcirculation of not only the optic disc, but also the peripapillary retina and choroid.
Peripapillary atrophy (PPA) is an important effect of glaucoma. The PPA region can be photographically subdivided into the α- and β-PPA zones, and the β-PPA zone can be further subdivided into the β and γ zones, histologically or by OCT. The α-PPA zone is characterized by the irregular hypopigmentation and hyperpigmentation of the retinal pigment epithelium (RPE) located in the periphery of the PPA region. The β-PPA zone is characterized by the atrophy of the RPE and choriocapillaris, visible sclera, and large choroidal vessels. The β and γ zones differ by the presence of the Bruch membrane (BM) in the β zone. It has been reported that the β-zone PPA is associated with the presence and progression of glaucoma, while γ-zone PPA is related to myopia. Despite the necessity to understand choroidal microcirculation, especially in the PPA region, in order to interpret the association between PPA and glaucoma, microcirculation in the α- and β-PPA zones has not been well understood.
Eyes with hemifield glaucomatous damage are good targets for investigating the association between the local changes of blood flow and glaucomatous optic neuropathy. In the present study, we have investigated the characteristics of the microvascular structure at the peripapillary area and optic disc in glaucomatous eyes with hemifield VF defects using OCT angiography.
Methods
Patients
This observational study was conducted as a part of the Kyoto University Glaucoma Progression Study (KU-GPS), which is an ongoing prospective study at the Glaucoma Clinic of the Kyoto University Hospital. Healthy subjects were included as the control group. The study adhered to the tenets of the Declaration of Helsinki and was approved by the Institutional Review Board and Ethics Committee of the Kyoto University Graduate School of Medicine. Written informed consent was obtained from all the patients. This study included patients with POAG and hemifield VF defects who visited the Kyoto University Hospital between March 1, 2015, and September 30, 2015. The inclusion criteria for the eyes with POAG were as follows: best-corrected visual acuity ≥20/40, older than 20 years of age, no history of intraocular surgery apart from uncomplicated cataract surgery, no vitreoretinal disease or nonglaucomatous optic neuropathy, and presence of glaucomatous hemifield VF defects, which is defined in the next section. The inclusion criteria for normal eyes were as follows: no evidence of retinal pathology or glaucoma, IOP <21 mm Hg, no chronic ocular or systemic corticosteroid use, an open anterior chamber angle in gonioscopy, and normal appearances of the optic disc and RNFL on photography and OCT examination. In cases where both eyes of a glaucoma patient or a normal subject met the inclusion criteria, only 1 eye was randomly selected for the study.
Visual Field Assessment
The criteria of Anderson and Patella were applied on standard automated perimetry (SAP) tests for defining glaucomatous VF results. The criteria for an abnormal VF included glaucoma hemifield test results outside the normal limits, pattern standard deviation (PSD) with significance at a P < 5% level, and the presence of a cluster of 3 or more adjacent non-edge points in typical glaucomatous locations that did not cross the horizontal meridian, all of which were depressed on the pattern deviation plot at a P < 5% level, and 1 of which was depressed at P < 1% level on at least 2 consecutive plots. The VF results were considered reliable at values of fixation loss ≤15%, false-positive rate ≤15%, and false-negative rate ≤15%. Glaucomatous hemifield VF defects in the superior or inferior hemifields were defined as VF defects according to the Anderson-Patella criteria following at least 2 consecutive VF tests immediately before OCT angiography examination.
Clinical Examinations
All glaucoma patients underwent a comprehensive ophthalmic examination, including the measurement of IOP using a Goldmann applanation tonometer; uncorrected and best-corrected visual acuity using a Landolt chart at 5 m; slit-lamp examination; gonioscopy; SAP using the Humphrey Visual Field Analyzer (HFA) following the 24-2 Swedish interactive threshold algorithm testing protocol (24-2 SITA; Carl Zeiss Meditec, Dublin, California, USA); central corneal thickness (CCT) measurements using an ultrasonic pachymeter (SP-3000; Tomay, Tokyo, Japan); axial length measurements using partial laser interferometry (IOLMaster; Carl Zeiss Meditec); circumpapillary RNFL (cpRNFL) measurements using the Spectralis HRA+OCT scanner (Heidelberg Engineering, Heidelberg, Germany); and OCT angiography using the RTVue-XR Avanti scanner (Optovue Inc, Fremont, California, USA).
Optical Coherence Tomography Angiography Data Acquisition and Processing
The OCT angiography images were acquired using an 840-nm superluminescent diode at an A-scan rate of 70 000 scans per second. Each of the acquired optic disc cubes (3 × 3 mm) consisted of 304 clusters of 2 repeat B-scans containing 304 A-scans each. A split-spectrum amplitude-decorrelation angiography algorithm was employed to improve the signal-to-noise ratio by splitting the spectrum to generate multiple repeat OCT frames from the 2 original repeat OCT frames. Automatic segmentation of the inner retinal borders was performed using the viewing software. Two types of segmentation algorithms were used in the current study. The surface mode included signals from the inner limiting membrane (ILM) to 100 μm below the membrane and the whole-signal mode included all of the signals below the ILM. En face angiogram images of the retinal circulation were obtained from the maximum flow projections from each of the segmented areas.
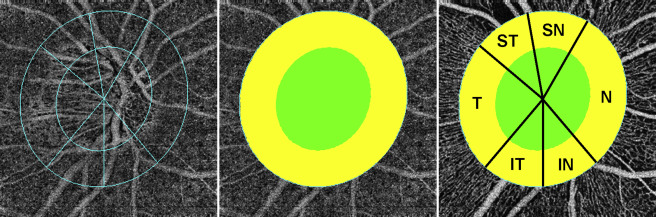
To quantify the vessel densities in the peripapillary retina and optic disc, the optic disc boundary was determined based on the scanning laser ophthalmoscopy (SLO) images. The peripapillary region was defined as a 500-μm-wide elliptical annulus extending from the optic disc boundary, using the intrinsic software provided by OptoVue. Sectorial division was performed using the Garway-Heath regionalization, and the total and individual areas were used to measure the vessel densities of the peripapillary retina and optic disc. Vessel density was defined by the percentage area occupied by vessels, measured using the intensity-based thresholding feature of the software, which adopted the same method of calculation as that previously reported ( Figure 1 ).
Determination of the Boundaries of the Optic Disc and Peripapillary Atrophy
The SLO images were acquired at the same positions as the OCT angiography images using the RTVue-XR Avanti scanner. To investigate whether there is a dropout of microvasculature in PPA areas relative to zones without PPA, the optic disc boundary was defined by the ring of Elschnig, and the β-PPA margin was defined as the border between low and high reflectivity on the stereo-color SLO images. The α-PPA was defined as an irregular area of hypopigmentation and hyperpigmentation located on the outer side of the β-PPA, if present. The BM opening was defined as the termination of highly reflective continuous lines on OCT B-scan images, and the γ zone was defined from BM opening to the disc margin.
Statistical Analysis
All statistical evaluations were performed using SPSS Version 20 software (IBM Corp, Armonk, New York, USA). The differences in age, axial length, CCT, IOP, VF total deviation (TD), cpRNFL thickness (cpRNFLT), and vessel density among the 4 or 5 groups were evaluated using the Kruskal-Wallis test. Mann-Whitney U test or Fisher exact probability tests were used to compare the age, sex, axial length, CCT, VF MD, IOP, glaucoma medications, cpRNFLT, and vessel density between groups. The correlation between vessel density and cpRNFLT was evaluated using the Spearman rank correlation test. P values less than .05 were considered statistically significant. In the post hoc analysis, the significance of differences between the groups was determined after Bonferroni correction. The data are presented as the mean ± standard deviation.
Results
Subjects
Initially, 66 eyes with POAG and 21 normal eyes met the inclusion criteria of this study. Among the eyes with POAG, 6 were excluded because of the unacceptable quality of their OCT angiography images. As a result, a total of 60 eyes of patients with POAG and 21 normal eyes of healthy subjects were finally included in this study. There were significant differences between the normal eyes and total POAG eyes in terms of the age, axial length, and glaucoma medication score ( Table 1 ). Of the 60 eyes with POAG, 41 eyes had superior and 19 eyes had inferior hemifield VF defects. Twenty-six eyes with POAG had high myopia (axial length ≥26.0 mm). Ophthalmic characteristics including cpRNFLT and vessel densities of the non–highly myopic or highly myopic eyes with superior or inferior hemifield VF defects are separately presented in Table 2 .
| Variable | Healthy (N = 21) | Glaucoma-Affected (N = 60) | P Value |
|---|---|---|---|
| Age (y) | 64.3 ± 13.5 (28–81) | 56.3 ± 12.7 (27–86) | .006 |
| Sex, n (male/female) | 9/12 | 30/30 | .620 |
| Axial length (mm) | 23.72 ± 0.96 (22.60–25.85) | 25.50 ± 1.68 (21.87–28.66) | <.001 |
| CCT (μm) | n/a | 526.2 ± 32.4 (431–620) | n/a |
| Visual field mean deviation (dB) | n/a | −7.02 ± 3.88 (−1.7 to −15.05) | n/a |
| IOP (mm Hg) | 14.6 ± 2.9 (9–20) | 14.1 ± 2.9 (10–21) | .47 |
| Glaucoma medication score | 0 | 1.8 ± 1.5 (0–5) | <.001 |
| Variable | Normal (A) (N = 21) | POAG Without High Myopia | POAG With High Myopia | P Value | ||||||||
|---|---|---|---|---|---|---|---|---|---|---|---|---|
| Superior Hemifield VF Defects (B) (N = 23) | Inferior Hemifield VF Defects (C) (N = 11) | Superior Hemifield VF Defects (D) (N = 18) | Inferior Hemifield VF Defects (E) (N = 8) | Kruskal-Wallis a | Post Hoc b | |||||||
| A vs B | A vs C | A vs D | A vs E | B vs D | C vs E | |||||||
| Age (y) | 64.3 ± 13.5 | 63.6 ± 11.1 | 60.6 ± 10.9 | 46.5 ± 8.5 | 51.6 ± 12.4 | <.001* | .45 | .23 | <.001* | .010 | <.001* | .15 |
| Sex (male/female) | 9/12 | 9/14 | 6/5 | 13/5 | 2/6 | n/a | n/a | n/a | n/a | n/a | n/a | n/a |
| Axial length (mm) | 23.72 ± 0.96 | 24.11 ± 1.26 | 24.74 ± 0.77 | 27.01 ± 0.6 | 27.16 ± 0.99 | <.001* | .29 | .005* | <.001* | <.001* | <.001* | <.001* |
| CCT (μm) | n/a | 512.9 ± 23.9 | 532.7 ± 33.1 | 531.3 ± 40 | 543.6 ± 22.9 | .024* | n/a | n/a | n/a | n/a | .062 | .51 |
| IOP | 14.6 ± 2.9 | 13.8 ± 3.0 | 14.5 ± 3.7 | 14.2 ± 2.5 | 14.3 ± 2.3 | .89 | .30 | .95 | .61 | .88 | .56 | 1.000 |
| VF TD (dB) | ||||||||||||
| Superior | n/a | −12.65 ± 8.44 | −0.16 ± 1.41 | −12.65 ± 8.44 | −0.85 ± 2.13 | <.001* | n/a | n/a | n/a | n/a | .92 | .36 |
| Inferior | n/a | −1.88 ± 2.99 | −8.32 ± 5.75 | −1.33 ± 1.01 | −11.13 ± 5.53 | <.001* | n/a | n/a | n/a | n/a | .66 | .19 |
| cpRNFLT (μm) | ||||||||||||
| Whole | 96.7 ± 7.9 | 69.4 ± 10.6 | 79.2 ± 11.5 | 64.7 ± 10.6 | 68.0 ± 10.6 | <.001* | <.001* | <.001* | <.001* | <.001* | .16 | .051 |
| Nasal | 63.4 ± 11.3 | 54.2 ± 13.5 | 55.3 ± 10.6 | 38.5 ± 21.7 | 34.8 ± 21.5 | <.001* | .018 | .062 | <.001* | .002* | .006* | .032 |
| IN | 104 ± 18.8 | 68.5 ± 20.9 | 94.5 ± 19.1 | 63.2 ± 15.5 | 74.0 ± 15.4 | <.001* | <.001* | .18 | <.001* | .001* | .44 | .038 |
| IT | 147.9 ± 20.3 | 53.6 ± 20.9 | 128.9 ± 19.8 | 52.3 ± 13.2 | 123.6 ± 18.8 | <.001* | <.001* | .008* | <.001* | .010 | .69 | .65 |
| ST | 132.7 ± 19.5 | 108.9 ± 23.2 | 70.4 ± 15.2 | 107.6 ± 22.3 | 56.3 ± 18.3 | <.001* | .001* | <.001* | .001* | <.001* | .52 | .11 |
| SN | 104.7 ± 19.3 | 83.3 ± 19.6 | 93.5 ± 28.8 | 76.2 ± 27.8 | 62.5 ± 15.6 | <.001* | .001* | .21 | .001* | <.001* | .44 | .007* |
| Temporal | 78.0 ± 15.7 | 66.3 ± 17.8 | 67.4 ± 15.6 | 70.8 ± 19.5 | 78.6 ± 23.3 | .23 | .031 | .25 | .27 | .71 | .39 | .34 |
| Peripapillary vessel density on surface mode (% area) | ||||||||||||
| Whole | 55.21 ± 3.35 | 51.97 ± 3.68 | 54.55 ± 4.31 | 50.83 ± 5.72 | 52.64 ± 3.33 | .006* | .009 | .97 | .003* | .088 | .74 | .14 |
| Nasal | 53.19 ± 3.78 | 51.54 ± 5.11 | 53.65 ± 3.34 | 49.61 ± 9.37 | 50.18 ± 7.18 | .38 | .17 | .98 | .16 | .31 | .81 | .41 |
| IN | 54.11 ± 6.40 | 48.49 ± 6.79 | 55.87 ± 6.53 | 47.62 ± 6.21 | 52.26 ± 6.00 | .003* | .009 | .62 | .004* | .464 | .88 | .23 |
| IT | 58.75 ± 4.62 | 44.54 ± 7.41 | 56.44 ± 6.15 | 44.74 ± 9.94 | 55.75 ± 7.60 | <.001* | <.001* | .41 | <.001* | .44 | .45 | .97 |
| ST | 56.72 ± 5.72 | 55.91 ± 4.15 | 49.26 ± 7.62 | 55.89 ± 4.82 | 50.58 ± 4.02 | .005* | .39 | .006* | .59 | .005* | .85 | .93 |
| SN | 54.84 ± 5.06 | 55.32 ± 5.54 | 53.53 ± 9.09 | 54.31 ± 5.01 | 50.96 ± 4.79 | .27 | .69 | .98 | .69 | .088 | .42 | .048 |
| Temporal | 56.09 ± 5.08 | 54.09 ± 5.87 | 57.12 ± 6.11 | 52.47 ± 7.68 | 56.07 ± 3.67 | .24 | .26 | .39 | .14 | .88 | .81 | .51 |
| Optic disc vessel density on whole-depth mode (% area) | ||||||||||||
| Whole | 60.58 ± 4.93 | 56.81 ± 4.81 | 60.25 ± 4.66 | 62.68 ± 3.77 | 61.30 ± 3.98 | .002* | .006* | .54 | .16 | .92 | <.001* | .62 |
| Nasal | 61.39 ± 5.32 | 58.04 ± 5.50 | 61.97 ± 4.12 | 63.42 ± 5.21 | 60.24 ± 5.70 | .017* | .017 | .98 | .13 | .63 | .003* | .62 |
| IN | 63.92 ± 5.54 | 57.10 ± 7.93 | 65.08 ± 9.77 | 64.90 ± 7.12 | 65.02 ± 7.99 | .004* | .005* | .23 | .45 | .22 | .003* | 1.000 |
| IT | 60.56 ± 6.17 | 51.48 ± 12.00 | 59.94 ± 7.02 | 61.13 ± 9.85 | 61.67 ± 6.75 | .022* | .015 | .86 | .35 | .53 | .006* | .68 |
| ST | 60.48 ± 6.91 | 56.20 ± 7.03 | 52.31 ± 9.57 | 61.54 ± 7.42 | 59.78 ± 3.76 | .008* | .011 | .006* | .98 | .24 | .033 | .048 |
| SN | 61.76 ± 7.19 | 62.50 ± 7.35 | 66.49 ± 3.85 | 65.80 ± 4.88 | 65.01 ± 6.96 | .38 | .66 | .088 | .20 | .23 | .33 | .87 |
| Temporal | 57.10 ± 8.43 | 55.21 ± 6.44 | 56.92 ± 8.62 | 60.31 ± 7.36 | 59.41 ± 4.69 | .26 | .25 | .91 | .31 | .59 | .036 | .56 |
a Significant differences ( P < .05) are indicated with an asterisk.
b Significant differences after Bonferroni corrections are indicated with an asterisk.
Microvasculature at the Peripapillary Retina and Circumpapillary Retinal Nerve Fiber Layer Thickness
The microvascular network at the peripapillary superficial retina was assessed using surface-mode OCT angiography. In the normal eyes, dense microvascular networks were observed around most discs and no focal capillary dropout existed ( Figure 2 ). In contrast, in the glaucomatous eyes, focal microvascular reduction was apparent at the corresponding side of the VF defects in most of the eyes with POAG ( Figures 3 and 4 ).
Stay updated, free articles. Join our Telegram channel

Full access? Get Clinical Tree


