Purpose
To use swept-source optical coherence tomography (OCT) to image the posterior sclera at the posterior pole and around the optic nerve head (ONH) and measure the subfoveal scleral thickness and laminar thickness to evaluate the relationship between the measured thicknesses and ocular parameters.
Design
Prospective, cross-sectional design.
Methods
The study included 103 patients with glaucoma and 43 controls with axial lengths more than 26 mm. Swept-source OCT images were obtained to capture the subfoveal and ONH regions. Subfoveal scleral thickness and laminar thickness were measured from obtained B-scan images. To verify the reproducibility of the measurement, intraclass correlation coefficients were calculated from selected B-scans. Scleral and laminar thicknesses in patients with normal-tension glaucoma (NTG) was compared with that in patients with primary open-angle glaucoma (POAG). A Pearson correlation was calculated to assess the relationships of scleral and laminar thicknesses with ocular parameters.
Results
Posterior scleral thickness could be measured in 68.4% of patients, and laminar thickness could be measured in 88.6% by using swept-source OCT. Interobserver and intraobserver measurement reproducibility was moderate to excellent. The subfoveal scleral thickness was 670.84 ± 160.60 μm in the POAG group and 496.55 ± 115.20 μm in the NTG group; a significant difference between the groups was observed. Subfoveal scleral thickness (r = −0.677, P < 0.001) was negatively correlated with axial length only in patients with NTG, not in patients with POAG.
Conclusions
Swept-source OCT detected differences in the thicknesses of the posterior sclera between eyes with NTG and eyes with POAG. Subfoveal scleral thickness was negatively correlated with axial length only in eyes with NTG.
Structural changes in the optic nerve head (ONH) are considered to be important in the pathogenesis of glaucoma. There is growing evidence that the lamina cribrosa of the ONH is the principal site of retinal ganglion cell (RGC) axonal damage in glaucoma. Recently, a number of studies have shown that the lamina cribrosa does not respond to intraocular pressure (IOP) in isolation, but the ONH and peripapillary sclera behave as a complete system. Thus, the sclera is also important in the pathogenesis of glaucoma. The stiffness and thickness of the peripapillary sclera determine the strain and biomechanical response to the elevated IOP of the lamina cribrosa.
The outer coat of the eye, consisting of the cornea, sclera and lamina cribrosa, originates in neural crest–derived mesenchymal cells. The sclera forms the principal part of the outer coat of the eye and is critical in determining the size and shape of the eye. Recent reports have shown that scleral changes may result in optic disc changes, such as disc tilting, disc torsion and peripapillary atrophy. Abrupt changes in the curvature of the sclera may result in the stretching and distortion of the optic nerve fibers, leading to damage of the axons of the RGC. We can consider that the changes in the sclera may influence the structure of the ONH, leading to RGC damage. However, to date no studies have visualized the sclera of patients with glaucoma in vivo.
With advances in optical coherence tomography (OCT) imaging, swept-source OCT at a longer wavelength allows deeper tissue penetration into the choroid and even the sclera. Several studies imaged the sclera by using swept-source OCT in eyes with high myopia. Previously, we imaged the sclera at the posterior pole using swept-source OCT and measured the subfoveal scleral thickness in myopic patients with glaucoma. The detection rate of the posterior border of the sclera and measurement reproducibility of subfoveal scleral thickness using swept-source OCT was found to be favorable.
In this study, we measured the subfoveal scleral thickness and the laminar thickness based on the images obtained by swept-source OCT in myopic patients with glaucoma. The scleral and laminar thicknesses were compared between patients with normal-tension glaucoma (NTG) and those with primary open-angle glaucoma (POAG), and the relationships between the scleral and laminar thicknesses and ocular parameters were evaluated.
Methods
This cross-sectional study investigated 103 South Korean adults with glaucoma and 43 controls with myopia (axial length more than 24 mm). Participants were recruited from Seoul St. Mary’s Hospital between December 2012 and January 2013. After detailed ophthalmic assessment, the right eye was randomly chosen for inclusion in cases in which both eyes of the patient were eligible for the study.
The study was performed with the informed consent of the participants and followed all of the guidelines for experimental investigation in human subjects required by the Institutional Review Board of Seoul St. Mary’s Hospital. All investigations were performed in accordance with the Declaration of Helsinki.
Each participant underwent a comprehensive ophthalmic assessment, including measurement of best-corrected visual acuity, slit-lamp biomicroscopy, Goldmann applanation tonometry, dilated stereoscopic examination of the ONH and fundus, color disc photography, red-free retinal nerve fiber layer (RNFL) photography (VX-10; Kowa Optimed, Tokyo, Japan), achromatic automated perimetry using the 24-2 Swedish Interactive Threshold Algorithm standard program (Humphrey Visual Field Analyzer; Carl Zeiss-Meditec, Dublin, CA, USA), and Cirrus HD-OCT (Carl Zeiss-Meditec). Central corneal thickness and axial length were measured using ultrasound pachymetry (Tomey, Nagoya, Japan) and ocular biometry (IOL Master; Carl Zeiss-Meditec). Experienced ophthalmologists performed swept-source OCT (DRI OCT; Topcon, Tokyo, Japan).
To be included, eyes had to have a best-corrected visual acuity of ≥20/40. Patients with at least 2 years of follow-up with 3 consecutive visual field tests were chosen. Eyes with axial lengths longer than 30 mm were excluded. Eyes with intraocular surgery other than cataract surgery were excluded. Those with intraocular diseases or neurologic diseases that could cause visual field loss were excluded. Eyes with consistently unreliable visual fields (defined as false-negative >25%; false-positive >25%; and fixation losses >20%) were also excluded.
Visual field (VF) loss was expressed as the mean deviation (MD) from normal. A glaucomatous visual field change was defined as the consistent presence of a cluster of 3 or more non-edge points on the pattern deviation plot with a probability of occurring in <5% of the normal population, with 1 of these points having the probability of occurring in <1% of the normal population; a pattern standard deviation of P <5%, or a glaucoma hemifield test result outside normal limits. VF defects had to be repeatable in at least 2 subsequent tests. Glaucoma was categorized into 3 subgroups according to the modified Hodapp-Anderson-Parrish grading scale based on the MD of VFs. Early glaucoma was defined as VF loss with an MD of ≥−6 dB; moderate glaucoma as an MD between −6 and −12 dB; and severe glaucoma as an MD worse than −12 dB.
POAG was defined as the presence of an abnormal glaucomatous optic disc (diffuse or focal thinning of the neuroretinal rim); an abnormal VF consistent with glaucoma; and an IOP >21 mm Hg (without topical medical treatment). Patients were defined as having NTG if they had an abnormal glaucomatous optic disc, an abnormal glaucomatous VF, and an IOP ≤21 mm Hg (without topical medical treatment) during repeated measurements on various days. The control group was defined as those having IOP <21 mm Hg, with no history of increased IOP, the absence of glaucomatous disc appearance, no visible RNFL defect according to red-free photography, and normal VF results. Absence of a glaucomatous disc appearance was defined as an intact neuroretinal rim without peripapillary hemorrhages, notches or localized pallor.
Swept-Source OCT
We used a DRI-OCT system (Topcon, Tokyo, Japan) with an axial scan rate of 100,000 Hz operated at the 1 μm wavelength region. This swept-source OCT uses a light source of a wavelength-sweeping laser centered at 1050 nm, with a repetition rate of 100,000 Hz, yielding an 8 μm axial resolution in tissue. The transverse resolution was set to approximately 20 μm. A single OCT image consisting of 1000 A lines can be acquired in 10 ms. The tissue imaging depth was 2.6 mm, and the lateral scan length was adjustable.
Two scanning protocols were used for each participant: a 12 mm line scan to include both macular and ONH regions and a 6 mm, 5-line raster scan of the ONH. The 32 or 96 single images thus acquired were registered and averaged by the software to create an averaged image. For a 12 mm line scan, the 96 single images were registered and averaged by the software to create a multiaveraged single image. For a 6 mm, 5-line raster scan, the 32 single images were registered and averaged by software to create a multiaveraged single image. Each image from both scan types consisted of 1024 A-scans. A horizontal scan was centered on the midpoint between the fovea and the optic disc for the 12 mm scan and was centered on the optic disc for the 6 mm scan.
Measurement of Scleral and Laminar Thicknesses
From the multiaveraged OCT images, we measured the scleral and laminar thicknesses using the caliper function of the built-in software of the OCT by 2 authors in a blinded fashion (HYP, JAC). Scleral thickness was measured from the 12 mm line scan images, and the laminar thickness was measured from the 6 mm, 5-line raster scan images.
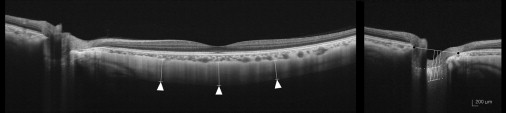
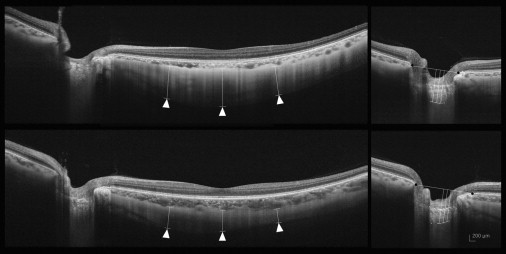
The scleral thickness was defined as the distance between the chorioscleral interface and the outer scleral border. The outer surface of the sclera was identified carefully in the OCT scans from retro-ocular structures. Scleral tissues were identified by their lamellar morphologic features and high reflectivity values. Subfoveal scleral thickness was defined as the average of 3 measurements—from the subfoveal point and 1000 μm temporal and 1000 μm nasal from the subfoveal point. All measurements were performed perpendicular to the retinal pigment epithelium line ( Figure 1 , left ). Laminar thickness was defined as the distance between the anterior and the posterior borders of the highly reflective region at the vertical center of the ONH in the horizontal B-scans. Measurements were performed along a perpendicular line from the reference line connecting the end of the Bruch membrane. The average of 3 measurements was taken as the laminar thickness, which was measured at the center of the reference line and 50 μm temporally and 100 μm temporally from the center ( Figure 1 , right).
Measurement Reproducibility
In the present study, the lines of the chorioscleral border, the outer scleral border and the anterior and posterior laminar borders were determined manually, in a masked fashion, by the observers. To evaluate the intraobserver and interobserver reproducibilities of our measurements, 20 randomly selected B-scans were assessed. The analysis was based on 5 independent series of reevaluations conducted by the 2 authors (HYP, JAC). The absolute agreement of a single observer’s measurement and the mean of all 5 measurements conducted by the 2 observers were calculated with the intraclass correlation coefficient (ICC) from a 2-way mixed-effect model. To indicate the value of the averaged measurements of 2 observers, the averaged ICC values were calculated using the Spearman-Brown prophecy formula, which gives the expected absolute agreement between the observers. According to Fleiss, ICC scores ≥0.75, between 0.40 and 0.75, or ≤0.4 are considered to be excellent, moderate and poor, respectively.
Statistical Analysis
Statistical analyses were performed using the SPSS software (v 16.0; SPSS, Chicago, IL, USA). The Mann-Whitney U test and ANOVA with the Scheffe multiple comparison were used to compare the data among the groups. The χ 2 test was used to analyze categoric variables. The Pearson correlation was calculated to assess the relationships of scleral and laminar thicknesses with age, axial length, central corneal thickness, and the MD of the VF. The level of statistical significance was set at P < 0.05.
Results
Swept-source OCT images of the macular and ONH regions of 103 patients with glaucoma and 43 controls were obtained. In 16 (37.2%) of the controls and 34 (33.0%) of the patients with glaucoma, the posterior border of the sclera was unclear and could not be identified. In 7 (16.3%) of the controls and 11 (10.7%) of the patients with glaucoma, vascular shadowing prevented clear imaging of the posterior border of the lamina cribrosa. The remaining 58 patients (26 with POAG and 32 with NTG) and 20 controls were considered for the measurement and analysis of scleral and laminar thicknesses.
Subject Baseline Characteristics
Age, gender, spherical equivalent, axial length, and central corneal thickness were similar in the control, POAG and NTG groups. Mean treated IOP at the time of swept-source OCT was also similar in the 3 groups ( P = 0.503). With regard to the average RNFL thickness and the MD of the VF, there were significant differences among the control, POAG and NTG groups ( P < 0.001 and P = 0.025, respectively). However, there were no significant differences in the average RNFL thicknesses ( P = 0.450) or the MD of the VF ( P = 0.622) between the POAG and the NTG groups ( Table 1 ). The MD was similar in the POAG and NTG groups in the early ( P = 0.859), moderate ( P = 0.144), and severe ( P = 0.322) stages of glaucoma.
| Control (n = 20) | POAG (n = 26) | NTG (n = 32) | P Value | |
|---|---|---|---|---|
| Age, year | 47.56 ± 11.23 | 52.14 ± 12.29 | 49.54 ± 15.16 | 0.222 a / 0.123 c |
| Gender, male:female | 6:14 | 14:12 | 11:20 | 0.215 b / 0.131 b |
| Sperical equivalent, diopter | −6.72 ± 4.98 | −7.02 ± 4.75 | −6.97 ± 5.18 | 0.440 a / 0.296 c |
| Axial length, mm | 27.39 ± 2.24 | 27.43 ± 2.28 | 27.29 ± 2.23 | 0.689 a / 0.722 c |
| Central corneal thickness, μm | 516.10 ± 31.54 | 528.57 ± 32.24 | 521.40 ± 32.74 | 0.265 a / 0.464 c |
| Intraocular pressure, mm Hg | 15.15 ± 2.11 | 15.95 ± 3.10 | 15.16 ± 2.46 | 0.503 a / 0.615 c |
| Average RNFL thickness, μm | 92.45 ± 12.16 | 71.23 ± 12.04 | 73.42 ± 10.81 | <0.001 a / 0.226 c |
| Mean deviation of perimetry, dB | −2.61 ± 2.84 | −5.35 ± 4.26 | −5.09 ± 4.08 | 0.025 a / 0.144 c |
a Comparison among the 3 groups by one-way analysis of variance.
b Comparison between 2 groups or among the 3 groups.
Reproducibility of Scleral and Laminar Thickness Measurements by Swept-Source OCT
To evaluate intraobserver and interobserver reproducibilities, the lines of the chorioscleral border, the outer scleral border, and the anterior and posterior laminar borders in the images of 20 subjects were determined independently by 2 observers. Then 5 independent series of reevaluations were performed by each observer. Intraobserver reproducibility showed moderate to excellent measurement reproducibility, with an ICC of subfoveal scleral thickness between 0.817 and 0.858 and an ICC of laminar thickness between 0.912 and 0.938. Interobserver reproducibility showed excellent measurement reproducibility between the 2 observers. The interobserver mean ICC was 0.847 (0.714–0.877) for the subfoveal scleral thickness and 0.926 (0.910–0.969) for the laminar thickness ( Table 2 ).
| Intraobserver ICC a | Interobserver ICC b | ||
|---|---|---|---|
| ICC (Observer 1) | ICC (Observer 2) | ||
| Subfoveal scleral thickness | 0.817 (0.709–0.874) | 0.858 (0.791–0.884) | 0.847 (0.714–0.877) |
| Laminar thickness | 0.938 (0.887–0.972) | 0.912 (0.879–0.960) | 0.926 (0.910–0.969) |
Scleral and Laminar Thicknesses
The mean (±standard deviation) thickness of the subfoveal sclera in the control group was 659.18 ± 101.96 μm. The subfoveal scleral thicknesses were 670.84 ± 160.60 μm in the POAG group and 496.55 ± 115.20 μm in the NTG group; these difference were significant ( P = 0.030). There was no significant difference between the control and POAG groups ( P = 0.214); however, the POAG and NTG group values differed significantly ( P = 0.028).
The laminar thickness was 385.95 ± 72.98 μm in the control group. This was significantly decreased to 352.00 ± 75.26 μm in the POAG group and was further decreased to 291.78 ± 78.75 μm in the NTG group. Laminar thickness differed significantly among the 3 groups ( P = 0.034). There was a significant difference between the POAG and NTG groups ( P = 0.028). However, the difference between the control and POAG groups showed only moderate significance ( P = 0.065; Table 3 ).


