Purpose
To correlate human foveal development visualized by spectral-domain optical coherence tomography (SDOCT) with histologic specimens.
Design
Retrospective, observational case series.
Methods
Morphology and layer thickness of retinal SDOCT images from 1 eye each of 22 premature infants, 30 term infants, 16 children, and 1 adult without macular disease were compared to light microscopic histology from comparable ages.
Results
SDOCT images correlate with major histologic findings at all time points. With both methods, preterm infants demonstrate a shallow foveal pit indenting inner retinal layers (IRL) and short, undeveloped foveal photoreceptors. At term, further IRL displacement forms the pit and peripheral photoreceptors lengthen; the elongation of inner and outer segments (IS and OS, histology) separates the IS band from retinal pigment epithelium. Foveal IS and OS are shorter than peripheral for weeks after birth (both methods). By 13 months, foveal cone cell bodies stack >6 deep, Henle fiber layer (HFL) thickens, and IS/OS length equals peripheral; on SDOCT, foveal outer nuclear layer (which includes HFL) and IS/OS thickens. At 13 to 16 years, the fovea is fully developed with a full complement of SDOCT bands; cone cell bodies >10 deep have thin, elongated, and tightly packed IS/OS.
Conclusions
We define anatomic correlates to SDOCT images from normal prenatal and postnatal human fovea. OCT bands typical of photoreceptors of the adult fovea are absent near birth because of the immaturity of foveal cones, develop by 24 months, and mature into childhood. This validates the source of SDOCT signal and provides a framework to assess foveal development and disease.
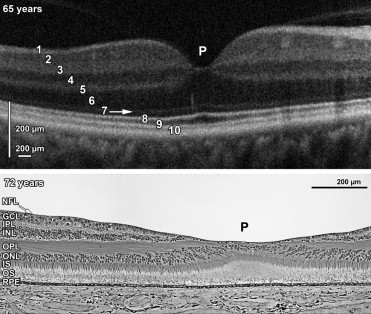
High-resolution spectral-domain OCT (SDOCT) with reported resolution of <5 μm has enabled visualization of retinal anatomy and clinical evaluation of retinal pathology in the adult retina. SDOCT displays alternating bands of hyper- and hyporeflectivity ( Figure 1 , Top) that correspond with histologically defined retinal layers ( Figure 1 , Bottom). The SDOCT bands have been labeled from inner to outer: nerve fiber layer (NFL); ganglion cell layer (GCL); inner plexiform layer (IPL); inner nuclear layer (INL); outer plexiform layer/photoreceptor synapse layer (OPL/PSL); outer nuclear layer, which includes Henle fiber layer (ONL+HFL); external limiting membrane (ELM); inner segment and outer segment junction, which a recent report shows is inner segment band (IS); outer segments (OS); and retinal pigment epithelium (RPE). Note that the term OPL/PSL above refers to the hyperreflective band on SDOCT that has been conventionally assigned the term OPL. In classic histology OPL includes both the photoreceptor synapses and axons as they extend out from the foveal center. On SDOCT the axons, however, are hyporeflective and have been indistinguishable from the photoreceptor nuclei. Thus, the hyporeflective band, labeled ONL+HFL here, includes the axons and nuclei and has been conventionally termed ONL. These revised terms are based on the publications of Curcio and associates, Lujan and associates, and Spaide and Curcio.
Maldonado and associates recently reported absence and variations in many of these layers as evidence of the dynamic morphologic changes associated with development of human fovea from SDOCT imaging. These in vivo changes of inner and outer retinal layers at the foveal center generally appeared consistent with cellular redistributions reported in histologic studies; however, a cross-sectional analysis with direct comparison to histologic specimens was not performed. There are numerous reports of macular abnormalities in infants on SDOCT and it would be appropriate to compare to infant histology rather than to the adult eye.
We present a direct correlation using human histologic specimens and SDOCT images, and create a timeline for onset of retinal layers. This correlation will be required for the clinical assessment of normal and pathologic development of infant retina by SDOCT. This also aids in defining and validating SDOCT bands for the adult eye.
Methods
SDOCT Subjects
Twenty-two premature infants, 30 term infants, 16 children, and 1 adult were enrolled between January 20, 2009 and January 27, 2012 under research protocols approved by the Duke University Health System Institutional Review Board. Parents or guardians of subjects consented to participation in these observational studies using SDOCT imaging. Imaging was performed at the time of standard dilated fundus examination in neonatal intensive care unit (NICU), in outpatient clinic, or during an examination under anesthesia for pediatric eye care. In the newborn nursery, both the dilated fundus examination and the SDOCT imaging were part of the research protocol. Subjects’ medical records were reviewed for health history and gestational age. Images from a normal adult subject consented in an SDOCT imaging study were used for comparison. Table 1 describes the age range for each study phase and demographics of each subject.
| Phase | Age Range | Median Age | Sex | Race |
|---|---|---|---|---|
| 1 (n = 8) | 30–32 wk | 31 wk | 4 M; 4 F | 2 W; 5 B; 1 MR |
| 2 (n = 14) | 33–36 wk | 35 wk | 5 M; 9 F | 5 W; 9 B |
| 3 (n = 19) | 37–39 wk | 39 wk | 9 M; 10 F | 9 W; 8 B; 1 A; 1 H |
| 4 (n = 11) | 40–42 wk | 41 wk | 3 M; 8 F | 7 W; 4 B |
| 5 (n = 6) | 43 wk–23 mo | 7 mo | 4 M; 2 F | 4 W; 1 B; 1 A |
| 6 (n = 5) | 2–5 y | 3 y | 5 M | 5 W |
| 7 (n = 5) | 6–16 y | 8 y | 2 M; 3 F | 3 W; 2 A |
SDOCT Imaging Procedure
After dilated examination by the ophthalmologist, a research portable, hand-held SDOCT unit (Bioptigen Inc, Research Triangle Park, North Carolina, USA) was used to image both eyes of all subjects per protocol as previously published. In awake infants, no sedation or lid speculum was used and several macular volume scans centered on the fovea were captured at 0 or 90 degrees.
SDOCT Image Processing and Retinal Layer Thickness Measurements
SDOCT images were converted into Digital Imaging and Communications in Medicine (DICOM) format and evaluated qualitatively by experienced SDOCT graders using OSIRIX medical imaging software (OSIRIX Foundation, Geneva, Switzerland) for the presence of fovea, all retinal layers, and any pathologic abnormality. Poor quality or scans with retinal pathology, including cystoid macular edema or subretinal fluid, as defined in our prior publications, were excluded. Reproducibility of the grading was established by inter-reader agreement. Graders were masked to other clinical data. The highest-quality scans from each subject containing the center of the fovea were selected from each session, based on subjective assessment of resolution. Because of varying eye size with age, B-scans ranged from 6.3 to 10.3 mm in length with 630 to 1000 A-scans per B-scan. Pixel size data were verified by age for each eye. To avoid intra-eye variation, a random number generator was used to select 1 imaging session of 1 eye per subject per age group for analysis.
To quantify retinal layers, the semiautomated segmentation of a single central scan was performed using a custom software, DOCTRAP (Duke OCT Retinal Analysis Program) version 16.1, based in MATLAB (Mathworks, Natick, Massachusetts, USA). The segmentation lines were placed on the inner aspect of inner limiting membrane (ILM), GCL, INL, OPL/PSL, ONL+HFL, IS band, RPE, and Bruch membrane. Therefore, the outlined retinal layers included ILM+NFL, GCL+IPL, INL, OPL/PSL, ONL+HFL, IS+OS, and RPE. External limiting membrane (ELM) was not visible in the young infants and thus not routinely segmented. Retinal foveal thickness was defined as the thickness of the entire neurosensory retina from the ILM to the inner aspect of the RPE. To improve image resolution SDOCT images were summed and illustrated in figures. A custom MATLAB script was implemented on the segmentation output to compute thickness of entire retina and each segmented layer at the foveal center, and then at 250-μm intervals to 2000 μm at each phase. To assess pit development, we also computed foveal/parafoveal ratio (parafoveal = 1000 μm from fovea) for retinal thicknesses as illustrated in Table 2 .
| Phase 1 30–32 wk PMA | Phase 2 33–36 wk PMA | Phase 3 37–39 wk PMA | Phase 4 40–42 wk PMA | Phase 5 43 wk–23 mo PMA | Phase 6 2–5 y | Phase 7 6–16 y | |
|---|---|---|---|---|---|---|---|
| Neurosensory retina | 0.66 | 0.56 | 0.56 | 0.36 | 0.48 | 0.57 | 0.64 |
| NFL | 0.43 | 0.33 | 0.17 | 0.23 | 0.27 | 0.15 | 0.29 |
| GCL+IPL | 0.48 | 0.41 | 0.16 | 0.13 | 0.05 | 0.17 | 0.07 |
| INL | 0.99 | 0.72 | 0.27 | 0.23 | 0.24 | 0.21 | 0.24 |
| OPL-PSL | 0.75 | 0.78 | 0.99 | 0.99 | 0.99 | 0.99 | 0.99 |
| ONL+HFL | 0.79 | 0.83 | 0.65 | 0.60 | 0.98 | 1.51 | 1.66 |
| IS+OS | 0.38 | 0.42 | 0.66 | 1.15 | 1.22 | 1.28 | 1.48 |
| RPE | 1.04 | 1.03 | 1.02 | 0.97 | 0.92 | 1.15 | 1.09 |
Stay updated, free articles. Join our Telegram channel

Full access? Get Clinical Tree


