Purpose
To investigate the thickness and variation profiles of 8 intraretinal layers in myopia.
Design
Prospective cross-sectional study.
Methods
Young subjects with spherical equivalents ranging from +0.50 to −10.25 diopters and good corrected vision were divided into emmetropic (n = 20), low myopic (n = 50), and high myopic (n = 30) groups. Retinal images centered on the fovea along the horizontal and vertical meridians were obtained by ultrahigh-resolution optical coherence tomography (OCT). Macular images were segmented into 8 intraretinal layers by an automatic segmentation algorithm to yield thickness profiles within a 6-mm-diameter circle divided into central, pericentral, and peripheral regions.
Results
For intraretinal layers in the central region, the outer segment of receptors layer was thicker in the high myopic group and positively correlated with axial length. In the pericentral and peripheral regions, all layers except the ganglion cell and inner plexiform layer had thickness changes in high myopia. The total thickness of the peripheral region was less than in the emmetropic controls owing to thinner inner nuclear layer, combined Henle fiber and outer nuclear layer, and outer segment of receptors layer. Nevertheless, the thicknesses of the combined myoid and ellipsoid zone and the combined interdigitation zone and retinal pigment epithelium/Bruch complex in the peripheral region were greater than for the emmetropic controls.
Conclusions
Intraretinal layer thicknesses in young high myopic eyes varied significantly from emmetropic controls, especially in the peripheral region. Ultrahigh-resolution OCT with automated segmentation can detect changes in retinal macular microstructure during the development of myopia.
Myopia is a common ocular abnormality worldwide. With very large increases in refractive diopter (D), the retina can degenerate and become thinner, and the retinal microstructures change, especially at the posterior pole. Myopia is a risk factor for a number of retinal pathologies such as retinal detachment, macular holes, choroidal neovascularization, and retinoschisis. Thus, complications related to myopia are one of the leading causes of blindness. As a result, early detection of the changes in intraretinal structures is of utmost importance for the myopic eye. Understanding the abnormal patterns of retinal structures will help in assessing early-stage, myopia-related complications.
High-speed and high-resolution optical coherence tomography (OCT) has enabled imaging and measurement of retinal thickness in vivo, and it is widely used to evaluate structural change associated with retinal diseases. Recently, with improvements in axial resolution and image processing methods, OCT-based in vivo macular thickness measurements of the intraretinal layers have been made possible. Automated layer segmentation algorithms have been developed to analyze the intraretinal layer thicknesses. These studies have shown that the thickness of specific retinal layers can help to diagnose and monitor pathologic changes in the macula resulting from retinal diseases, glaucoma, and optic neuropathy.
Several studies have used OCT to investigate relationships between variations in macular thickness and myopia. The thicknesses of the retinal nerve fiber layer (NFL), ganglion cell layer (GCL), and inner plexiform layer (IPL) were reported by some authors to be thinner in myopic eyes compared to normal eyes. Furthermore, the thickness of the outer retinal layers, including the retinal pigment epithelium (RPE) and the photoreceptor layer, vary according to the axial length (AL). However, the results of the above studies are controversial because the characteristic of macular intraretinal layer thickness in myopia remains unclear. Additionally, it is important to determine if there is any correlation between the thickness of specific retinal layers and the AL and/or the refractive error in myopic patients and to determine if such correlations are predictive of developing myopia-related complications.
Recently, we used the principle of dynamic shortest path search to develop a segmentation algorithm that automatically identifies 8 intraretinal layers. The purpose of the current study was to use ultrahigh-resolution OCT and the automated layer segmentation algorithm to obtain the horizontal and vertical macular thickness profiles of the 8 intraretinal layers in myopic eyes. Based on those data, we analyzed variations in the individual macular layer thicknesses in the myopic and nonmyopic eyes and the correlations between intraretinal layer thickness, AL, and spherical refraction.
Methods
Subjects
One hundred young subjects (mean ± standard deviation age: 24.9 ± 2.5 years; range: 17–30 years) were recruited from the students of Wenzhou Medical University in this prospective, cross-sectional study. This project was approved by the Ethics Committee of the Wenzhou Medical University, and written consent was obtained from all subjects after they were informed about the nature, risks, and possible adverse consequences of the procedure. The study was performed in accordance with the tenets of the Declaration of Helsinki.
The enrolled subjects were divided into the following 3 subgroups according to their spherical equivalents (SEs): emmetropia (from +0.50 D to −0.50 D, n = 20), low to moderate myopia (from −0.5 D to −6.00 D, n = 50), and high myopia (<−6.00 D, n = 30). Each subject underwent a complete ocular examination, which included measurements of best-corrected visual acuity, autorefractometry and keratometry by an autorefractor (KR8900; Topcon, Tokyo, Japan), AL using an optical biometer (IOL Master; Carl Zeiss Meditec, Jena, Germany), slit-lamp examination, intraocular pressure (IOP) by Goldmann applanation tonometry, funduscopy, and visual field testing.
Inclusion criteria were as follows: best-corrected visual acuity of 20/20 or better, refractive error lower than +0.5 D, astigmatism lower than 1.00 D, and less than 2.00 D difference in the refractive error between the 2 eyes. Those with clinical evidence of IOP more than 21 mm Hg, visual field defects, myopic macular degeneration, a history of vitreoretinal disease, intraocular surgery, or systemic disease that could affect the eyes were excluded from the study.
Ultrahigh-Resolution Optical Coherence Tomography
A custom-built ultrahigh-resolution OCT instrument with an axial resolution of approximately 3 μm was used to image the retina. The features of the instrument have been described previously in detail. Briefly, a superluminescent diode (T840; SuperLum Diodes Ltd, Moscow, Russia) with a center wavelength of 840 nm and a bandwidth of 100 nm was used as a light source. An ocular lens (60 D; Volk Optical, Mentor, Ohio, USA) was adapted to a slit-lamp system to image the posterior segment of the eye.
Two-dimensional OCT images were acquired from each subject using a cross-line scan protocol. Each OCT B-scan consisted of 1365 pixels in depth and 2048 pixels in width. The scan width was set to 8 mm, and it was calibrated with a model eye (OEMI-7; Ocular Instruments, Bellevue, Washington, USA). During OCT imaging, each subject was asked to sit in front of a slit lamp on which the OCT probe was mounted. An external fixation target was provided for the subject, and the central OCT beam was set on the fovea. All OCT examinations were performed by the same operator (X.L.).
Data Analysis
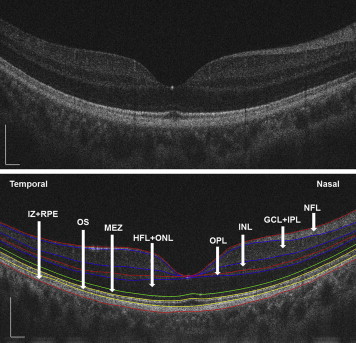
Following data collection, the ultrahigh-resolution OCT images were processed using custom-developed software. A good set of horizontal and vertical scans for each subject were selected to segment the intraretinal layer structures into 8 layers ( Figure 1 ) that included (1) NFL, (2) the ganglion cell layer and inner plexiform layer (GCL+IPL), (3) the inner nuclear layer (INL), (4) the outer plexiform layer (OPL), (5) the Henle fiber layer and outer nuclear layer (HFL+ONL), (6) the myoid and ellipsoid zone (MEZ), (7) the outer segment of photoreceptors (OS), and (8) the interdigitation zone and RPE/Bruch complex (IZ+RPE). The standardized nomenclature was used as recommended by the International Nomenclature for Optical Coherence Tomography Panel. All of the detected intraretinal layer boundaries were segmented using graph theory and the shortest-path search method based on an optimization algorithm of the dynamic programming technique. In addition, all of the boundaries were checked by visual inspection performed by 2 of the authors (X.L. and Q.M.). A semi-automated approach was incorporated into the algorithm to correct for any minor segmentation errors. We obtained thickness profiles of the 8 intraretinal layers after adjusting the ocular magnification with Bennett’s formula. Bennett’s formula relies on the AL to correct ocular magnification, which is approximated based on the estimated location of the second principal point and its usual spatial relationship to the nodal point. The relationship between the measurement of the OCT image and the size of the actual scan length was expressed as t = p × q × s, where t was the actual scanning length, p was a magnification factor related to the camera of the OCT imaging system, q was a magnification factor related to the eye, and s was the measurement obtained by OCT. The correction factor q can be determined with the formula q = 0.01306•(x−1.82), where x is the AL. For example, when the AL of the model eye is 24.46 mm, the actual scanning length was 8 mm, p × s = 8/[0.01306(24.46−1.82)]. If we use the same OCT system to image a highly myopic eye with an AL of 28.24 mm (the longest axial length in our study), the actual scanning length in this eye would be: [0.01306(28.24−1.82)] × 8/[0.01306(24.46−1.82)] = 9.34 mm.
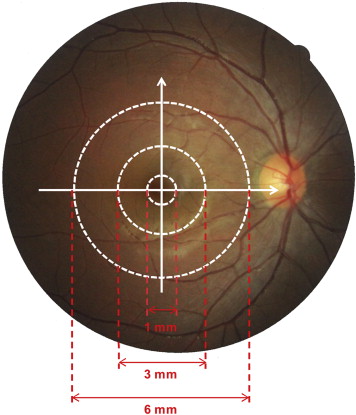
For each eye included in this study, the horizontal and vertical thickness profiles of each individual retinal layer were obtained. Then the macular thickness of each individual retinal layer was averaged across horizontal and vertical scans. For analysis, the mean thickness of each layer within 3 concentric regions was calculated ( Figure 2 ). The central region was a circle with a diameter of 1 mm, centered on the fovea. The pericentral region consisted of a concentric ring around the central region. It extended from the edge of the central region and had an outer diameter of 3 mm centered on the fovea. The peripheral region consisted of a concentric ring around the pericentral and central region. It extended from the edge of the pericentral region and had an outer diameter of 6 mm centered on the fovea.
Statistical Analyses
The right eyes were selected for analysis in this study. Refraction data were converted to SEs, which were calculated as the spherical dioptric power plus one-half of the cylindrical dioptric power. Macular thickness differences between subgroups were evaluated with a 1-way analysis of variance (ANOVA). Associations between macular thicknesses and the AL and SE were determined with Pearson correlation tests. All data are expressed as the means ± the standard deviations and were analyzed with SPSS software (version 17.0; SPSS Inc, Chicago, Illinois, USA). P values <.05 were considered statistically significant.
Results
A total of 100 eyes from 100 young healthy subjects with SEs ranging from +0.50 D to −10.38 D (mean: −4.12 ± 2.77 D) and ALs ranging from 22.74 mm to 28.24 mm (mean: 25.29 ± 1.35 mm) were included in the analysis ( Table 1 ).
| Emmetropia | Low to Moderate Myopia | High Myopia | |
|---|---|---|---|
| Number of subjects | 20 | 50 | 30 |
| Age, years (range) | 27.15 ± 4.51 (22–29) | 25.18 ± 1.69 (23–30) | 24.43 ± 3.43 (17–30) |
| Sex, male/female | 15/5 | 17/33 | 9/21 |
| SE, D (range) | −0.02 ± 0.39 (+0.50 to −0.50) | −3.55 ± 1.54 (−1.125 to −5.75) | −7.85 ± 1.37 (−6.00 to −10.375) |
| AL, mm (range) | 23.72 ± 0.69 (22.74–24.16) | 24.94 ± 1.06 (22.84–27.33) | 26.61 ± 0.97 (24.97–28.24) |
Thickness Profiles of the Intraretinal Layers
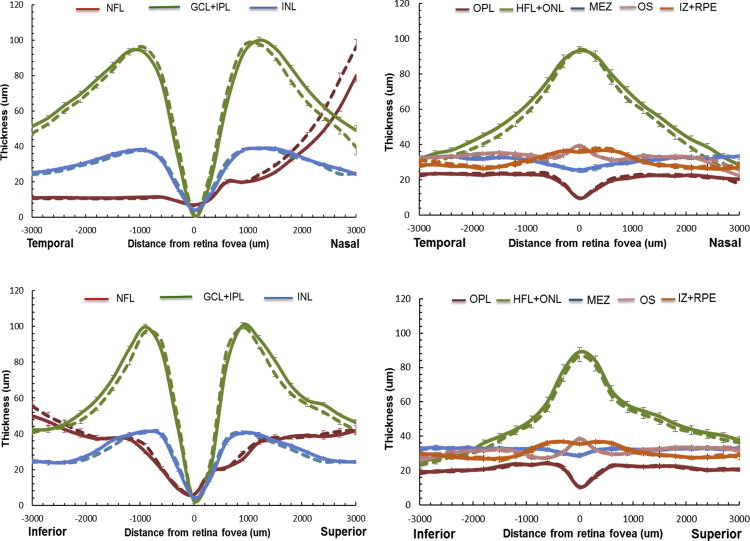
For the study myopic population, the mean macular thickness profiles of the intraretinal layers along the horizontal and vertical meridians were determined before and after adjusting ocular magnification ( Figure 3 ). Before the adjustment for ocular magnification, the NFL thickness on the nasal side was overestimated and GCL+IPL thickness in the peripheral region was underestimated. The total and the regional macular thicknesses of the intraretinal layers in each subgroup are summarized in Table 2 . After adjusting for ocular magnification, the mean total retinal thickness did not vary with the degree of myopia, although there were thickness changes within the intraretinal layers. The thicknesses of the INL and the HFL+ONL were thinner (ANOVA, P < .05) in the myopic groups, while the OPL and MEZ were thicker (ANOVA, P < .05) compared to the emmetropic group. In the central region, only the OS thickness was increased in the highly myopic group (ANOVA, P < .05). However, in the pericentral and peripheral regions, all layers except the GCL+IPL had thickness changes in high myopia. Especially in the peripheral region, highly myopic eyes had thinner INL, HFL+ONL, and OS layers and thicker MEZ and IZ+RPE layers. Notably, the total retinal thickness in highly myopic eyes was thinner in the peripheral region.
| Emmetropia (n = 20) | Low to Moderate Myopia (n = 50) | High Myopia (n = 30) | P | |
|---|---|---|---|---|
| Mean | ||||
| NFL | 22.48 ± 2.54 (23.01 ± 1.83) | 22.96 ± 1.87 (23.34 ± 2.04) | 23.12 ± 2.33 (24.62 ± 2.53) | .576 (.015 a ) |
| GCL+IPL | 60.53 ± 4.35 (60.38 ± 4.45) | 58.03 ± 5.37 (57.92 ± 5.30) | 58.76 ± 5.12 (58.35 ± 5.02) | .185 (.184) |
| INL | 29.41 ± 3.23 (29.40 ± 3.10) | 28.00 ± 2.64 (28.00 ± 2.62) | 27.10 ± 2.70 (27.12 ± 2.65) | .019 b (.018 a ) |
| OPL | 19.13 ± 0.95 (19.15 ± 0.92) | 18.73 ± 1.08 (18.75 ± 1.07) | 20.00 ± 1.64 (20.07 ± 1.59) | <.001 b (<.001 a ) |
| HFL+ONL | 68.97 ± 9.17 (67.87 ± 8.20) | 64.53 ± 8.20 (64.09 ± 8.23) | 61.22 ± 7.88 (58.95 ± 8.33) | .007 b (.019 a ) |
| MEZ | 27.05 ± 4.71 (27.10 ± 4.65) | 29.52 ± 3.29 (29.53 ± 3.30) | 30.93 ± 2.81 (31.05 ± 2.86) | .001 b (.001 a ) |
| OS | 32.37 ± 2.02 (32.33 ± 1.96) | 32.15 ± 2.20 (32.13 ± 2.22) | 32.57 ± 3.01 (32.33 ± 2.96) | .763 (.923) |
| IZ+RPE | 32.17 ± 2.94 (31.88 ± 2.60) | 31.49 ± 1.91 (31.41 ± 1.83) | 31.90 ± 2.16 (31.73 ± 2.21) | .430 (.619) |
| Total | 292.10 ± 13.58 (291.13 ± 13.58) | 285.42 ± 13.03 (285.17 ± 12.88) | 285.60 ± 13.16 (284.22 ± 13.12) | .138 (.153) |
| Central region | ||||
| HFL+ONL | 88.62 ± 8.90 (88.03 ± 8.49) | 86.65 ± 10.28 (86.37 ± 10.15) | 85.55 ± 9.81 (83.65 ± 10.84) | .561 (.291) |
| MEZ | 27.02 ± 4.77 (26.96 ± 4.83) | 28.30 ± 3.97 (28.31 ± 3.97) | 28.60 ± 3.40 (28.79 ± 3.37) | .363 (.274) |
| OS | 32.45 ± 2.05 (32.21 ± 1.90) | 32.40 ± 2.51 (32.31 ± 2.50) | 34.24 ± 3.18 (33.94 ± 3.17) | .009 b (.018 a ) |
| IZ+RPE | 37.73 ± 2.89 (37.60 ± 2.83) | 37.28 ± 2.78 (37.28 ± 2.78) | 36.26 ± 2.96 (36.24 ± 2.90) | .158 (.175) |
| Total | 253.49 ± 13.03 (255.58 ± 12.81) | 250.42 ± 17.81 (251.47 ± 18.48) | 252.14 ± 17.33 (256.13 ± 17.80) | .769 (.439) |
| Pericentral region | ||||
| NFL | 21.38 ± 1.80 (21.71 ± 1.45) | 21.63 ± 1.70 (21.83 ± 1.86) | 23.13 ± 2.51 (23.99 ± 2.69) | .002 b (<.001 a ) |
| GCL+IPL | 90.34 ± 7.02 (90.62 ± 6.67) | 88.89 ± 6.64 (88.77 ± 6.59) | 89.12 ± 6.83 (88.93 ± 6.46) | .718 (.550) |
| INL | 41.06 ± 5.03 (41.08 ± 4.89) | 39.57 ± 3.37 (39.51 ± 3.30) | 37.71 ± 3.49 (37.72 ± 3.38) | .009 b (.008 a ) |
| OPL | 21.77 ± 2.39 (21.78 ± 2.20) | 20.93 ± 1.37 (20.95 ± 1.37) | 22.56 ± 2.64 (22.61 ± 2.54) | .003 b (.002 a ) |
| HFL+ONL | 69.85 ± 9.72 (68.83 ± 8.91) | 63.62 ± 9.02 (63.17 ± 9.21) | 59.40 ± 8.87 (56.98 ± 9.16) | .001 b (<.001 a ) |
| MEZ | 26.89 ± 4.96 (26.88 ± 4.97) | 29.80 ± 3.54 (29.82 ± 3.55) | 31.51 ± 3.38 (31.66 ± 3.37) | <.001 b (<.001 a ) |
| OS | 30.15 ± 3.02 (30.31 ± 3.15) | 30.58 ± 3.21 (30.66 ± 3.20) | 31.23 ± 3.75 (31.47 ± 3.80) | .511 (.440) |
| IZ+RPE | 32.95 ± 3.82 (32.48 ± 3.60) | 31.51 ± 2.87 (31.31 ± 2.71) | 31.78 ± 2.87 (31.11 ± 2.90) | .207 (.236) |
| Total | 334.39 ± 17.87 (333.68 ± 17.37) | 326.52 ± 14.65 (326.02 ± 14.65) | 326.43 ± 15.21 (324.48 ± 14.84) | .130 (.094) |
| Peripheral region | ||||
| NFL | 34.61 ± 5.22 (35.60 ± 4.22) | 35.19 ± 4.53 (36.04 ± 4.95) | 34.89 ± 4.60 (37.93 ± 5.04) | .888 (.158) |
| GCL+IPL | 63.27 ± 5.70 (62.00 ± 5.41) | 60.51 ± 5.03 (59.43 ± 4.94) | 61.29 ± 4.80 (56.73 ± 5.02) | .147 (.002 a ) |
| INL | 32.10 ± 2.67 (31.22 ± 2.70) | 29.76 ± 2.54 (29.47 ± 2.70) | 29.12 ± 2.59 (27.74 ± 2.72) | <.001 b (<.001 a ) |
| OPL | 21.22 ± 1.20 (21.05 ± 1.21) | 20.89 ± 1.21 (20.83 ± 1.21) | 21.63 ± 1.64 (21.32 ± 1.62) | .072 (.298) |
| HFL+ONL | 48.43 ± 9.70 (46.77 ± 8.15) | 43.32 ± 7.48 (42.74 ± 7.64) | 38.71 ± 7.43 (36.21 ± 7.34) | <.001 b (<.001 a ) |
| MEZ | 27.22 ± 4.50 (27.45 ± 4.22) | 30.47 ± 3.59 (30.45 ± 3.58) | 32.69 ± 3.60 (32.70 ± 3.65) | <.001 b (<.001 a ) |
| OS | 34.52 ± 2.63 (34.47 ± 2.45) | 33.48 ± 2.97 (33.43 ± 2.98) | 32.23 ± 3.48 (31.58 ± 3.46) | .035 b (.003 a ) |
| IZ+RPE | 25.82 ± 2.64 (25.56 ± 2.41) | 25.70 ± 2.28 (25.64 ± 2.23) | 27.67 ± 3.15 (27.83 ± 3.44) | .005 b (.001 a ) |
| Total | 288.43 ± 15.43 (284.12 ± 15.32) | 279.31 ± 11.63 (278.02 ± 11.74) | 278.22 ± 13.72 (272.05 ± 13.93) | .016 b (.008 a ) |
a Significant difference between emmetropia, low to moderate myopia, and high myopia before adjusting for ocular magnification.
b Significant difference between emmetropia, low to moderate myopia, and high myopia after adjusting for ocular magnification.
Relationships Between Thickness Profiles and Spherical Equivalents and Axial Length
There were significant correlations between intraretinal layer thicknesses and the SE and AL ( Table 3 ). After adjusting for ocular magnification, the average macular thicknesses of the HFL+ONL and MEZ layers were correlated with SE (r = 0.300 and −0.390 for HFL+ONL and MEZ, respectively, P < .005) and AL (r = −0.268 and 0.451 for HFL+ONL and MEZ, respectively, P < .05). In the central region, the MEZ and OS thicknesses were positively correlated with AL (r = 0.271 and 0.225, P < .05) but not correlated with SE. In the pericentral and peripheral regions, the variations in the intraretinal layer thicknesses were correlated with the AL and SE (−0.246 ≤ r ≤ 0.469, P < .05). None of the GCL+IPL thickness parameters were correlated with either the AL or SE after ocular magnification adjustment. The total retinal thickness in the peripheral region was positively correlated with SE (r = 0.232, P = 0.028).
| Spherical Equivalent | Axial Length | |||
|---|---|---|---|---|
| r | P Value | r | P Value | |
| Mean | ||||
| NFL | 0.062 (−0.269) | .559 (.010 a ) | 0.061 (0.368) | .565 (<.001 a ) |
| GCL+IPL | 0.014 (0.043) | .892 (.688) | 0.090 (0.052) | .401 (.624) |
| INL | 0.181 (0.185) | .089 (.081) | −0.126 (−0.133) | .236 (.211) |
| OPL | −0.156 (−0.278) | .143 (.012 a ) | 0.158 (0.275) | .137 (.013 a ) |
| HFL+ONL | 0.300 (0.412) | .004 b (<.001 a ) | −0.268 (−0.405) | .011 b (<.001 a ) |
| MEZ | −0.390 (−0.398) | <.001 b (<.001 a ) | 0.451 (0.461) | <.001 b (<.001 a ) |
| OS | 0.073 (0.106) | .495 (.320) | −0.046 (−0.086) | .668 (.420) |
| IZ+RPE | −0.067 (−0.081) | .531 (.450) | 0.172 (0.161) | .104 (.130) |
| Total | 0.108 (0.130) | .312 (.223) | 0.001 (−0.034) | .989 (.747) |
| Central region | ||||
| HFL+ONL | 0.058 (0.121) | .586 (.256) | −0.031 (−0.110) | .772 (.300) |
| MEZ | −0.182 (−0.210) | .086 (.048 a ) | 0.271 (0.299) | .010 b (.004 a ) |
| OS | −0.170 (−0.158) | .108 (.137) | 0.225 (0.194) | .033 b (.067) |
| IZ+RPE | 0.150 (0.142) | .157 (.181) | −0.114 (−0.109) | .286 (.306) |
| Total | −0.067 (−0.122) | .531 (.253) | 0.151 (0.245) | .156 (.020 a ) |
| Pericentral region | ||||
| NFL | −0.246 (−0.342) | .019 b (.001 a ) | 0.278 (0.428) | .008 b (<.001 a ) |
| GCL+IPL | 0.010 (0.047) | .925 (.657) | 0.057 (0.026) | .591 (.807) |
| INL | 0.258 (0.271) | .014 b (.010 a ) | −0.224 (−0.236) | .034 b (.025 a ) |
| OPL | −0.123 (−0.204) | .249 (.07) | 0.184 (0.276) | .082 (.013 a ) |
| HFL+ONL | 0.390 (0.450) | <.001 b (<.001 a ) | −0.366 (−0.460) | <.001 b (<.001 a ) |
| MEZ | −0.419 (−0.431) | <.001 b (<.001 a ) | 0.469 (0.484) | <.001 b (<.001 a ) |
| OS | −0.013 (−0.032) | .905 (.768) | −0.011 (0.021) | .917 (.848) |
| IZ+RPE | 0.015 (0.062) | .886 (.559) | 0.111 (0.027) | .299 (.801) |
| Total | 0.153 (0.198) | .150 (.061) | −0.056 (−0.114) | .598 (.283) |
| Peripheral region | ||||
| NFL | 0.006 (−0.203) | 0.957 (0.055) | 0.003 (0.305) | .977 (.003 a ) |
| GCL+IPL | 0.110 (0.338) | 0.304 (0.001 a ) | 0.001 (−0.368) | .994 (<.001 a ) |
| INL | 0.299 (0.398) | 0.004 b (<0.001 a ) | −0.283 (−0.470) | .007 b (<.001 a ) |
| OPL | −0.041 (−0.014) | 0.699 (0.902) | 0.055 (0.015) | .609 (.893) |
| HFL+ONL | 0.401 (0.589) | <0.001 b (<0.001 a ) | −0.361 (−0.567) | <.001 b (<.001 a ) |
| MEZ | −0.444 (−0.433) | <0.001 b (<0.001 a ) | 0.469 (0.463) | <.001 b (<.001 a ) |
| OS | 0.328 (0.403) | 0.002 b (<0.001 a ) | −0.289 (−0.377) | .006 b (<.001 a ) |
| IZ+RPE | −0.320 (−0.368) | 0.002 b (<0.001 a ) | 0.381 (0.412) | <.001 b (<.001 a ) |
| Total | 0.232 (0.322) | 0.028 b (0.002 a ) | −0.124 (−0.298) | .246 (.004 a ) |
Stay updated, free articles. Join our Telegram channel

Full access? Get Clinical Tree


