Purpose
To characterize the optical coherence tomography angiography (OCTA) appearance of the perifoveal macular microvasculature in visually asymptomatic patients with sickle cell disease, and to compare these findings with those of fluorescein angiography (FA).
Design
Retrospective observational case series.
Methods
Eighteen eyes of 9 consecutive patients with a median age of 41 years (range: 19–54 years) with electrophoretic confirmation of sickle cell disease were included and analyzed. A complete ophthalmologic examination was performed, including fundus examination, FA, and OCTA. Nine eyes of 5 healthy subjects were also analyzed with OCTA to serve as a control group.
Results
OCTA demonstrated microvascular abnormalities in the perifoveal region of the macula in all eyes, whereas FA appeared normal in 9 of 18 eyes (50%). Most capillary abnormalities were located in the temporal juxtafoveal region and involved both the superficial and the deep capillary plexuses. The nonflow area (foveal avascular zone) was significantly larger in sickle cell disease patients than in the control group, both in the superficial and the deep capillary plexuses ( P < .0001). The perifoveal vessel density was significantly lower in the sickle cell disease patients than in the control group in both the superficial ( P = .0011) and the deep capillary plexuses ( P = .0018).
Conclusion
OCTA provided detailed imaging of the perifoveal microvasculature in sickle cell disease. It appeared more sensitive than FA in detecting macular microangiopathy in asymptomatic patients. Microvascular abnormalities in sickle cell disease involved both the superficial and the deep capillary plexuses.
Sickle cell disease is one of the most common genetic diseases worldwide. Its highest prevalence occurs in the Middle East, Mediterranean regions, Southeast Asia, and sub-Saharan Africa. It is a chronic hemolytic disorder that is marked by tendency of hemoglobin proteins within red cells to polymerize and deform the red cell into a sickle shape, resulting in characteristic vaso-occlusive events and accelerated hemolysis. Vascular occlusions and local ischemia may occur in various parts of the body, including the retina. Situations such as hypoxia, acidosis, and inflammation promote these occlusive phenomena. Sickle cell disease is inherited in an autosomal recessive fashion either in the homozygous state or the double heterozygous state. Sickle cell disease includes several genotypes, the main 3 being HbS/HbS (SS), HbS/HbC (SC), and HbS/beta thalassemia (Sβ). The SC genotype is considered to be the most at risk of ocular complications. Although peripheral retinal vessel involvement is most widely documented, the macular area is not spared. Several vascular macular changes have been reported, such as enlargement of the foveal avascular zone (FAZ), perifoveal capillary nonperfusion, nerve fiber layer infarcts, and vascular remodeling at the posterior pole including microaneurysm-like dots and hairpin-shaped venular loops. On clinical examination, the macular area of the fundus typically appears normal and vascular abnormalities are revealed on fluorescein angiography (FA). Recently, spectral-domain optical coherence tomography (SD OCT) examination demonstrated focal macular thinning in sickle cell disease. The aim of our study was to characterize the appearance of the perifoveal macular microvasculature in visually asymptomatic patients with sickle cell disease using optical coherence tomography angiography (OCTA) and to compare these findings with those of healthy control subjects and those of the current gold standard, FA.
Methods
This study was conducted in accordance with the Declaration of Helsinki and current French legislation and with approval of the ethics committee of the Federation France Macula.
This retrospective observational case series was performed at the University Eye Clinic of Créteil, France. Consecutive patients diagnosed with sickle cell disease referred for a routine screening eye evaluation from November 1, 2014 to January 31, 2015 were included. This routine screening consists, in our department, of a complete eye examination including, in both eyes, best-corrected visual acuity (BVCA) assessment using a Monoyer visual acuity chart (French usual chart; results converted to Snellen visual acuity), slit-lamp examination of the anterior segment, dilated fundus biomicroscopy, and FA (Spectralis HRA+OCT; Heidelberg Engineering, Heidelberg, Germany) with series of early frames centered on the fovea acquired with the 30-degree standard lens and frames of the retinal periphery acquired with the 60-degree wide-field lens.
For this study, inclusion criteria were age 18 or above, electrophoretic confirmation of sickle cell disease (SS, SC, or Sβ), BCVA of 20/32 and above, and signature of written informed consent. Exclusion criteria were lens or other ocular media opacities preventing detailed imaging; high myopia (>−6 diopters); diabetes mellitus; clinical evidence of any other maculopathy such as retinal vein occlusion, vitreomacular traction syndrome, and epiretinal membrane; prior extensive laser, cryotherapy, or retinal surgery; and poor-quality images owing to extreme eye movement.
All included patients were examined with OCTA (AngioVue, RTVue XR Avanti; Optovue Inc, Fremont, California, USA). For each eye, a 3 mm × 3 mm macular cube centered on the fovea, composed of 320 B-scans separated by 9 μm, was acquired. Each B-scan contained 216 A-scans. The device had an A-scan-rate of 70 000 per second, using a light source centered on 840 nm, a bandwidth of 45 nm, and a depth resolution of 5.0 μm in tissue. Prototype software using the SSADA algorithms created OCTA images of the macular microvasculature. The software then reconstructed the retinal and choroidal microvasculature in 3 dimensions, with the ability to isolate microvasculature in specific layers of customized height in the retina and choroid. The automated retinal layer segmentation algorithm available on the device was used to analyze retinal microvasculature at 2 different levels: superficial capillary plexus and deep capillary plexus. Automatic segmentation individualizes the superficial capillary plexus 3 μm above the inner limiting membrane and 15 μm below the inner plexiform layer (IPL), and the deep capillary plexus 15 μm above and 70 μm below the IPL.
Normal African subjects were recruited from the staff of our department to serve as a control group for OCTA. They were age-, sex-, and race-matched healthy subjects without known hemoglobinopathy.
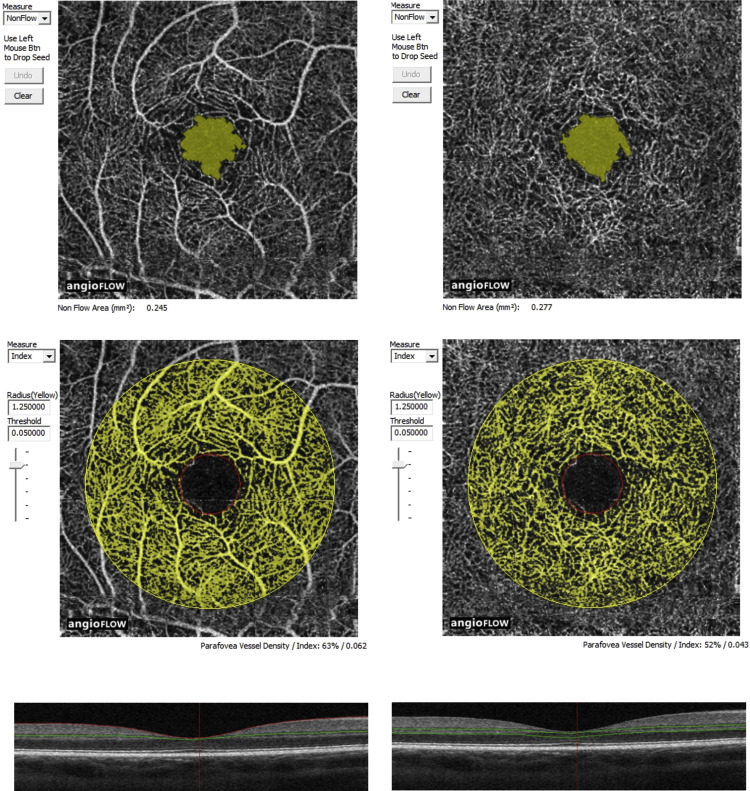
Two experienced investigators (W.M. and V.C.) analyzed FA and OCTA frames together. Sickle cell retinopathy stage was determined on FA, for each eye, based on Goldberg’s classification : stage I – peripheral arteriolar occlusions; stage II – peripheral arteriovenous anastomoses; stage III – preretinal neovascularization; stage IV – intravitreous hemorrhage; stage V – retinal detachment (tractional and/or rhegmatogenous). Qualitative abnormalities on OCTA frames were identified based on the location, shape, size, and distribution of the microvasculature of the superficial and deep capillary plexuses. The qualitative aspect of the microvasculature of the superficial and deep capillary plexuses on OCTA was compared with early- and late-phase FA frames. Several parameters were used to evaluate capillary network changes (%): areas of rarefied and dilated capillaries, enlargement of the FAZ, areas of capillary nonperfusion (presenting as hyporeflective or hypofluorescent areas), disruption of the perifoveal anastomotic capillary arcade, and capillary leakage on late FA frames. Two types of quantitative data were measured on OCTA frames: the nonflow area (in mm 2 ) corresponding to the surface of the FAZ and the perifoveal vessel density (%) corresponding to the percentage of surface occupied by capillaries in a perifoveal area defined by a 1.25-mm-diameter circle centered on the fovea with an accuracy threshold of 0.05 ( Figure 1 ). These parameters correspond to the software’s default settings, which can be changed manually. These data were measured in an automated way in both the superficial and the deep capillary plexuses (except for the perifoveal anastomotic capillary arcade, which cannot be measured accurately at the deep capillary plexus) using the AngioVue software (Optovue, Inc) and were compared to those measured in healthy, age-similar, visually normal control subjects.
Statistical analyses were conducted using Jmp version 11 (JMP Statistical Discovery; SAS, Brie Comte Robert, France) and results were calculated using the Mann-Whitney test. Data are presented as median (range) or counts (percentage). Statistical significance was set at P < .05 for all analyses.
Results
All patients were of African origin and had an electrophoretic confirmation of sickle cell disease (SS, SC, or Sβ). Eighteen eyes of 9 patients with sickle cell disease (5 SC and 4 SS) met the inclusion criteria and were enrolled in this study. Patients were 5 men and 4 women. Their median age was 41 years (range: 19–54 years). Median visual acuity of included eyes was 20/25 (range: 20/32 to 20/20). All eyes featured lesions of the retinal periphery on FA. Stages of sickle cell retinopathy were as follows: stage I in 6 eyes (33.3%), stage II in 8 eyes (44.4%) and stage III in 4 eyes (22.2%). Nine eyes of 5 normal subjects of African origin were also analyzed by OCTA and served as the control group. Subjects were 5 men and 4 women, with a median age of 38 years (range: 20–56 years).
In sickle cell disease patients, FA frames acquired with the 30-degree standard lens appeared normal, without any sign of capillary changes in the perifoveal area of the macula, in 9 of 18 eyes (50%). The 9 remaining eyes showing macular microvascular abnormalities demonstrated areas of capillary nonperfusion (2/18 eyes, 11.1%), enlargement of the FAZ (8/18 eyes, 44.4%), areas of rarefied and dilated capillaries (7/18 eyes, 38.9%), and perifoveal capillary leakage on late-phase FA frames (3/18 eyes, 16.7%) ( Figure 2 ). OCTA allowed the examination of the superficial and the deep capillary plexuses in all eyes of sickle cell disease patients. All 18 eyes presented microvascular abnormalities in the perifoveal region of the macula. The lesions recorded were rarefied and dilated capillaries (in the superficial capillary plexus: 18/18 eyes, 100%; in the deep capillary plexus: 17/18 eyes, 94.4%), enlargement of the FAZ (in both superficial and deep capillary plexuses: 18/18 eyes, 100%), areas of capillary nonperfusion (in the superficial capillary plexus: 13/18 eyes, 72.2%; in the deep capillary plexus: 5/18 eyes, 27.8%), and disruption of the perifoveal anastomotic capillary arcade (in the superficial capillary plexus: 15/18 eyes, 83.3%) ( Figures 3 and 4 ). Most capillary abnormalities were located in the temporal juxtafoveal region and could extend to the superior and inferior juxtafoveal regions.
The nonflow area was measured in 15 of 18 eyes with sickle cell disease. In 3 eyes, it was not measurable related to extensive disruption of the perifoveal anastomotic capillary arcade with poorly defined borders of the FAZ, which was not detectable by the software. The median nonflow area measured in these 15 eyes was significantly larger than in the control group in both the superficial and the deep capillary plexuses ( Figure 5 ). Comparisons between patients and controls are summarized in Table 1 . Among the 15 eyes, 6 demonstrated maculopathy in FA and 9 did not. In the 6 eyes featuring maculopathy on FA, the median nonflow area was significantly larger than in the 9 eyes without maculopathy on FA in both the superficial and the deep capillary plexuses. Comparisons between OCTA and FA findings are detailed in Table 2 .


