Purpose
To evaluate the long-term correlation of visual outcome and macular thickness after vitrectomy for idiopathic epiretinal membrane and to identify prognostic factors for good visual outcome.
Design
Retrospective, observational case series.
Methods
We reviewed the records of 52 patients with idiopathic epiretinal membrane who were treated with vitrectomy and could be followed up for more than 12 months. The main outcome measures were best-corrected visual acuity (BCVA) and central macular thickness at baseline; at 1, 3, 6, and 12 months after surgery; and at the final follow-up visit. The correlation between BCVA and central macular thickness was analyzed and the receiver operating characteristic curve analysis was performed to obtain cutoff values for visual prognosis.
Results
Most of the changes in BCVA and central macular thickness took place during the first 3 months and reached a plateau at 12 months after surgery. Despite the lack of changes in BCVA after 12 months of follow-up, significant reduction in central macular thickness could still be observed over 12 months after surgery. The final BCVA was correlated significantly with preoperative BCVA and central macular thickness and early postoperative central macular thickness. Among them, the postoperative central macular thickness at 1 month showed the largest area under the receiver operating characteristic curve.
Conclusions
Given the removal of the confounding effect of cataract, postoperative follow-up of 12 months may be sufficient to reach the final BCVA after surgery. However, more time is needed to achieve final central macular thickness. Because of the significant correlation between final BCVA and early postoperative central macular thickness, serial optical coherence tomography images in the early postoperative period were needed to predict visual outcome after epiretinal membrane removal.
Epiretinal membrane (ERM) is a common condition that may affect vision in older individuals. This disease results from the proliferation of cells along the internal limiting membrane of the macula. Visual symptoms range from mild to severe and usually are manifested by blurred vision or metamorphopsia.
Surgery for ERM has been a common vitreoretinal procedure for many years. Several studies have evaluated its clinical course, prognostic factors, and surgical outcomes. Well-known prognostic factors affecting visual outcome include preoperative visual acuity, duration of symptoms, anatomic status of macula, and the occurrence of complications.
With the introduction of optical coherence tomography (OCT), clinicians are able to evaluate the structural changes of the macula both qualitatively and quantitatively. The changes in macula measured with OCT and its correlation with visual outcome after surgery also have been reported in ERM patients. We also showed that some OCT parameters like integrity of the junction between the inner and outer segments of the photoreceptor and preoperative and postoperative macular thickness were correlated with visual outcome after ERM surgery with relatively short-term follow-up.
However, there is a lack of data demonstrating long-term temporal correlation of macular thickness and visual outcome. Pesin and associates reported long-term visual outcome and prognostic factors for up to 5 years. However, they did not include macular thickness information because OCT was not available at that time. Aso and associates showed temporal changes in macular thickness and visual outcome for up to 1 year with OCT and suggested that the approximation to the exponential curve enabled extrapolation of data to reach final retinal thickness. However, they did not show any real long-term follow-up data more than 1 year after ERM surgery. This study aimed to evaluate the long-term association between the macular thickness measured by OCT and visual outcome after vitrectomy for idiopathic ERM and to identify prognostic factors related to macular thickness for good visual outcome.
Methods
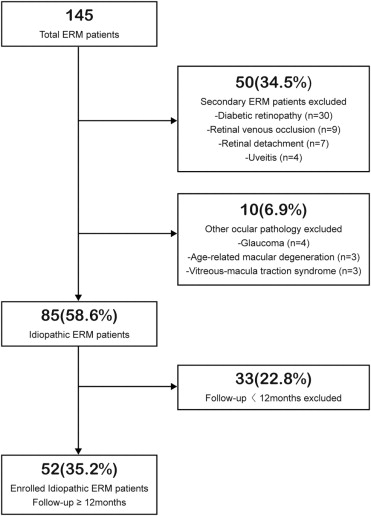
We conducted a retrospective chart review of 145 consecutive patients who had undergone pars plana vitrectomy for ERM between June 2003 and July 2008 by 2 retinal surgeons (K.H.P. and S.J.W.). Among them, 52 patients who had idiopathic ERM and were followed up for at least 12 months after surgery at Seoul National University Bundang Hospital (SNUBH) were enrolled into the study. Exclusion criteria included: (1) eyes with secondary ERM, such as diabetic retinopathy, venous occlusion, retinal detachment, uveitis, or trauma; (2) myopia of more than 6 diopters; and (3) other ocular pathologic features that could have interfered with functional results such as glaucoma or age-related macular degeneration. Details of patient selection were described in Figure 1 .
All patients underwent thorough ophthalmologic examinations, including best-corrected visual acuity (BCVA; Snellen visual acuity chart), biomicroscopy of anterior and posterior segments, indirect ophthalmoscopy, fundus photography, and OCT (Stratus OCT; Carl Zeiss Meditec, Dublin, California, USA) performed before and after operations at 3, 6, and 12 months and every 1 year thereafter.
All OCT scanning was performed by an experienced operator using the fast macular thickness protocol with 6 equally spaced 6-mm radial lines consisting of 128 A-scans per line in 1.92 seconds of scanning. The OCT operator closely monitored patient fixation, and scanning was repeated until all reasonable attempts had been made to obtain excellent fixation maintained over the entire 1.92 seconds. Each of the 6 line scans then was reviewed to determine whether some or all of the scans imaged the center of the fovea. If none of the line scans imaged the foveal center, then the scan was repeated.
The cross-sectional images were analyzed using OCT3 mapping software that used an edge detection technique to locate the strongest 2 edges in each tomogram, presumed to be at the vitreoretinal interface and the anterior surface of the retinal pigment epithelium–choriocapillaris region. Retinal thickness was measured automatically as the distance between these 2 interfaces at each measurement point along the scan’s x-axis.
We selected the retinal map analysis protocol on the OCT to reconstruct a surface map as a false-color topographic image displayed with numeric averages of the measurements for each of the 9 map sectors as defined by the Early Treatment Diabetic Retinopathy Study. Central macular thickness was defined as the average thickness in the central 1000-μm diameter of the Early Treatment Diabetic Retinopathy Study layout. Ancillary testing such as fluorescein angiography was performed before surgery on 18 eyes as needed for standard care.
Vitrectomy was conducted using the Accurus 800CS surgical system (Alcon Surgical, Fort Worth, Texas, USA) with a 20-gauge (13 eyes) vitrectomy or 23-gauge (39 eyes) transconjunctival sutureless vitrectomy. A contact lens system (Hoya Corp, Tokyo, Japan) was used during vitrectomy. Endoillumination was delivered using a xenon-based illumination system (Xenon Bright Star; DORC, Zuidland, The Netherlands). Posterior vitreous detachment was induced with active suction of ocutome over the optic disc if the posterior vitreous detachment was not already present (5 eyes). ERM peeling was carried out using end-gripping forceps (DORC, Zuidland, The Netherlands). Internal limiting membrane peeling was performed on 11 eyes. Cataract extraction was performed either during or after vitrectomy when visually significant cataract was present or developed after vitrectomy. There were no significant complications that affected the visual outcome during and after the operations such as iatrogenic macular hole, postoperative vitreous hemorrhage, retinal detachment, and endophthalmitis.
When evaluating the long-term follow-up of patients’ eyes in this study, it became apparent that analysis of visual outcome after ERM surgery might be confounded by the appearance and progression of cataracts or their removal over the course of this study. Thus, all eyes were subcategorized into the following 3 groups: (1) the vitrectomy-only group that included aphakic and pseudophakic eyes before ERM surgery and phakic eyes with no cataract appearance or progression, (2) the combined surgery group that included eyes with combined vitrectomy and cataract surgery, and (3) the sequential surgery group that included phakic eyes with worsening cataracts after vitrectomy and underwent subsequent cataract extraction during the follow-up period. A subgroup analysis was performed to alleviate the influence of cataract on visual recovery.
Continuous values were expressed as mean ± standard deviation. Visual acuities were converted to their logarithm of the minimal angle of resolution (logMAR) values for all calculations. Paired t tests were used to compare the visual acuity and macular thickness before ERM surgery with those obtained at the final examination. Correlations between the postoperative central macular thickness and BCVA were analyzed using the Pearson correlation test. A linear regression model was used to determine which preoperative or intraoperative factors were associated with final BCVA after ERM surgery. Statistical analysis was performed using GraphPad Prism software version 5.0 (GraphPad Software, San Diego, California, USA), except for the receiver operating characteristic (ROC) curve analysis. P values of less than .05 were considered statistically significant.
ROC curve analysis was performed to obtain critical values (cutoff values) that would allow the prediction of visual prognosis. Specifically, we tried to obtain the critical or cutoff value of the preoperative BCVA and central macular thickness, postoperative central macular thickness at 1 month and 3 months (parameters that correlated significantly with final BCVA) for the prediction of a good visual result after treatment. Good visual prognosis was defined arbitrarily as final BCVA of 20/25 or better. All ROC curve analyses, including graphics, were performed using the MedCalc software statistical package software version 9.6.2.0 (MedCalc Software, Mariakerke, Belgium).
Results
Baseline Demographics and Clinical Characteristics
Table 1 shows the patients’ baseline demographics and clinical characteristics.
| Patient features | |
| Age at surgery (yrs), mean ± SD | 65.0 ± 6.2 |
| No. of women (%) | 41 (79%) |
| Follow-up (mos) | 27.0 ± 14.0 |
| Underlying disease, n (%) | |
| Diabetes mellitus | 7 (13%) |
| Hypertension | 21 (40%) |
| Eye factors | |
| Symptoms, n (%) | |
| Blurred vision | 29 (56%) |
| Metamorphopsia | 6 (10%) |
| Duration (mos), mean ± SD | 12.3 ± 12.0 |
| BCVA (Snellen equivalent), n (%) | |
| 20/20 or better | 0 (0%) |
| 20/25 to 20/40 | 14 (27%) |
| 20/50 to 20/100 | 33 (63%) |
| Worse than 20/100 | 5 (10%) |
| Mean ± SD (Snellen equivalent) | 20/61 ± 2.6 lines |
| Lens status, n (%) | |
| Phakic | 49 (94%) |
| Pseudophakic | 3 (6%) |
| Aphakic | 0 (0%) |
| Central macular thickness (OCT), n (%), μm | |
| <225 | 0 (0%) |
| 225 to 299 | 4 (8%) |
| 300 to 399 | 18 (35%) |
| 400 to 499 | 13 (25%) |
| ≥500 | 17 (33%) |
| Mean ± SD (μm) | 438 ± 101 |
Temporal Change of Visual Acuity and Macular Thickness after Epiretinal Membrane Surgery
The mean BCVA (logMAR) improved significantly from 0.49 ± 0.23 before surgery to 0.15 ± 0.19 at the final follow-up visit ( P = .000, paired t test; Figure 2 ). The mean improvement of BCVA was 0.35, and this improvement occurred up to 24 months after vitrectomy ( Table 2 ). BCVA improved by 0.2 logMAR units or more in 36 eyes (69%) and within 0.2 logMAR units of preoperative BCVA in 15 eyes (29%; Table 2 ). Visual improvement was achieved in all eyes except 1 patient, in whom there was a decrease in visual acuity as a result of retinal pigment epithelial atrophy.
| Follow-up (months) | No. of Patients | BCVA (logMAR) | OCT Available (n) | CMT (μm) | ||||||
|---|---|---|---|---|---|---|---|---|---|---|
| Mean Improvement | ≥0.2 Improved, n (%) | Within 0.2 Improved, n (%) | ≥0.2 Worse, n (%) | Mean Change | <299, n (%) | 300 to 399, n (%) | ≥400, n (%) | |||
| 12 | 52 | 0.24 | 36 (69) | 11 (21) | 5 (10) | 42 | −137 | 21 (50) | 19 (45) | 2 (5) |
| 24 | 27 | 0.32 | 20 (74) | 5 (19) | 2 (7) | 26 | −141 | 15 (58) | 10 (38) | 1 (4) |
| 36 | 14 | 0.33 | 12 (86) | 1 (7) | 1 (7) | 10 | −144 | 5 (50) | 5 (50) | 0 (0) |
| 48 | 7 | 0.38 | 7 (100) | 0 (0) | 0 (0) | 4 | −140 | 3 (75) | 1 (25) | 0 (0) |
| Final a | 52 | 0.36 | 36 (69) | 15 (29) | 1 (2) | 52 | −146 | 31 (60) | 20 (38) | 1 (2) |
a Depending on the follow-up periods of the patients (range, 12 to 65 months).
The mean final CMT of 292 ± 60 μm was significantly thinner than the mean preoperative CMT of 438 ± 101 μm ( P = .000, paired t test; Figure 3 ). The mean change of CMT was 146 μm. The final CMT was less than 299 μm in 31 eyes (60%), 300 to 399 μm in 20 eyes (38%), and 400 μm or more in only 1 eye (2%; Table 2 ).
Effect of Cataract on Visual Recovery
To reveal the effect of cataract on visual recovery, we compared the patterns of visual recovery between the total patients and the patients without sequential surgery group. There was a marked discrepancy in visual recovery between the analyses ( Figure 2 ). Before the removal of cataract effect on visual recovery, the patterns of visual recovery and central macular thickness reduction were different. However, after the removal of cataract effect, the recovery patterns of vision and central macular thickness became quite similar ( Figures 2 and 3 ).
Further subgroup analysis also showed significant effect of cataract development on visual recovery. The BCVA improved progressively in the vitrectomy-only group and the combined surgery group. However, the sequential surgery group did not show the initial visual improvement resulting from cataract appearance or progression, and visual improvement occurred only after the cataract extraction ( Figure 4 ).
Temporal Correlation between Visual Acuity and Macular Thickness after Epiretinal Membrane Surgery
BCVA improved rapidly (78% of total change after surgery) until 3 months after ERM surgery and stabilized at 12 months after surgery in patients, when excluding the sequential surgery group from the analysis ( Figure 2 , unbroken line). The central macular thickness also had decreased rapidly (78% of total change after surgery) until 3 months after surgery and gradually decreased thereafter ( Figure 3 ). The changes in BCVA and central macular thickness followed a similar course after removal of cataract effect ( Figure 2 and 3 ). However, the central macular thickness decreased more rapidly at 1 month after surgery and the reduction of central macular thickness continued until the final follow-up ( Figure 5 ). The difference in central macular thickness 12 months after surgery from final follow-up was statistically significant ( P = .019, paired t test).
Although the degree of correlation between BCVA and central macular thickness at each follow-up was quite variable in total patients, we observed that preoperative central macular thickness and postoperative central macular thickness at 1 month, 3 months, 12 months, and 36 months were correlated significantly with final BCVA ( r = 0.318, 0.522, 0.505, 0.401, and 0.743; P = .022, .000, .000, .008, and .009, respectively; Table 3 ).
| BCVA pre | BCVA 1mo | BCVA 3mo | BCVA 6mo | BCVA 12mo | BCVA 24mo a | BCVA 36mo b | BCVA final | |
|---|---|---|---|---|---|---|---|---|
| CMT pre |
|
|
|
|
|
|
|
|
| CMT 1mo |
|
|
|
|
|
|
| |
| CMT 3mo |
|
|
|
|
|
| ||
| CMT 6mo |
|
|
|
|
| |||
| CMT 12mo |
|
|
|
| ||||
| CMT 24mo a |
|
|
| |||||
| CMT 36mo b |
|
| ||||||
| CMT final |
|
Stay updated, free articles. Join our Telegram channel

Full access? Get Clinical Tree


