Purpose
To evaluate the impact of full correction vs undercorrection on the magnitude of the myopic shift and postoperative visual acuity after unilateral intraocular lens (IOL) implantation in children.
Design
Retrospective case control study.
Methods
The medical records of 24 children who underwent unilateral cataract surgery and IOL implantation at 2 to <6 years of age were reviewed. The patients were divided into 2 groups based on their 1-month-postoperative refraction: Group 1 (full correction) −1.0 to +1.0 diopter (D) and Group 2 (undercorrection) ≥+2.0 D. The main outcome measures included the change in refractive error per year and visual acuity for the pseudophakic eyes at last follow-up visit. The groups were compared using the independent groups t test and Wilcoxon rank sum test.
Results
The mean age at surgery (Group 1, 4.2 ± 0.9 years, n = 12; Group 2, 4.5 ± 1.0 years, n = 12; P = .45) and mean follow-up (Group 1, 5.8 ± 3.7 years; Group 2, 6.1 ± 3.5 years; P = .69) were similar for the 2 groups. The change in refractive error (Group 1, −0.4 ± 0.5 D/y; Group 2, −0.3 ± 0.2 D/y; P = .70) and last median logMAR acuity (Group 1, 0.4; Group 2, 0.4; P = .54) were not significantly different between the 2 groups.
Conclusions
We did not find a significant difference in the myopic shift or the postoperative visual acuity in children aged 2 to <6 years of age following unilateral cataract surgery and IOL implantation if the initial postoperative refractive error was near emmetropia or undercorrected by 2 diopters or more.
Intraocular lens (IOL) implantation is currently the preferred means of optically rehabilitating children 2 years of age or older undergoing cataract surgery. However, there is no consensus regarding the optimal initial postoperative refractive goal for children undergoing IOL implantation. Some surgeons recommend undercorrection whereas others recommend full correction.
The myopic shift that occurs in pediatric pseudophakic eyes is largely attributable to axial elongation. The eyes of most children continue to experience some axial elongation throughout childhood, although the magnitude of this change decreases dramatically after infancy. For this reason, some clinicians favor implanting an IOL in young children that initially targets emmetropia because they are concerned that the child may not wear an overrefraction postoperatively, which may result in the child’s developing or having a worsening of his or her amblyopia. They also believe that it is impossible to accurately predict how much the refractive error will change over time in these eyes and they have noted that some of these eyes only undergo a minimal myopic shift. Other clinicians favor targeting these children for an initial undercorrection and then correcting their residual refractive error with spectacles. They argue that most of these children will undergo a sizeable myopic shift in their pseudophakic eyes and so by initially undercorrecting them they will have a lower refractive error in these eyes when they are older. As a result, these patients may be less dependent on a spectacle or contact lens overrefraction later in life. In addition, the reduced anisometropia in these children as their pseudophakic eye undergoes axial elongation and approaches emmetropia may improve their stereopsis and result in less aniseikonia later in life.
We performed a retrospective analysis from 2 institutions to determine if the initial postoperative correction in children 2 to <6 years of age undergoing unilateral cataract surgery and IOL implantation affected the magnitude of the myopic shift and the visual outcome in these eyes.
Methods
A retrospective medical record review was performed for children from 2 institutions who had undergone unilateral cataract surgery and IOL implantation when 2 to <6 years of age and who had an initial postoperative refractive error of −1.0 to +1.0 diopter (D) (Group 1) or an undercorrection of ≥2.0 D (Group 2). Only children who had been followed after cataract surgery for ≥18 months and who had their visual acuity assessed when ≥7 years of age were included in the analysis. Patients with traumatic cataracts were excluded.
IOL power was calculated using axial lengths obtained from ultrasonography or partial coherence interferometry and keratometry readings. All of the patients were prescribed spectacles following IOL implantation. Patching compliance was rated as excellent, good, fair, poor, or not recorded. Visual acuity was assessed using a Snellen eye chart.
The outcome variables that were analyzed for both Groups 1 and 2 (pseudophakic and fellow eyes) included the refraction closest to 1 month after IOL implantation and the refraction at the last examination, the change in refraction and the change in refraction per year (D/y), the adjusted rate of refractive growth (RRG2), and the last visual acuity (logMAR). All refractions are expressed in spherical equivalents. The characteristics of the 2 groups were compared using the independent groups t test and outcome measures, except for changes in refractive error per year, which were compared using the Wilcoxon rank sum test. Refraction predictions using each of the 2 current descriptions of the pseudophakic refractive growth curve were also compared to the actual last refractions of the combined cohort. Finally, we compared the change in refraction and the change in refraction per year between the pseudophakic eyes and the fellow eyes using a paired t test.
Results
Twenty-four patients were studied, 12 patients in each group (Institution 1 enrolled 5 patients in Group 1 and 6 patients in Group 2; Institution 2 enrolled 7 patients in Group 1 and 6 patients in Group 2). The mean age at surgery for both groups and the mean postoperative follow-up intervals for Group 1 were similar for the 2 groups ( P = .48 and P = .82 respectively) ( Table 1 ).
| Characteristic | Initial Postoperative Refraction (D) | P Value b | 95% CI for Difference Between Groups c | |||
|---|---|---|---|---|---|---|
| −1 to +1 (n = 12) | ≥+2 (n = 12) | |||||
| Mean (SD) a | Range | Mean (SD) | Range | |||
| Age at surgery (y) | 4.2 (0.9) | 2.5 – 5.9 | 4.5 (1.0) | 2.3 – 5.7 | .43 | −1.1 – 0.5 |
| Age at initial postoperative refraction (y) | 4.3 (0.9) | 2.6 – 6.1 | 4.6 (1.0) | 2.3 – 5.8 | .48 | −1.1 – 0.5 |
| Age at last refraction (y) | 10.0 (4.1) | 5.7 – 19.4 | 10.7 (3.8) | 4.0 – 17.8 | .69 | −4.0 – 2.7 |
| Duration of follow-up (y) | 5.8 (3.7) | 2.0 – 13.5 | 6.1 (3.5) | 1.7 – 12.9 | .82 | −3.3 – 2.7 |
| Treated Eye | ||||||
| Initial postoperative refraction (D) | −0.1 (0.6) | −1.0 – 1.0 | 3.3 (0.9) | 2.0 – 5.5 | ||
| Last refraction (D) | −2.0 (1.7) | −4.5 – 1.1 | 1.3 (1.6) | −1.8 – 3.6 | ||
| Change in refraction (D) | −1.9 (1.7) | −5.0 – 0.6 | −2.0 (1.6) | −5.5 – 0.4 | .88 | −1.3 – 1.5 |
| Change in refraction per year (D/y) | −0.4 (0.5) | −1.6 – 0.2 | −0.3 (0.2) | −0.7 – 0.1 | .70 | −0.4 – 0.2 |
| Last visual acuity (logMAR) | 0.4 (0.3, 0.5) | 0.1 – 1.0 | 0.4 (0.3, 1.3) | 0 – 1.3 | .54 | −0.8 – 0.2 |
| Fellow Eye | ||||||
| Initial postoperative refraction (D) | 0.5 (2.6) | −4.8 – 6.5 | 1.7 (2.0) | −0.5 – 6.5 | .24 | −3.1 – 0.8 |
| Last refraction (D) | −0.7 (2.0) | −4.0 – 3.0 | 0.6 (1.6) | −2.1 – 3.3 | .08 | −2.9 – 0.2 |
| Change in refraction (D) | −1.3 (2.0) | −6.3 – 1.1 | −1.1 (2.1) | −6.8 – 1.4 | .83 | −1.9 – 1.6 |
| Change in refraction per year (D/y) | −0.3 (0.4) | −1.2 – 0.4 | −0.04 (0.3) | −0.5 – 0.8 | .15 | −0.5 – 0.1 |
| Anisometropia d | ||||||
| At initial postoperative visit (D) | −0.7 (2.7) | −7.3 – 4.6 | 1.6 (1.2) | −1.0 – 3.1 | .02 | −4.1 – 0.5 |
| At last visit (D) | −1.3 (1.9) | −4.8 – 1.8 | 0.7 (0.9) | −0.6 – 1.9 | .005 | −3.3 – 0.7 |
a The values are mean (standard deviation) except for last visual acuity, where the values are median (quartiles).
b P value for the independent groups t test, except for last visual acuity, for which the Wilcoxon rank sum test was used.
c The 95% confidence interval for the difference of the means between the initial refraction groups ([−1 to +1] – [≥+2]) except for last visual acuity, where the confidence interval is for the difference of the medians.
d Anisometropia was calculated as the refraction in the treated eye minus the refraction in the fellow eye.
The age of onset of the cataracts was largely unknown, although 2 patients had posterior lentiglobus, which is usually acquired, and 3 patients had types of cataracts that are usually congenital (persistent fetal vasculature, zonular, and anterior polar). Both the anterior polar and persistent fetal vasculature cataracts were documented to progress over time prior to being removed surgically. Different patching regimens were prescribed for individual patients based on considerations such as the age of the patient and degree of amblyopia: 0 hours/day (n = 5), 1 to 2 hours/day (n = 1), 3 to 7 hours/day (n = 7), and ≥8 hours/day (n = 5). The patching regimen prescribed was not recorded in the medical record for 6 patients. Patching compliance was rated as excellent (n = 5), good (n = 2), fair (n = 6), and poor (n = 1). Patching compliance was not documented in the medical record for the remaining 10 patients.
Eight of the patients developed a visual axial opacity and underwent one additional intraocular surgery to clear the visual axis. One patient had a late wound dehiscence that was repaired surgically.
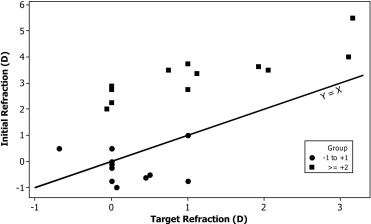
Figure 1 shows the targeted refraction compared to the initial refraction. The targeted refractive error was: plano (n = 12), +0.5 D (n = 2), +0.7 D (n = 1), +1.0 D (n = 5), +2.0 D (n = 2), and +3.0 D (n = 2). The absolute prediction error was 1.4 ± 0.9 D.
At the postoperative refraction performed closest to 1 month after cataract surgery (Group 1, 35 ± 28 days; Group 2, 22 ± 14 days; P = .17), there was a 3.4-D difference between the mean refractive errors for the pseudophakic eyes in the 2 groups compared to a 3.3-D difference at the last follow-up. At the first postoperative refraction, there was more anisometropia (treated eye minus fellow eye) in Group 2 (Group 1, −0.7 ± 2.7 D; Group 2, 1.6 ± 1.2 D), whereas at the last follow-up, there was more anisometropia in Group 1 (Group 1, −1.3 ± 1.9 D; Group 2, 0.7 ± 0.9 D).
Figure 2 plots the myopic shift of individual patients between the initial and final refraction. The mean myopic shift for the pseudophakic eyes was nearly the same in both groups (Group 1, −1.9 ± 1.7 D; Group 2, −2.0 ± 1.6 D; P = .88). The mean change in refractive error per year for the pseudophakic eyes was also similar for both groups (Group 1, −0.4 ± 0.5 D/y; Group 2, −0.3 ± 0.2 D/y; P = .70). However, the power was only 0.32 to detect a 1.0-D difference between the means for the change in the refractive error of the 2 groups with probability of a type I error = .05 (2-sided) with the sample sizes and standard deviations observed using the independent groups t test.
The mean RRG2 for the pseudophakic eyes in both groups was similar (Group 1, −4.7 ± 4.9; range, −16.9 to +1.8; Group 2, −4.5 ± 2.7; range, −9.0 to −1.0; P = .90). However, the mean RRG2 for the entire cohort was significantly different ( P = .03) from the RRG2 value (−6.4) reported by McClatchey and Hofmeister for pseudophakic patients operated after 6 months of age. Predictions of the final refraction using their RRG2 logarithmic model were on average 0.7 D more myopic than the last refractive errors we observed in our entire cohort. Predictions based on the pseudophakic refraction curve from Superstein and associates were on average 0.8 D more hyperopic than the refractions we observed.
While the mean refractive errors of the fellow eyes were less hyperopic in Group 1 compared to Group 2 at the initial refraction and at the last refraction, the difference was not statistically significant ( Table 1 ). The mean change in refractive error of the fellow eyes was nearly identical in both groups, as was the mean change in refractive error per year.
When we compared all of the pseudophakic eyes to all of the fellow eyes, the mean change of the refractive error per year was statistically greater in the treated eyes (−0.4 ± 0.3 D/y) than the fellow eyes (−0.1 ± 0.4 D/y) ( P = .026) ( Table 2 ).
| Characteristic | Treated Eyes | Fellow Eyes | P Value a | 95% CI for Difference Between Groups b | ||
|---|---|---|---|---|---|---|
| Mean (SD) | Range | Mean (SD) | Range | |||
| Change in refraction (D) | −1.9 (1.6) | −5.5 – 0.6 | −1.1 (2.0) | −6.8 – 1.4 | .052 | −1.7 – 0.01 |
| Change in refraction per year (D/y) | −0.4 (0.3) | −1.6 – 0.2 | −0.1 (0.4) | −1.2 – 0.8 | .026 | −0.4 – -0.03 |
a P value for the paired t test.
b 95% confidence for the difference between the means of treated and fellow eyes (treated – fellow).
Stay updated, free articles. Join our Telegram channel

Full access? Get Clinical Tree


