Purpose
To investigate the rate of progressive visual field (VF) loss and associated factors for structural or functional progression in preperimetric open-angle glaucoma (OAG).
Design
Longitudinal, observational study.
Methods
We included 127 eyes of 127 preperimetric OAG patients who were treated with topical medication and followed for more than 5 years. All patients underwent stereo optic disc photography, red-free retinal nerve fiber layer (RNFL) photography, frequency doubling technology perimetry, and standard automated perimetry (SAP). Progression was defined as a structural (glaucomatous change confirmed by stereo optic disc and red-free RNFL photography) or functional (new glaucomatous defect on SAP) deterioration. The progression rate of SAP mean deviation (dB/year) and factors associated with progression were evaluated.
Results
Glaucoma progression was detected in 72 of 127 eyes (56.7%). Mean rate of VF progression was −0.39 ± 0.64 dB/year in all patients; −0.66 ± 0.60 dB/year in progressors and −0.03 ± 0.24 dB/year in nonprogressors. A multivariate Cox proportional hazard model revealed that optic disc hemorrhage (hazard ratio [HR] = 1.718, P = .031) and the percentage reduction in intraocular pressure (IOP; HR = 0.964, P = .002) were significantly associated with disease progression. Patients with disc hemorrhage had a greater cumulative probability of progression than those without disc hemorrhage ( P = .014 by log-rank test).
Conclusions
Our results support the importance of lowering IOP, even at the preperimetric stage. Preperimetric glaucoma patients with disc hemorrhage and insufficient IOP control should be carefully monitored for greater risk of progression.
Preperimetric glaucoma is defined as the presence of characteristic glaucomatous optic disc and nerve fiber layer damage in the absence of visual field (VF) defects on conventional achromatic automated perimetry. Since functional damage is not apparent in preperimetric glaucoma, the decision to initiate therapy needs to be determined on an individual basis, considering each patient’s benefit-to-risk ratio.
Previous studies have supported the protective role of lowering intraocular pressure (IOP) in glaucoma patients with a wide spectrum of disease severity. The Ocular Hypertension Treatment Study demonstrated that the cumulative probability of developing glaucoma was reduced by 60% in the medication group compared to the observation group. The Early Manifest Glaucoma Trial also showed considerable beneficial effects of treatment, including significantly delayed glaucoma progression. The Collaborative Normal-Tension Glaucoma Study reported that lowering IOP reduces clinically manifested glaucoma progression from 27% to 12%. The Advanced Glaucoma Intervention Study also reported the association between maintaining IOP less than 18 mm Hg and reduced VF defects progression.
Based on these studies, IOP reduction is expected to preserve vision, even in preperimetric glaucoma patients. However, less is known about the extent of the benefits of lowering IOP in preperimetric open-angle glaucoma (OAG) patients. Additionally, our knowledge of factors associated with progression in these patients is limited. In this regard, identifying progression rates and treatment outcome in preperimetric glaucoma would give clinicians a basis for when to initiate IOP-lowering treatments in these patients.
The purpose of our study was to investigate the rate of VF changes over the long term (at least 5 years) in preperimetric OAG patients undergoing treatment. In addition, potential systemic and ocular characteristics were compared between progressors and nonprogressors to identify factors associated with structural or functional glaucoma progression.
Methods
Patients who had been newly diagnosed with preperimetric OAG at the Glaucoma Clinic of Seoul National University Hospital between January 2005 and December 2007 were consecutively included in this retrospective observational cohort. All patients were followed for at least 5 years after the initial visit. Study conduct adhered to the tenets of the Declaration of Helsinki and the study protocol was approved by the institutional review board of Seoul National University Hospital.
Inclusion criteria were: (1) preperimetric OAG diagnosis in 1 or both eyes at the first clinic visit, (2) no history of IOP-lowering treatment use, (3) attended follow-up visits every 6 months for at least 5 years, and (4) treated with only topical medications during the follow-up period. In addition, patients had to have a best-corrected visual acuity better than 20/40, a spherical equivalent within ±5.0 diopters, a cylindrical correction of less than 3.0 diopters, an open anterior chamber angle at the initial examination, good-quality stereo optic disc photography and red-free retinal nerve fiber layer (RNFL) photography images, and reliable VF testing results (fixation loss <20%, false-positive errors <15%, and false-negative errors <15%). For cases in which both eyes met all eligibility criteria, 1 eye was randomly chosen as the study eye before analyses. Patients were excluded if any of the following were present: manifest glaucoma, optic neuropathy, history of ocular surgery (other than uncomplicated cataract surgery), or any other systemic or ocular pathology known to affect the optic disc, RNFL, or VF (eg, retinal vascular occlusive disease, diabetic retinopathy, hypertensive retinopathy, uveitis).
All patients underwent full ophthalmic examinations, including measurement of best-corrected visual acuity and spherical equivalent by autorefractor (KR-890; Topcon Corporation, Tokyo, Japan). A slit-lamp examination, anterior chamber angle gonioscopy, dilated fundus examination, and corneal pachymetry (Pocket II Pachymeter Echo graph; Quantel Medical, Clermont-Ferrand, France) were also performed. A Goldmann applanation tonometer was used to measure IOP at baseline (prior to beginning topical therapies) and at every follow-up visit. For baseline IOP, the average of diurnal IOP measured at 8:30 AM, 10:00 AM, 11:30 AM, 1:00 PM, 2:30 PM, and 4:00 PM was used. At the baseline examination, all patients were also evaluated with color stereo optic disc photography, red-free RNFL photography (Vx-10; Kowa Optimed, Tokyo, Japan), frequency doubling technology (FDT) perimetry (Matrix Frequency Doubling Perimeter; Carl Zeiss Meditec Inc, Dublin, California, USA), and standard automated perimetry (SAP; 30-2 Swedish interactive threshold algorithm; Carl Zeiss Meditec Inc). All patients attended regular follow-up visits 6 months apart, at which time patients underwent clinical examination, stereo disc photography, red-free RNFL photography, and SAP. All patients were treated for glaucoma at the discretion of the attending ophthalmologist (D.M.K.), who aimed to reduce baseline IOP by at least 20%. When this was not accomplished, further treatment decisions were made by the treating physician.
The preperimetric OAG diagnosis was given to patients with a glaucomatous optic disc appearance (eg, neuroretinal rim thinning, notching, excavation) and/or RNFL defects, as confirmed on stereo disc and RNFL photography. All disc and RNFL photography images were evaluated by 2 glaucoma specialists (K.E.K., J.W.J.) in a masked fashion. Discrepancies between observers were resolved by consensus or adjudication by a third glaucoma specialist (D.M.K). Patients should have a normal VF on conventional SAP at the initial examination, regardless of the presence or absence of baseline FDT perimetry abnormalities. Baseline FDT perimetry and SAP were performed within 2 weeks of each other. Normal FDT perimetry and SAP results were defined as mean deviation (MD) and pattern standard deviation (PSD) within the 95% confidence limits and a glaucoma hemifield test result within normal limits. Glaucomatous defects in FDT perimetry were defined as a cluster of 2 or more points in the pattern deviation probability plot with P < 5%, a PSD of P < 5%, or a glaucoma hemifield test result outside normal limits.
Determination of Glaucoma Progression
Color stereo disc photography, red-free RNFL photography, and SAP were performed and assessed at each regular follow-up visit. Structural changes on disc and RNFL photography and functional changes on SAP determined the patient’s progression status, as described below. The time at which structural and/or functional deterioration was first confirmed by stereo disc photography, red-free RNFL photography, or SAP was defined as the progression endpoint.
Progressive optic disc changes (ie, focal or diffuse narrowing, neuroretinal rim notching, increased cup-to-disc ratio, adjacent vasculature position shift) were determined by comparing serial stereo disc photography images and were regarded as glaucomatous progression. Changes in an RNFL defect (determined with serial RNFL photography), defined as the appearance of a new defect or an increase in width or depth of an existing defect, were regarded as structural progression. Two observers (K.E.K., J.W.J.), who were masked to all other patient information, independently evaluated all photographs. Each patient was classified as a structural nonprogressor or progressor based on disc and RNFL photography image interpretation. In cases of disagreement, a third glaucoma specialist (D.M.K.) served as an adjudicator.
Patients were classified as having functional progression if new and reproducible glaucomatous VF defects, corresponding to structural damage, were found on SAP. A glaucomatous VF defect was defined as (1) presence of 3 or more non-edge points with a probability of being normal of P < 5%, and 1 of these points having a pattern deviation of P < 1%; (2) a PSD of P < 5%; or (3) a glaucoma hemifield test result outside normal limits. Visual field tests were repeated within a month to confirm functional progression after detection of a new glaucomatous VF defect. Serial VFs were also evaluated by 2 independent observers (K.E.K., J.W.J.) in a masked fashion.
Statistical Analyses
Clinical characteristics between progressors and nonprogressors were compared with Student t tests for continuous variables and χ 2 or Fisher exact tests for categorical variables. Patients treated with more than 1 drug were counted multiple times, according to the number of drugs used. Mean follow-up IOP was defined as the average value of all IOPs measured within a 6-month follow-up interval. The percentage reduction in IOP was defined as 100 × (baseline IOP–mean follow-up IOP)/baseline IOP. Interobserver agreement in evaluating structural or functional progression was assessed by Kappa (κ) statistics. The strength of agreement was categorized according to the method of Landis and Koch, which uses the following classifications: 0 = poor, 0–0.20 = slight, 0.21–0.40 = fair, 0.41–0.60 = moderate, 0.61–0.80 = substantial, and 0.81–1.00 = almost perfect. Univariate and multivariate Cox proportional hazards regression models were used to identify associated factors for structural and functional progression. A forward step conditional method was used to develop the final multivariate model and adjusted hazard ratios (HRs) with 95% confidence interval (CI) were calculated. A Kaplan-Meier survival analysis was used to compare the cumulative probability of developing structural or functional progression between groups, stratified by significantly associated factors. The first time either structural or functional deterioration was found was regarded as the endpoint in survival analyses. Linear regression analysis was used to determine functional progression rates and to examine potential associations between IOP reduction and VF progression rate. In consideration of the posttreatment stabilization period, VFs performed less than 6 months after treatment initiation were excluded from analyses. A cut-off value for the percentage of IOP reduction from baseline was calculated by measuring the area under the receiver operating characteristic curve (AUC). All statistical analyses were performed using SPSS version 21.0 for Windows (IBM Corp, Armonk, New York, USA). Statistical significance was defined as a P value of <.05.
Results
A total of 166 consecutive patients were diagnosed with preperimetric OAG between 2005 and 2007. Twenty-one untreated patients, 10 patients with an insufficient follow-up period, 5 patients with poor-quality stereo disc photography and/or red-free RNFL photography, and 3 patients with unreliable VF results were excluded from analyses. Ultimately, 127 eyes of 127 patients with preperimetric OAG were included in analyses. Mean age of the 127 included patients was 54.5 ± 13.7 years and mean follow-up duration was 5.8 ± 0.6 years. Baseline and mean follow-up IOP were 16.5 ± 3.2 mm Hg and 12.2 ± 2.0 mm Hg, respectively, with an average IOP reduction from baseline of 25.0 ± 9.5%. The interobserver agreement on structural and functional progression was excellent ( κ = 0.900). Six cases had observer disagreement on structural evaluation and no case had a disagreement on functional evaluation. For the 6 cases with disagreement, the third adjudicator classified the patients as 2 nonprogressors and 4 progressors.
Demographic and Clinical Characteristics of Nonprogressors and Progressors
The demographics and baseline characteristics of nonprogressors and progressors are summarized in Table 1 . Of the 127 patients included, 72 patients (56.7%) were classified as progressors. Sixty of 72 progressors (83.3%) had optic disc and/or RNFL changes, 29 (40.3%) had VF deterioration, and 17 (23.6%) had both structural and functional glaucoma progression.
| Nonprogressors (n = 55, 43.3%) | Progressors (n = 72, 56.7%) | P a | |
|---|---|---|---|
| Baseline factors | |||
| Age (y) | 53.3 ± 12.6 | 55.5 ± 14.5 | .384 |
| Male, n (%) | 28 (50.9) | 23 (31.9) | .031 b |
| Follow-up duration (mo) | 67.2 ± 7.5 | 69.7 ± 9.0 | .078 |
| Systemic factors | |||
| Diabetes mellitus, n (%) | 3 (5.5) | 4 (5.6) | .980 |
| Hypertension, n (%) | 18 (32.7) | 16 (22.2) | .185 |
| Cardiovascular disease, n (%) | 2 (3.6) | 2 (2.8) | .784 |
| Cold hands/feet, n (%) | 1 (1.8) | 12 (16.7) | .006 b |
| Migraine, n (%) | 1 (1.8) | 1 (1.4) | .847 |
| Family history, n (%) | 3 (5.5) | 5 (6.9) | .732 |
| Ocular factors | |||
| Spherical equivalent (diopters) | −1.68 ± 2.48 | −1.65 ± 3.00 | .965 |
| Central corneal thickness (μm) | 528.6 ± 36.7 | 513.4 ± 79.4 | .258 |
| Baseline vertical cup-to-disc ratio | 0.57 ± 0.09 | 0.59 ± 0.05 | .189 |
| Optic disc hemorrhage, n (%) | 9 (16.4) | 30 (41.7) | .002 b |
| Intraocular pressure | |||
| Baseline IOP (mm Hg) | 17.0 ± 3.6 | 16.1 ± 2.9 | .109 |
| IOP with medication | |||
| Mean follow-up IOP (mm Hg) | 12.1 ± 2.2 | 12.3 ± 1.9 | .600 |
| Peak follow-up IOP (mm Hg) | 14.7 ± 1.8 | 14.2 ± 2.1 | .186 |
| Percentage reduction in IOP (%) | 27.9 ± 10.0 | 22.8 ± 9.0 | .003 b |
| Visual field examination | |||
| FDT perimetry abnormality, n (%) | 13 (23.6) | 34 (47.2) | .006 b |
| FDT perimetry MD (dB) | −1.98 ± 2.54 | −2.92 ± 2.39 | .055 |
| FDT perimetry PSD (dB) | 3.39 ± 0.73 | 3.62 ± 0.90 | .184 |
| SAP MD (dB) | −0.55 ± 1.32 | −0.62 ± 1.33 | .757 |
| SAP PSD (dB) | 1.88 ± 0.49 | 1.97 ± 0.58 | .371 |
a Comparison was performed using Student t tests for continuous variables and χ 2 or Fisher exact tests for categorical variables.
Statistically significant differences were found between progressors and nonprogressors in sex distribution, self-declared cold hands/feet, optic disc hemorrhage, percent IOP reduction from baseline, and baseline FDT perimetry abnormality. No significant differences were found between progressors and nonprogressors in age, follow-up duration, spherical equivalent, central corneal thickness, baseline vertical cup-to-disc ratio, baseline IOP, mean follow-up IOP, peak follow-up IOP, or baseline FDT perimetry indices or SAP indices (MD and PSD).
Sixty-two preperimetric OAG patients were treated with prostaglandin analogues, 54 with beta blockers, 36 with carbonic anhydrase inhibitors, 11 with adrenergic agonists, and 28 with fixed-combination drugs. No significant differences were found between progressors and nonprogressors in the distribution of IOP-lowering medications used ( P = .457, χ 2 test).
Factors Associated With Glaucoma Progression
By using a univariate Cox proportional hazard model, 5 factors were found to be significantly associated with progression, as described in Table 2 . Four predictive factors for progression were female sex (HR = 1.642, 95% CI: 1.000–2.697, P = .049), self-declared cold hands/feet (HR = 2.172, 95% CI: 1.167–4.042, P = .014), optic disc hemorrhage (HR = 2.001, 95% CI: 1.251–3.200, P = .004), and abnormal baseline FDT perimetry (HR = 1.821, 95% CI: 1.146–2.894, P = .011). A higher percentage reduction in IOP was protective against progression (HR = 0.964, 95% CI: 0.942–0.987, P = .002). A multivariate Cox proportional hazard model revealed that optic disc hemorrhage (HR = 1.718, 95% CI: 1.051–2.809, P = .031) and a lower percentage reduction in IOP (HR = 0.964, 95% CI: 0.942–0.987, P = .002) were significantly associated with progression ( Table 3 ).
| Hazard Ratio (95% CI) | P | |
|---|---|---|
| Female sex | 1.642 (1.000–2.697) | .049 |
| Cold hands/feet | 2.172 (1.167–4.042) | .014 |
| Optic disc hemorrhage | 2.001 (1.251–3.200) | .004 |
| Percentage reduction in IOP | 0.964 (0.942–0.987) | .002 |
| FDT perimetry abnormality | 1.821 (1.146–2.894) | .011 |
| Hazard Ratio (95% CI) | P | |
|---|---|---|
| Optic disc hemorrhage | 1.718 (1.051–2.809) | .031 |
| Percentage reduction in IOP | 0.964 (0.942–0.987) | .002 |
Thirty-nine of 127 patients had disc hemorrhage, 30 of whom (76.9%) had disease progression. Among the 30 progressors with disc hemorrhage, all had structural progression and 12 (40%) had concomitant functional progression. Kaplan-Meier survival analysis revealed that patients without disc hemorrhage had a greater cumulative probability of nonprogression than those with disc hemorrhage ( P = .014, Figure 1 ).
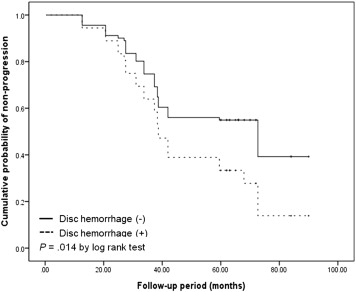
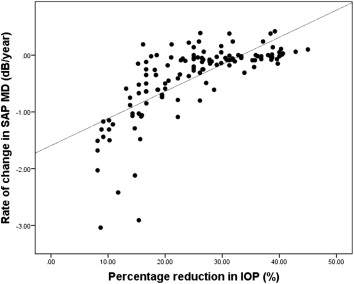
Figure 2 demonstrates a significant negative association between IOP reduction and SAP MD rate of change ( R 2 = 0.505, P < .001). Using the percentage reduction in IOP, the AUC for glaucoma progression detection was 0.685 (95% CI: 0.591–0.778). The cut-off value for percentage reduction in IOP that best discriminated progressors from nonprogressors was 22.1%, which resulted in a sensitivity of 76.4% and a specificity of 61.1%.