Purpose
To analyze quantitatively the alterations in the microvascular network of the upper tarsal conjunctiva, lid wiper, and bulbar conjunctiva relative to ocular discomfort after contact lens wear.
Design
A prospective, crossover clinical study.
Methods
Functional slit-lamp biomicroscopy was used to image the microvascular network of the upper tarsal conjunctiva, lid wiper, and bulbar conjunctiva. The microvascular network was automatically segmented, and fractal analyses were performed to yield the fractal dimension (D box ) that represented vessel density. Sixteen healthy subjects (9 female and 7 male) with an average age of 35.5 ± 6.7 years (mean ± standard deviation) were recruited. The right eye was imaged at 9 AM and 3 PM at the first visit (day 1) when the subject was not wearing contact lenses. During the second visit (day 2), the right eye was fitted with a contact lens for 6 hours. Microvascular imaging was performed before (at 9 AM) and after lens wear (at 3 PM). Ocular comfort was rated using a 50-point visual analog scale before and after 6 hours of lens wear, and its relationships with microvascular parameters were analyzed.
Results
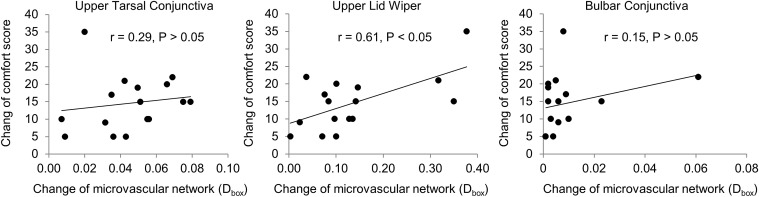
There were no significant differences in D box among the upper tarsal conjunctiva, lid wiper, and bulbar conjunctiva among the measurements at 9 AM (day 1 and day 2) and 3 PM (day 1) when the subjects were not wearing the lenses ( P > .05), whereas after 6 hours of lens wear, the microvascular network densities were increased in all 3 of these locations. D box of the lid wiper increased from 1.411 ± 0.116 to 1.548 ± 0.079 after 6 hours of contact lens wear ( P < .01). D box of the tarsal conjunctiva was 1.731 ± 0.026 at baseline and increased to 1.740 ± 0.030 ( P < .05). D box of the bulbar conjunctiva increased from 1.587 ± 0.059 to 1.632 ± 0.060 ( P < .001). The decrease in ocular discomfort was strongly related to the D box change in the lid wiper (r = 0.61, P < .05). There were no correlations between the changes of ocular comfort and the microvascular network densities of either the tarsal or bulbar conjunctivas ( P > .05).
Conclusions
This study is the first to show that the microvascular network of the lid wiper can be quantitatively analyzed in contact lens wearers. The microvascular responses of the lid wiper were significantly correlated with contact lens discomfort.
According to the TFOS International Workshop on Contact Lens Discomfort, contact lens discomfort (CLD) is a frequently experienced problem that is estimated to affect as many as 50% of contact lens wearers worldwide. As a condition characterized by episodic or persistent adverse ocular sensations related to contact lens wear, CLD occurs and results from reduced compatibility between the contact lens and the ocular environment. The resulting “discomfort” (which can vary in different individuals) stems from interactions among multiple psychophysical and neurobiological factors, which can lead to reduced lens wearing time or even termination of contact lens wear. Previous studies have indicated that the interaction between the contact lens and ocular surface can result in ocular tissue alterations and therefore leads to CLD. Many clinically used approaches, such as the assessment of alterations in the pre-lens tear film, the Meibomian glands, bulbar and limbal conjunctival hyperemia, corneal and conjunctival staining, lid wiper epitheliopathy (LWE), and lid parallel conjunctival folds, have been used in attempts to determine the causes of LCD. However, so far, CLD is not well understood, and the relationships between CLD and ocular surface alterations have not yet been established.
Whereas a contact lens wearer might exhibit a broad range of abnormal clinical signs, no single common sign has been identified as responsible for CLD. LWE was first described by Korb and associates in 2002 and all subsequent works have been thoroughly reviewed by Efron and associates in 2016. LWE has been reported to be related to some CLD symptoms, such as lens awareness, irritation, sandiness, and dryness. The lid wiper glides over the entire ocular surface during blinking. If a contact lens is worn, the lid wiper touches the contact lens surface, and the friction between the lens surface and lid wiper epithelium can cause prevalent and significant damage to the epithelium, resulting in LWE. It has been well documented that LWE often occurs in contact lens wearers, particularly symptomatic wearers. However, rough ranking (ranging from 0 to 3, total of 4 grades) of the LWE was not found to be correlated with CLD in clinical surveys (Schulze MM, et al. IOVS 2015;56:ARVO E-Abstract 6069). To analyze quantitatively the microvascular response of the ocular surface to contact lens wear, we developed a functional slit-lamp biomicroscope (FSLB) for quantifying the microvascular network of the human ocular surface, and we found that the microvascular network alters during contact lens wear. The goal of the present study was to quantitatively analyze the microvascular network of the lid wiper in response to a short period of contact lens wear and its relationship with CLD.
Methods
This is a prospective study and the protocol was approved by the institutional review board for human research at the University of Miami. Informed consent was obtained from each subject. All subjects were treated in accordance to the tenets of the Declaration of Helsinki.
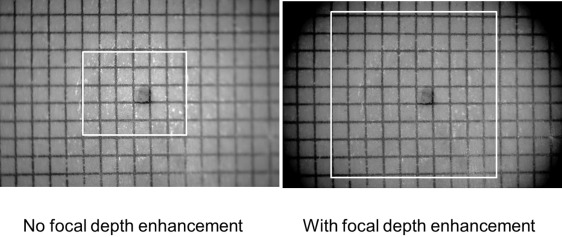
The FSLB and imaging procedure have been previously described. In summary, a digital camera (Canon 60D; Canon Inc, Melville, New York, USA) was attached to a traditional slit lamp (Nikon FS-2; Nikon Inc, Melville, New York, USA), creating the FSLB. The camera is a complementary metal-oxide semiconductor–based digital single lens reflex camera with an imaging sensor size of 22.3 mm × 14.9 mm, which acquires a maximum resolution of 5184 × 3456 pixels (∼17.9 megapixels). The pixel dimension on the camera sensor is 4.3 μm × 4.3 μm. A diaphragm with an aperture of 5 mm was fixed in front of the lens of the FSLB to increase the focus depth ( Figure 1 ). The International Standards Organization sensitivity was 2500, and the time of exposure was 1/15 second. With a built-in green filter and 15× magnifications, the field of view was approximately 15.74 × 10.50 mm 2 .
The subject was looking down and fixing on a target at the 6-o’clock position while we imaged the upper lid wiper. To expose the upper lid wiper and tarsal conjunctiva, the upper lid was inverted. By observing the live-view images on a high-definition monitor, the operator focused the green light on the middle of the upper tarsal conjunctiva or the lid wiper before still images were captured. In addition, images of the temporal bulbar conjunctiva were also captured using the same photography procedure described in our previous study.
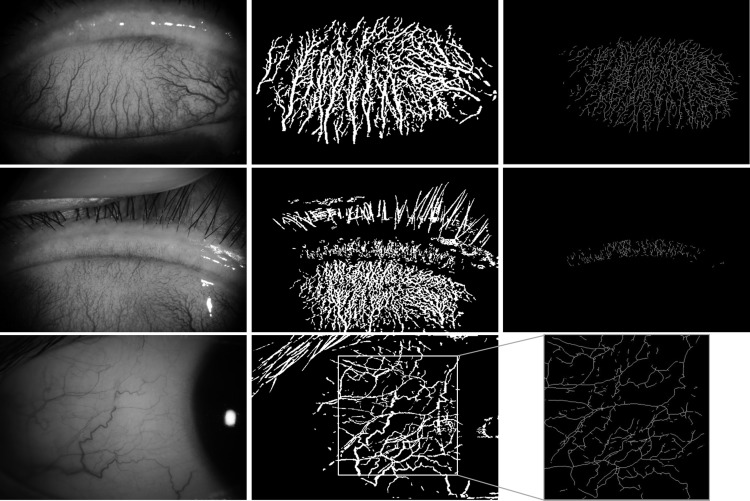
Custom software was developed to process the images for fractal analysis. The raw images for each subject were resized from 5184 × 3456 pixels to 1024 × 683 pixels. As described previously, to enhance the contrast between blood vessels and the background, adaptive histogram equalization and morphologic opening operations were performed to remove nonuniform illumination, background noise, and non-vessel structures ( Figure 2 ). The field of interest (FOI) was outlined manually. For the upper tarsal conjunctiva, the FOI started from the inferior tarsal sulcus and ended at the upper edge of the tarsus. For the upper lid wiper, the FOI started with the posterior region and extended to the meibomian gland ostia, ending with the subtarsal fold. The FOI of the bulbar conjunctiva involved an area of 7.87 × 7.87 mm 2 around the limbus.
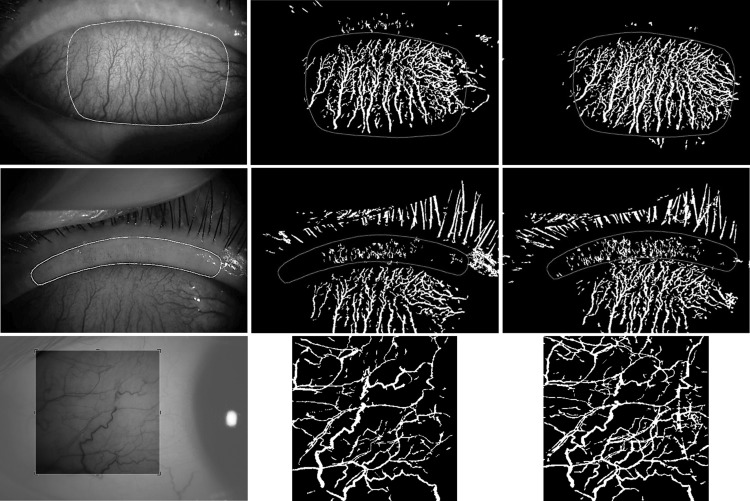
To maintain a similar area for repeated measures, the FOI of the first image of the same location (ie, lid wiper, tarsal and bulbar conjunctiva) of the same subject was overlaid on the remaining images. Manual adjustment was undertaken by moving the FOI to maximize the similarity of the covered area for each of the subsequent images ( Figure 3 ). Then, the FOI was cropped. The cropped image was subsequently inverted with ImageJ software (NIH, Bethesda, Maryland, USA), converted to a binary format, skeletonized, and analyzed for density (D box ) using the fractal analysis toolbox from Benoit software (TruSoft Benoit Pro 2.0; TruSoft Inc, St Petersburg, Florida, USA).
Sixteen healthy subjects (7 male and 9 female) with a mean age of 35.5 ± 6.7 years were recruited. None of them had a history of contact lens wear. Subjects with anterior or posterior segment pathologies, laser treatment, trauma, eye surgery, systemic disease, or tobacco or alcohol use were excluded. Additionally, those with the compounding factors of hypertension, diabetes, sickle cell anemia, cerebral small vessel disease, stroke, and other cardiovascular/cerebrovascular diseases or vascular diseases were also excluded.
To validate the method, vascular images of the upper lid wiper, upper tarsal conjunctiva, and temporal bulbar conjunctiva of the right eye were obtained at 9 AM and 3 PM (day 1) without the subject wearing the contact lens. On day 2 (lens study visit), the ocular vasculature of these 3 locations was imaged at baseline without contact lens wear (at approximately 9 AM) and at 6 hours after wearing contact lenses (PureVision B.C 8.3 mm, power −0.50 diopter; Bausch & Lomb, Rochester, New York, USA). The subjects rated CLD using a 50-point visual analog scale at baseline and at 6 hours after lens wear on day 2.
A statistical software package (SPSS for Windows 17.0; SPSS Inc, Chicago, Illinois, USA) was used for descriptive statistics and data analysis. Repeated analysis of variance (Re-ANOVA) was used, and post hoc tests were used to determine pairwise differences. P < .05 was considered a statistically significant difference. The coefficient of repeatability (CoR) was defined as 2 times the standard deviation of the difference between 2 measurements obtained by the same observer in different sessions for the same subject. The percentage of the CoR (CoR %) was calculated by dividing the CoR by the average of each of the 2 measurements between 9 AM and 3 PM.
Results
There were no significant differences in microvascular network densities (D box ) in any of the 3 locations among the 3 measurements on the first day or on the second day before wearing contact lenses ( P = .95) ( Table , Figure 4 ). The CoR of the D box in the upper tarsal conjunctiva, lid wiper, and bulbar conjunctiva at 9 AM on day 1 and at 9 AM before contact lens wear on day 2 (lens study visit day) was 1.6%, 3.3%, and 1.2%, respectively.
| Day 1 (No Lens Wear) | |||
|---|---|---|---|
| 9 AM | 3 PM | P Value | |
| Tarsal conjunctiva | 1.734 ± 0.024 | 1.732 ± 0.034 | .83 |
| Lid wiper | 1.409 ± 0.129 | 1.414 ± 0.127 | .60 |
| Bulbar conjunctiva | 1.586 ± 0.066 | 1.586 ± 0.062 | .96 |
| Day 2 (Contact Lens Study) | |||
|---|---|---|---|
| 9 AM (Before Contact Lens Wear) | 3 PM (6 Hours After Contact Lens Wear) | P Value | |
| Tarsal conjunctiva | 1.731 ± 0.026 | 1.740 ± 0.030 | .02 |
| Lid wiper | 1.411 ± 0.116 | 1.548 ± 0.079 | <.01 |
| Bulbar conjunctiva | 1.587 ± 0.059 | 1.632 ± 0.060 | <.01 |
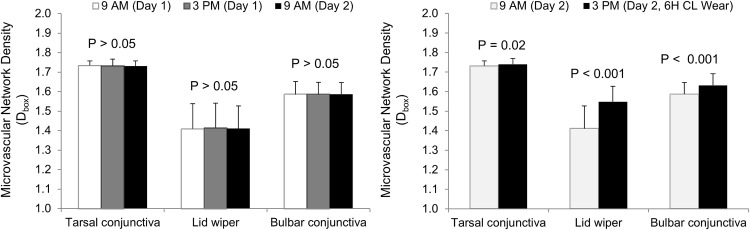
After 6 hours of contact lens wear, the microvascular network became apparently denser when observed using slit-lamp biomicroscopy. More profound changes were noted in the lid wiper ( Figure 4 ). The D box of the upper tarsal conjunctiva, upper lid wiper, and bulbar conjunctiva were all increased from baseline ( P < .01) ( Table , Figure 4 ). The increase in the lid wiper was significantly greater than in the 2 other locations ( P < .01). After 6 hours of contact lens wear, the comfort score decreased from 44.0 ± 8.2 to 29.9 ± 6.5 ( P < .01) in the lens-wearing eyes. The change in comfort score in the lens-wearing eyes was correlated with the D box changes in the lid wiper (r = 0.61, P < .05, Figure 5 ). There were no correlations between the changes in the comfort score and the D box changes in either the tarsal or bulbar conjunctiva ( P > .05) ( Figure 5 ).
Results
There were no significant differences in microvascular network densities (D box ) in any of the 3 locations among the 3 measurements on the first day or on the second day before wearing contact lenses ( P = .95) ( Table , Figure 4 ). The CoR of the D box in the upper tarsal conjunctiva, lid wiper, and bulbar conjunctiva at 9 AM on day 1 and at 9 AM before contact lens wear on day 2 (lens study visit day) was 1.6%, 3.3%, and 1.2%, respectively.
| Day 1 (No Lens Wear) | |||
|---|---|---|---|
| 9 AM | 3 PM | P Value | |
| Tarsal conjunctiva | 1.734 ± 0.024 | 1.732 ± 0.034 | .83 |
| Lid wiper | 1.409 ± 0.129 | 1.414 ± 0.127 | .60 |
| Bulbar conjunctiva | 1.586 ± 0.066 | 1.586 ± 0.062 | .96 |
Stay updated, free articles. Join our Telegram channel

Full access? Get Clinical Tree


