Purpose
To propose a novel prognostic feature of spectral-domain optical coherence tomography (SDOCT) in macula-involving branch retinal artery occlusion (BRAO).
Design
Retrospective comparative case study.
Methods
We analyzed 66 eyes diagnosed with acute BRAO involving the macula from our hospital RAO registry. At presentation, a detailed ophthalmic and medical history was obtained from all patients, and all underwent a comprehensive ophthalmic evaluation, which included visual acuity examination, fundus photography, fluorescein angiography, and SDOCT. This evaluation was performed at each follow-up visit.
Results
The 66 eyes diagnosed with acute BRAO involving the macula were divided into 2 groups according to initial vision: Good Vision (≥20/40, 29 eyes, 44%) and Poor Vision (<20/40, 37 eyes, 56%). The Poor Vision group was further divided into Improvement (18 eyes, 27%) and Nonimprovement (19 eyes, 28%) groups, according to visual recovery at the final examination. Among multiple OCT parameters, the involvement of papillomacular bundle, but not that of the central fovea, was consistently observed in the Poor Vision group ( P < .001) and more significantly in the Nonimprovement group ( P < .001). Papillomacular bundle involvement features included signs of inner retinal ischemia, including inner retinal thickening, inner retinal hyperreflectivity, and loss of layer-by-layer integrity. Loss of layer-by-layer integrity was seen consistently in the Nonimprovement group. Quantitative analysis of inner retinal thickness also supported this association.
Conclusion
In eyes with macula-involving BRAO, ischemic injury of the papillomacular bundle at the acute stage, as seen on OCT, correlates closely with poor vision and can explain the poor visual prognosis.
Retinal artery occlusion (RAO) is a relatively common, visually disabling, ocular vascular occlusive disorder. Branch retinal artery occlusion (BRAO) is estimated to account for about 38% of all acute RAO cases and typically occurs at vessel bifurcation and involves the temporal vessel in 98% of cases. The cause of vascular occlusion disease is typically thought to be emboli, blood clots, or lipid plaques, and similar mechanisms apply to RAO; thus, a vascular etiology, with stroke and embolism from carotid artery plaques, is the most common pathogenic mechanism.
In previous studies, Hayreh and Podhajsky (44 eyes), Yuzurihara and Iijima (30 eyes), Mason and associates (52 eyes), and Hayreh and Podhajsky (212 eyes) presented information about the natural history and visual outcomes of BRAO. Mason and associates suggested that the visual prognosis after BRAO seems to be correlated with the initial presenting visual acuity, while Hayreh and Podhajsky classified BRAO into permanent, transient, and cilioretinal artery occlusion, and showed a relatively favorable visual outcome even when BRAO was permanent. Although BRAO is recognized as a disease with a relatively favorable outcome, in the clinical situation we often see patients who present with severe visual loss or deteriorated central vision. This can sometimes not be explained with a classic diagnostic approach, which involves slit-lamp biomicroscopy, fundus photography (FP), or fluorescein angiography (FA), without spectral-domain optical coherence tomography (SDOCT), and unfortunately this would not be recovered until the final visit. Furthermore, some BRAO patients who show FP and FA features similar to those in patients with poor vision are found to experience relatively good visual restoration upon follow-up.
Upon examination of the retinal vascular circulation state in RAO using FP and FA, the condition can easily be categorized into central retinal artery occlusion (CRAO) or BRAO, and the ischemic retinal area involved can be delineated. However, determination of the ischemic retinal area using retinal opacification on FP or the nonperfused area on FA is rather subjective and inaccurate. Most importantly, it is difficult to evaluate the perfusion status of the fovea using FA, because the foveal-avascular zone masks the ischemic involvement of the fovea. Therefore, to evaluate the ischemic involvement of the fovea in BRAO, it is necessary to investigate the retinal microstructure of the fovea and macula directly. Recently, our group demonstrated the importance of SDOCT in predicting prognosis in CRAO and showed that different OCT features are seen in different stages of the condition. Chu and associates described a prominent middle limiting membrane sign as a characteristic of acute retinal ischemic damage seen with OCT. More recently, Yu and associates described the spectrum of superficial and deep retinal capillary ischemia features seen on SDOCT in RAO. Although these studies have revealed retinal structural changes in RAO, studies on the retinal changes and visual outcome in BRAO using OCT are limited.
Therefore, we hypothesized that SDOCT might be a helpful diagnostic tool for evaluating ischemic injury of the retina involving the macula and for predicting visual prognosis in BRAO. In the present study, using SDOCT, we investigated the retinal structural changes in eyes with macula-involving BRAO and searched for anatomic factors that could predict the visual prognosis.
Methods
The institutional review board of the Seoul National University Bundang Hospital approved the study, which was conducted in accordance with the Declaration of Helsinki.
Patient Selection
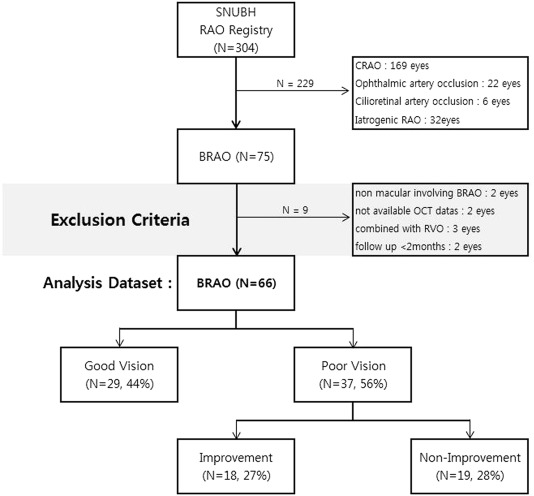
The Seoul National University Bundang Hospital RAO registry included records of a total of 304 eyes of patients who had visited Seoul National University Bundang Hospital between 1 January 2009 and 31 October 2014 for vision loss or a defect of the visual field occurring within 14 days of the initial visit. In addition to cases of CRAO (n = 169), ophthalmic artery occlusion (n = 22), cilioretinal artery occlusion (n = 6), and iatrogenic cosmetic filler-induced RAO (n = 32), there were 75 eyes with BRAO; our retrospective comparative case study focused on the latter group of eyes. All BRAO patients had undergone FA and SDOCT (Spectralis OCT; Heidelberg Engineering Inc, Heidelberg, Germany) evaluation at the initial visit, except in 2 cases of patient refusal owing to financial constraints. Patients with a history of ocular trauma, ocular surgery other than cataract surgery, any retinal disease of the contralateral eye, severe nonproliferative or proliferative diabetic retinopathy, nonmacular BRAO (n = 2, 1 that was nasal to the optic disc and another that was outside of the vascular arcade), retinal vascular disease other than BRAO (n = 3; combined retinal vein occlusion), follow-up of less than 2 months (n = 2), unavailable OCT data, or refusal of the OCT test (n = 2) were excluded. Finally, a total of 66 eyes from 66 patients with acute BRAO were included for analysis. BRAO patients were divided into Good Vision and Poor Vision groups according to their initial best-corrected visual acuity (BCVA) of 20/40. Additionally, the Poor Vision group was further divided into Improvement and Nonimprovement groups according to their visual improvement since the initial examination at their final examination. Visual improvement was defined as both final BCVA ≥20/60 and 20/100 degree improvement from initial visit ( Figure 1 ).
Main Outcome Measure
The main outcome measures are retinal microstructural factors predicting (1) initial poor vision and (2) visual recovery.
Ophthalmic Examination
All patients were followed up for at least in excess of 3 months from the initial visit and underwent a complete ophthalmic examination at the initial visit; at 1 month, 3 months, and 6 months; and every year thereafter. The examination included a measurement of the BCVA, Goldmann visual field (GVF) assessment, slit-lamp biomicroscopy, indirect ophthalmoscopy, FP (VX-10; Kowa OptiMed, Tokyo, Japan), FA, and SDOCT imaging. Initial OCT images were compared with those obtained at the final visit, which was at least 3 months after the initial visit, to assess the quantitative and qualitative changes in the inner retina over time. If the patient showed abrupt changes in visual acuity at the follow-up visit, GVF was reevaluated to determine whether central scotoma or central visual field defect had changed as compared to that at the initial or previous GVF, in order to rule out the possibility of extramacular fixation. If there were no significant changes to the GVF, BCVA was remeasured carefully, emphasizing central gaze fixation.
Qualitative Analysis of Inner Retinal Layer Change
SDOCT scans were performed at a scan rate of 40 000 A-scans/second over a 4.5 × 6.0 mm area. The eye-tracking system (ART Module; Heidelberg Engineering Inc) of the Spectralis SDOCT was used to minimize motion artifacts and to enhance image comparability over time. Follow-up scans were performed automatically in the same location at each visit, and the scan position was confirmed before comparing serial images. We defined the “papillomacular bundle area” as an inner retinal area that included the papillomacular bundle, a collection of retinal nerve fibers that carry the information from the macula (the central retina) to the optic nerve. Nasal retinal scan images were used to analyze the retina in the papillomacular bundle area. For qualitative analysis of inner retinal structure, images of the papillomacular bundle area (nasal macula) and the temporal macula in the horizontal scan of the foveal center point, and involving the superior or inferior perifoveal retinal area in the vertical scan of the foveal center point, were analyzed. With these OCT images, inner retinal structural changes were evaluated in terms of 4 parts (papillomacular bundle area, temporal, superior, and inferior regions) and compared with the contralateral eye, without BRAO, by assessing the inner retinal thickness, inner retinal hyperreflectivity, and loss of layer-by-layer integrity. Inner retinal thickening or thinning were defined as increased or decreased thickness as compared with corresponding areas of the contralateral unaffected eye. Inner retinal hyperreflectivity was defined as increased reflectivity compared with the adjacent normal retinal areas or with the corresponding areas of the contralateral unaffected eyes. Loss of layer-by-layer integrity was defined as indistinguishable border of each inner retinal layer owing to ischemic injury.
Quantitative Analysis of Inner Retinal Layer Change
A circular topographic macular map of 3 circular areas (including the foveal region, an inner macular ring, and an outer macular ring) with Early Treatment Diabetic Retinopathy Study–type sectors was generated for obtaining the retinal thickness in the fovea, parafovea, and perifovea, respectively. Among them, central minimal foveal thickness, which is correlated with the central fovea (foveola), was measured within the center of the innermost central circle of the macular thickness scan and the precise central minimal foveal thickness value was determined based on the thickness map of the SDOCT. Because central minimal foveal thickness is the most important indicator reflecting central visual acuity and perifoveal or parafoveal focal edematous lesions can be obscured by the overall macular state, central minimal foveal thickness was used as a parameter for evaluating the macular state in the present study. Furthermore, the inner retinal layer thickness, consisting of the combined ganglion cell layer, inner plexiform layer, and inner nuclear layer in the papillomacular bundle area, was measured manually using the built-in calipers of the OCT system, at the thickest point of the papillomacular bundle area on the horizontal scan of the foveal center point.
For precise qualitative and quantitative analyses, initial and final SDOCT findings of inner retinal layer were evaluated and inner retinal thickness of papillomacular bundle area were measured separately and independently by 2 retina specialists (K.H.C., S.J.W.) who were masked to patient detail.
Statistical Analysis
Data for continuous variables are expressed as the mean ± standard deviation, and were compared between the Good Vision group and the Poor Vision group and between the Improvement group and the Nonimprovement group using the Mann-Whitney U test or the Wilcoxon signed rank test. Frequency data, including OCT features, were compared by Fisher exact test. Among the SDOCT features, possible predictive factors with P < .1 in univariate analysis were collected and analyzed using a multivariate logistic regression model. Visual acuity measurements were converted to the logarithm of the minimal angle of resolution (logMAR) for all analyses.
For qualitative analysis, Cohen’s kappa coefficient was computed to evaluate interobserver agreement in determining classification and grading of initial and final SDOCT findings (<0 indicated no agreement, 0–0.20 indicated slight agreement, 0.21–0.40 indicated fair agreement, 0.41–0.60 indicated moderate agreement, 0.61–0.80 indicated substantial agreement, and 0.81–1.00 indicated almost-perfect agreement). For quantitative analyses, the reliability of the inner retinal thickness of the papillomacular bundle area measurement was assessed by the absolute agreement model of the intraclass correlation coefficient (ICC). A high ICC value (ICC ≥ 0.8) shows that there was good agreement between the investigators. Bland-Altman plot analyses were performed to see if there was any proportional bias between measurements.
Statistical analyses were performed using SPSS version 18.0 for Windows (SPSS, Inc, Chicago, Illinois, USA), and a P value < .05 was considered to indicate a statistically significant difference.
Results
Clinical Characteristics and Representative Diagnostic Images
Table 1 presents the clinical characteristics of the study subjects (43 men and 23 women; mean age: 58.69 ± 18.90 years; mean follow-up period: 12.94 ± 13.79 months). BRAO in the present study predominantly affected the right eye (38 eyes from a total of 66 eyes; 58%); initial BCVA was 0.85 ± 0.84 (range: hand motion [HM] to 20/20), and final BCVA was 0.49 ± 0.72 (range: HM to 20/20). The Good Vision and Poor Vision groups included 29 (44%) and 37 (56%) eyes, respectively, and the Improvement and Nonimprovement subgroups within the Poor Vision group included 18 (27%) and 19 (28%) eyes, respectively.
| Characteristics | Mean or Number |
|---|---|
| Total number of patients | 66 |
| Age, mean (y) | 58.69 ± 18.90 (range: 18–92) |
| Sex (male:female), n (%) | 43 (65%):23 (35%) |
| Follow-up period (mo) | 12.94 ± 13.79 (range: 3–51) |
| Time from symptom onset to OCT examination (h) | 93.17 ± 111.59 (range: 1–350) |
| Initial BCVA, logMAR (range) | 0.85 ± 0.84 (range: HM to 20/20) |
| Final BCVA, logMAR (range) | 0.49 ± 0.72 (range: HM to 20/20) |
| Side of BRAO (right:left), n (%) | 38:28 (58%:42%) |
| BRAO classification: | |
| Good vision : poor vision (improvement : nonimprovement) (n, % from overall patients) | 29:37; 44%:56% (18:19; 27%:28%) |
| Involved retinal artery branch | |
| Superotemporal, n (%) | 33 (50%) |
| Inferotemporal, n (%) | 28 (42%) |
| Perimacular, a n (%) | 5 (8%) |
a Focal ischemia around macula due to fine branch occlusion of branch retinal arteriole.
Representative FP, FA, and SDOCT images for the Good Vision group, and for the Improvement and Nonimprovement subgroups within the Poor Vision group, are shown in Figure 2 . Most of the BRAO patients showed ischemic lesions of a similar extent in FP at the initial visit, and the Poor Vision group showed a typically gross invasion of the papillomacular bundle area. In SDOCT, the Good Vision group showed completely preserved inner retinal layer continuity and just-visible mild inner retinal thickening of the papillomacular bundle area. In contrast, hyperreflectivity as well as inner retinal thickening of the papillomacular bundle area on the horizontal foveal scan were observed in both subgroups in the Poor Vision group. The main OCT feature that was different between the 2 subgroups in the Poor Vision group was the disruption of the layer-by-layer integrity of the inner retinal layer of the papillomacular bundle area. Although a merely irregular layer-by-layer integrity was seen in the Improvement subgroup, nearly complete disruption of layer-by-layer integrity of the inner retinal layer of the papillomacular bundle area was observed clearly in the Nonimprovement subgroup.
Comparison of Retinal Microstructural Change Over Time Per Group
Table 2 presents the comparison of visual acuity and morphologic features of SDOCT between the Good Vision and Poor Vision groups. Significant differences in the initial and final BCVA were noted between these 2 groups (both P < .001). However, age and the composition of the involved retinal artery branch were not different between the 2 groups. The central fovea was not topographically involved in any of the patients with BRAO. Central minimal foveal thickness was not different within a group and was not correlated with changes in BCVA.
| Good Vision | Poor Vision | P Value | |
|---|---|---|---|
| N (%) | 29 (44%) | 37 (56%) | |
| Age (y), mean (range) | 60.96 ± 12.36 (32–78) | 65.16 ± 17.48 (18–86) | .158 b |
| Follow-up (mo) | 13.00 ± 14.83 (6–51) | 15.40 ± 14.81 (3–46) | .585 b |
| Initial BCVA, logMAR (range) | 0.08 ± 0.12 (20/40–20/20) | 1.48 ± 0.65 (HM to 20/50) | <.001 b |
| Final BCVA, logMAR (range) | 0.05 ± 0.09 (20/30–20/20) | 0.96 ± 0.83 (HM to 20/25) | <.001 b |
| Involved retinal artery branch (ST:IT:P), n (%) | 15:12:2 (52%:41%:7%) | 18:16:3 (49%:43%:8%) | |
| SDOCT analysis a | |||
| Fovea | |||
| Initial CMFT (μm) (range) | 214.73 ± 18.62 (173–255) | 230.89 ± 40.87 (180–298) | .387 b |
| Final CMFT (μm) (range) | 211.64 ± 19.88 (175–240) | 213.05 ± 26.35 (191–277) | .739 b |
| Papillomacular bundle area | |||
| Initial examination, n (%) | |||
| Inner retinal thickening | 16 (55%) | 37 (100%) | <.001 c |
| Inner retinal hyperreflectivity | 5 (17%) | 30 (81%) | <.001 c |
| Loss of layer-by-layer integrity | 1 (3%) | 17 (46%) | <.001 c |
| Final examination, n (%) | |||
| Inner retinal thinning d | 0 | 17 (46%) | <.001 c |
| Loss of layer-by-layer integrity | 1 (3%) | 17 (46%) | <.001 c |
| Superior or inferior involved area | |||
| Initial examination, n (%) | |||
| Inner retinal thickening | 29 (100%) | 37 (100%) | |
| Inner retinal hyperreflectivity | 27 (93%) | 36 (97%) | .578 c |
| Loss of layer-by-layer integrity | 25 (86%) | 35 (94%) | .392 c |
| Final examination, n (%) | |||
| Inner retinal thinning d | 27 (93%) | 37 (100%) | .189 c |
| Loss of layer-by-layer integrity | 25 (86%) | 35 (94%) | .392 c |
| Temporal macular area | |||
| Initial examination, n (%) | |||
| Inner retinal thickening | 14 (48%) | 19 (51%) | .865 c |
| Inner retinal hyperreflectivity | 11 (38%) | 15 (40%) | .830 c |
| Loss of layer-by-layer integrity | 9 (31%) | 14 (38%) | .611 c |
| Final examination, n (%) | |||
| Inner retinal thinning d | 13 (45%) | 15 (40%) | .804 c |
| Loss of layer-by-layer integrity | 9 (31%) | 14 (38%) | .611 c |
a Papillomacular bundle area = inner retinal area relevant to the papillomacular bundle, analysis on the horizontal foveal SDOCT scan; superior or inferior involved area = analysis on the vertical foveal SDOCT scan; temporal macular area = analysis on the horizontal foveal SDOCT scan.
c Fisher exact test; P < .05 was set for clinical significance.
d Final inner retinal thickness in the eye with branch retinal artery occlusion less than baseline inner retinal thickness in the contralateral eye.
In qualitative analysis of SDOCT, the features of the papillomacular bundle area on the horizontal foveal scan were significantly different between the 2 groups. At the initial scan, inner retinal thickening in the Good Vision and Poor Vision groups was 16 of a total of 29 patients (55%) and 37 of a total of 37 patients (100%), respectively; inner retinal hyperreflectivity was seen in 5 patients (17%) and 30 patients (81%), respectively; and loss of layer-by-layer integrity was observed in 1 patient (3%) and 17 patients (46%), respectively (all P < .001). At the final examination, inner retinal thinning was not seen in the Good Vision group, but was seen in 17 (46%) of the patients in the Poor Vision group. The distribution of OCT features in the involved superior and inferior retinal areas and in the temporal macular area did not differ between the 2 groups at either the initial or final examination.
Table 3 presents a comparison of the visual acuity and morphologic features on SD OCT in the Improvement and Nonimprovement subgroups of the Poor Vision group. Initial and final BCVA were statistically significantly different between the 2 groups ( P = .05 and P < .001, respectively). Age and the involved retinal artery branch composition were not different between the 2 groups. Moreover, the initial and final central minimal foveal thickness did not differ between the 2 groups; thus, central minimal foveal thickness did not correlate with the difference in BCVA ( P = .931 and P = .345, respectively). As shown in Figure 3 , the initial and final BCVA differed, but central minimal foveal thickness was not different between the initial and final examination within a group.
| Improvement | Nonimprovement | P Value | |
|---|---|---|---|
| N (%) | 18 (27%) | 19 (29%) | |
| Age, mean (y) | 61.22 ± 16.41 (21–80) | 68.89 ± 18.06 (18–86) | .186 |
| Initial BCVA, logMAR (range) | 1.20 ± 0.68 (HM to 20/50) | 1.64 ± 0.57 (HM to 20/200) | .05 b |
| Final BCVA, logMAR (range) | 0.36 ± 0.15 (20/80–20/25) | 1.32 ± 0.86 (HM to 20/200) | <.001 b |
| Involved retinal artery branch (ST:IT:P), n (%) | 10:7:1 (56%:38%:6%) | 9:8:2 (49%:42%:9%) | |
| SDOCT analysis a | |||
| Fovea | |||
| Initial CMFT (μm) (range) | 225.33 ± 31.23 (180–286) | 232.93 ± 46.77 (174–298) | .931 b |
| Final CMFT (μm) (range) | 207.77 ± 19.92 (193–243) | 218.63 ± 29.88 (191–277) | .345 b |
| Papillomacular bundle area | |||
| Initial examination, n (%) | |||
| Inner retinal thickening | 17 (94%) | 19 (100%) | .486 c |
| Inner retinal hyperreflectivity | 15 (83%) | 17 (94%) | .660 c |
| Loss of layer-by-layer integrity | 3 (17%) | 16 (84%) | <.001 c |
| Final examination, n (%) | |||
| Inner retinal thinning d | 2 (11%) | 17 (94%) | <.001 c |
| Loss of layer-by-layer integrity | 3 (17%) | 16 (84%) | <.001 c |
| Superior or inferior involved area | |||
| Initial examination, n (%) | |||
| Inner retinal thickening | 18 (100%) | 19 (100%) | |
| Inner retinal hyperreflectivity | 17 (94%) | 19 (100%) | .486 c |
| Loss of layer-by-layer integrity | 16 (88%) | 19 (100%) | .230 c |
| Final examination, n (%) | |||
| Inner retinal thinning d | 18 (100%) | 19 (100%) | |
| Loss of layer-by-layer integrity | 16 (88%) | 19 (100%) | .230 c |
| Temporal macular area | |||
| Initial examination, n (%) | |||
| Inner retinal thickening | 10 (56%) | 9 (47%) | .746 c |
| Inner retinal hyperreflectivity | 7 (39%) | 8 (42%) | .842 c |
| Loss of layer-by-layer integrity | 7 (39%) | 7 (37%) | .737 c |
| Final examination, n (%) | |||
| Inner retinal thinning d | 8 (44%) | 7 (37%) | .743 c |
| Loss of layer-by-layer integrity | 7 (39%) | 7 (37%) | .737 c |
Stay updated, free articles. Join our Telegram channel

Full access? Get Clinical Tree


