Purpose
To investigate the associations between the non–intraocular pressure (IOP)–related genetic variants (genetic variants associated with vulnerability of the optic nerve independent of IOP) and primary open-angle glaucoma (POAG), including normal-tension glaucoma (NTG) and high-tension glaucoma (HTG), and between the non-IOP-related genetic variants and a family history of glaucoma.
Design
Case-control study.
Methods
Japanese patients with NTG (n = 213) and HTG (n = 212) and 191 control subjects were genotyped for 5 non-IOP-related genetic variants predisposing to POAG near the SRBD1 , ELOVL5 , CDKN2B/CDKN2B-AS1 , SIX1 / SIX6 , and ATOH7 genes. The load of these genetic variants was compared between the control subjects and patients with NTG or HTG and between the POAG patients with and without a family history of glaucoma.
Results
The total number of POAG risk alleles and the product of the odds ratios (POAG risk) of these genetic variants were significantly larger ( P < .0025) in patients with both NTG and HTG than in the control subjects, and were significantly larger ( P = .0042 and P = .023, respectively) in POAG patients with a family history of glaucoma than in those without. As the number of relatives with glaucoma increased, the total number of risk alleles and the product of the odds ratios increased ( P = .012 and P = .047, respectively).
Conclusions
Non-IOP-related genetic variants contribute to the pathogenesis of HTG as well as NTG. A positive family history of glaucoma in cases of POAG is thought to reflect the influence of genetic variants predisposing to POAG.
Glaucoma is characterized by the progressive development of optic neuropathy resulting from retinal ganglion cell (RGC) death. Although primary open-angle glaucoma (POAG) represents the most prevalent form of glaucoma, the pathogenesis and factors determining the disease progression of POAG are poorly understood. Clinically, intraocular pressure (IOP) elevation and myopia are reported to be risk factors for optic nerve damage in patients with POAG. However, the underlying causes of these risk factors also remain obscure. Additionally, a positive family history of glaucoma is a major risk factor for POAG, and genetic and/or familial factors are therefore considered to play important roles in the pathogenesis of POAG.
To date, several gene mutations have been identified to be causative for POAG. However, cases of POAG caused by these gene mutations account for less than 5% of all POAG cases, and POAG is presumed to be a complex disease attributed to multiple predisposing genetic variants. Genetic analyses, including genome-wide association studies, have identified approximately 65 (candidate) genetic variants predisposing to POAG, which can be classified into 2 types. One type involves genetic variants associated with IOP elevation (IOP-related genetic variant), while the other involves genetic variants associated with vulnerability of the RGC and/or optic nerve independent of IOP (non-IOP-related genetic variant), which may include genetic variants associated with the apoptosis of RGCs, myopia, and optic nerve circulation. POAG is clinically classified into high-tension glaucoma (HTG), in which an elevated IOP is the major feature, and normal-tension glaucoma (NTG), in which the IOP is consistently within the statistically normal range for the population, and it is presumed that IOP-related genetic variants would predominate in patients with HTG. In contrast, non-IOP-related genetic variants are predicted to predominate in patients with NTG. In order to further elucidate the complex genetic mechanisms of POAG, the present study was conducted to investigate the association between the non-IOP-related genetic variant and POAG, including NTG and HTG. Furthermore, the association between the non-IOP-related genetic variant and a family history of glaucoma was also investigated.
Methods
Subjects
In this case-control study, Japanese patients with POAG were recruited from the ophthalmology practices at the Yamanashi University Hospital, Enzan Municipal Hospital, Uenohara City Hospital and Oizumi Clinic in Yamanashi or Nagano Prefectures, Japan. A diagnosis of POAG was made when an open angle was detected on a gonioscopic examination, and typical glaucomatous cupping of the optic disc (thinning of the optic disc rim and/or enlargement of the optic disc cupping) with a compatible visual field defect (nasal step and/or partial arcuate visual field defect) was observed on automated static perimetry (Humphrey Visual Field Analyzer 30-2: HFA30-2; Humphrey Instruments, San Leandro, California, USA). In addition, patients with HTG had evidence of at least 1 previous measurement of IOP that was greater than 21 mm Hg with a Goldmann applanation tonometer. Patients with NTG showed an IOP of 21 mm Hg or less each time they were tested. Patients were excluded if they had a history of eye surgery, including laser treatment, before the diagnosis of POAG. The control subjects recruited from participating institutions included Japanese individuals over 40 years of age, with an IOP below 21 mm Hg, who exhibited no glaucomatous cupping of the optic disc (no thinning of disc rim and vertical cup-to-disc ratio [VCDR] less than 0.4) and had no family history of glaucoma. All subjects received comprehensive ophthalmologic examinations, including both slit-lamp biomicroscopy and funduscopy. They were also interviewed to determine whether or not they had any relatives with glaucoma, and the subjects who reported having such a relative with glaucoma were then considered to have a family history of glaucoma. The existence of relatives with glaucoma in the first to third degrees was identified in the present study. The study protocol was prospectively approved by the Ethics Committee of the University of Yamanashi and informed consent was obtained from all study participants. The study was conducted from October 1998 to March 2014 in accordance with the Declaration of Helsinki.
Genomic DNA Genotyping
Peripheral blood was collected, and genomic DNA was purified with a Flexi Gene DNA Kit (QIAGEN, Valencia, California, USA). Five genetic variants identified as non-IOP-related genetic variants on genome-wide association studies were genotyped, including rs3213787 (near gene; S1 RNA binding domain 1: SRBD1 ), rs735860 (elongation of long-chain fatty acids family member 5: ELOVL5 ), rs1063192 (cyclin-dependent kinase inhibitor 2B/cyclin-dependent kinase inhibitor 2B antisense noncoding RNA: CDKN2B/CDKN2B-AS1 ), rs10483727 (sin oculis homeobox homolog 1/sin oculis homeobox homolog 6: SIX1/SIX6 ), and rs1900004 (atonal homolog 7: ATOH7 ). The rs3213787, rs735860, and rs1063192 was genotyped using an allele-specific primer real-time polymerase chain reaction (PCR) method as previously described. The following primers were used for amplification, and the predicted amplicon lengths for rs3213787, rs735860, and rs1063192 were 105, 212, and 365 base pairs, respectively:
rs3213787:
A allele–specific forward primer: AATGTATAAACCCATAGACGTTC C CT A
G allele–specific forward primer: AATGTATAAACCCATAGACGTTC C CT G
Common reverse primer: TCACAGAATCTTGAGTTTAACTGGC
rs735860:
C allele–specific forward primer: CCTTGGTCCTGCTCC G TC C
T allele–specific forward primer: CCTTGGTCCTGCTCC G TC T
Common reverse primer: GACCCAGAGTGCCAGAACA
rs1063192:
T allele–specific forward primer: TGTGGAATCTTTCCTAATGAC G AC T
C allele–specific forward primer: TGTGGAATCTTTCCTAATGAC G AC C
Common reverse primer: TTTCTGTATTCCACAATGGAGC
Allelic discrimination for these genetic variants was achieved using PCR amplification of specific alleles. Briefly, the first nucleotide difference (A or G) between sense primers used to discriminate between the major and minor alleles for rs3213787 is located on the 3′ end. The second primer base change (T to C) located 3 bases from the 3′ end generates an internal primer/template mismatch, and this prevents the amplification of the nonmatching primer. These changes were made to prevent the generation of possible spurious products that could otherwise occur by the annealing and extension of a G allele–specific primer to the first-round product of an A allele–specific primer. PCR amplifications with A and G allele–specific primers were separately performed to determine the genotypes for this genetic variant. To perform accurate genotyping, we used the amplification products accurately genotyped by direct sequencing as positive controls for this method. The genotyping for rs735860 and rs1063192 were also performed in the same manner. The remaining 2 genetic variants were genotyped using TaqMan single nucleotide polymorphism (SNP) genotyping assays (Applied Biosystems [ABI], Foster City, California, USA). Assays were performed on a LightCycler 480 System II (Roche Diagnostics, Meylan, France) according to the manufacturer’s instructions.
Statistical Analysis
Data were analyzed using SAS statistical software (version 9.1; SAS Institute Inc, Cary, North Carolina, USA). A χ 2 analysis of the Hardy-Weinberg equilibrium for each genotyped SNP was performed for patients and control subjects. The total number of POAG risk alleles (range: 0–10) of 5 non-IOP-related genetic variants was calculated for each participant and compared between the control subjects and patients with HTG or NTG using Student t test. A logistic regression model was used to estimate the risk (odds ratio) of POAG for each risk allele of 5 non-IOP-related genetic variants compared between the POAG patients and control subjects adjusted for age and sex. The product of the odds ratios of 5 non-IOP-related genetic variants was calculated for each patient and compared between the control subjects and patients with HTG or NTG using Student t test. A logistic regression analysis was carried out to study the effects of the total number of POAG risk alleles compared between the NTG or HTG patients and control subjects adjusted for age and sex. The prevalence of a family history of glaucoma in patients with POAG was compared with respect to the total number of risk alleles using χ 2 test. The total number of risk alleles and the product of the odds ratios were compared between the POAG patients with and without a family history of glaucoma using Student t test. The total number of risk alleles and the product of the odds ratios in patients with POAG were also compared according to the number (none, 1, and 2 or more) or degree (none, first degree, and second or third degrees) of relatives with glaucoma using analysis of variance. A value of P < .05 was considered to be statistically significant.
Results
Four hundred and twenty-five Japanese patients with POAG (213 patients with NTG and 212 patients with HTG) and 191 control subjects were enrolled in the present study. The demographic, clinical, and genetic data in patients with POAG and the control subjects are shown in Table 1 . The mean age at the time of blood sampling was 63.4 ± 14.3 years (standard deviation) in patients with POAG and 65.7 ± 11.4 years in the control subjects. The mean maximum IOP was 23.5 ± 8.2 mm Hg in patients with POAG (18.5 ± 1.9 mm Hg and 28.5 ± 9.0 mm Hg in patients with NTG and HTG, respectively) and 15.0 ± 2.7 mm Hg in the control subjects. The genotype and allele frequencies were in Hardy-Weinberg equilibrium in patients with NTG and HTG and the control subjects. The odds ratios (POAG risk) evaluated according to the logistic regression analysis of the risk alleles of 5 non-IOP-related genetic variants, rs3213787 ( SRBD1 ), rs735860 ( ELOVL5 ), rs1063192 ( CDKN2B/CDKN2B-AS1 ), rs10483727 ( SIX1/SIX6 ), and rs1900004 ( ATOH7 ), were 2.65, 1.12, 1.56, 1.09, and 1.26, respectively.
| Control (n = 191) | POAG | ||||
|---|---|---|---|---|---|
| NTG (n = 213) | P Value | HTG (n = 212) | P Value | ||
| Age at blood sampling (y) | 65.7 ± 11.4 | 64.0 ± 13.7 | .18 | 62.9 ± 14.8 | .037 |
| Age at diagnosis (y) | – | 57.4 ± 13.3 | – | 54.4 ± 15.3 | – |
| Male sex, n (%) | 70 (36.6) | 91 (42.7) | .22 | 129 (60.8) | <.0001 |
| Maximum IOP (mm Hg) | 15.0 ± 2.7 | 18.5 ± 1.9 | <.0001 | 28.5 ± 9.0 | <.0001 |
| Refractive error (diopter) | −0.4 ± 2.2 | −2.0 ± 3.4 | <.0001 | −2.1 ± 3.0 | <.0001 |
| Familial history of glaucoma, n (%) | 0 (0) | 48 (22.5) | <.0001 | 62 (29.2) | <.0001 |
| Minor allele frequencies (%) | |||||
| rs3213787 G allele (near gene: SRBD1 ) | 7.3 | 2.8 | .0033 | 2.4 | .0013 |
| rs735860 C allele ( ELOVL5 ) | 39.5 | 38.0 | .67 | 45.3 | .10 |
| rs1063192 C allele ( CDKN2B/CDKN2B-AS1 ) | 22.3 | 13.8 | .0023 | 17.7 | .11 |
| rs10483727 C allele ( SIX1/6 ) | 20.2 | 18.3 | .53 | 18.9 | .66 |
| rs1900004 A allele ( ATOH7 ) | 31.9 | 39.4 | .028 | 34.7 | .45 |
Associations Between Primary Open-Angle Glaucoma and the Non–Intraocular Pressure–Related Genetic Variants
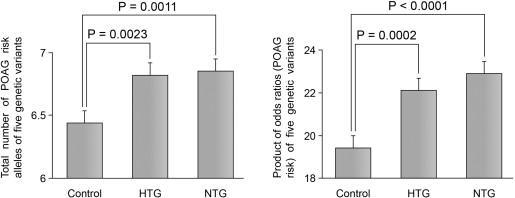
The total number of POAG risk alleles (6.9 ± 1.3, mean ± standard deviation) and the product of the odds ratios (22.9 ± 7.1) of 5 non-IOP-related genetic variants in patients with NTG were significantly larger ( P = .0011 and P < .0001, respectively, Student t test) than those (6.4 ± 1.3 and 19.4 ± 7.5, respectively) observed in the control subjects ( Figure 1 ). Similarly, the total number of risk alleles (6.8 ± 1.2) and the product of the odds ratios (22.1 ± 6.7) in patients with HTG were also significantly larger ( P = .0023 and P = .0002, respectively, Student t test) than those observed in the control subjects ( Figure 1 ). After adjusting for age and sex, an almost 1.3-fold increased risk of NTG ( P = .0016, odds ratio: 1.29, 95% confidence interval: 1.10–1.51) and HTG ( P = .0015, odds ratio: 1.31, 95% confidence interval: 1.11–1.54) was found for the total number of POAG risk alleles ( Table 2 ).
| Variable | NTG | HTG | ||
|---|---|---|---|---|
| P Value | Odds Ratio (95% CI) | P Value | Odds Ratio (95% CI) | |
| Age (y) | .18 | 0.99 (0.97–1.01) | .11 | 0.99 (0.97–1.003) |
| Male sex | .37 | 1.20 (0.80–1.81) | <.0001 | 2.63 (1.74–3.97) |
| Total number of POAG risk alleles of 5 non-IOP-related genetic variants | .0016 | 1.29 (1.10–1.51) | .0015 | 1.31 (1.11–1.54) |
Associations Between a Family History of Glaucoma and the Non–Intraocular Pressure–Related Genetic Variants
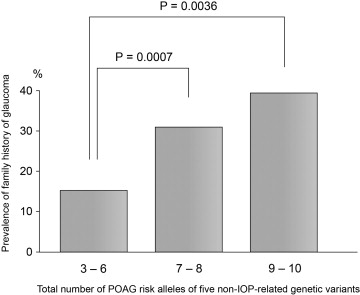
As the total number of POAG risk alleles of 5 non-IOP-related genetic variants for each patient with POAG increased, the prevalence of patients with a family history of glaucoma increased ( P = .0008, χ 2 test, Figure 2 ). The prevalence of a family history of glaucoma among the POAG patients with 7–8 and 9–10 POAG risk alleles (30.7% and 39.3%, respectively) was significantly higher ( P = .0007 and P = .0036, respectively, χ 2 test) than that (15.7%) observed among the POAG patients with 3–6 POAG risk alleles ( Figure 2 ). The total number of POAG risk alleles and the product of the odds ratios (POAG risk) were significantly larger ( P = .0042 and P = .023, respectively, Student t test, Supplemental Figure 1 , available at AJO.com ) in the POAG patients with a family history of glaucoma (n = 110, 7.1 ± 1.2 and 23.8 ± 6.7, respectively) than in those without a family history of glaucoma (n = 315, 6.7 ± 1.3 and 22.1 ± 6.9, respectively). Moreover, the total number of POAG risk alleles and the product of the odds ratios were compared according to the number or degree of relatives with glaucoma. As the number of relatives with glaucoma increased, the total number of POAG risk alleles and the product of the odds ratios increased ( P = .012 and P = .047, respectively, analysis of variance, Supplemental Figure 2 , available at AJO.com ), although no statistically significant differences were detected with respect to the degree of the relatives with glaucoma.