Purpose
To determine the preretinal distribution of oxygen in advanced proliferative diabetic retinopathy, and to investigate the relationship between intraocular oxygen tensions and vitreous cytokine concentrations.
Design
Comparative cross-sectional study.
Methods
Oxygen levels were measured at sites in the vitreous and at the inner retinal surface using an optical oxygen sensor in 14 control subjects and in 14 subjects with advanced proliferative diabetic retinopathy who had developed tractional retinal detachments despite previous panretinal photocoagulation. The vitreous and plasma concentrations of 42 cytokines were measured using multiplex cytokine arrays and their correlation with intraocular oxygen tension was investigated.
Results
The mean oxygen tension in the mid-vitreous in diabetic retinopathy was 46% lower than that in control subjects ( P = .017). However, the mean preretinal oxygen tension at the posterior pole in diabetic retinopathy was 37% higher than in controls ( P = .039). We measured significant alterations in the vitreous concentrations of 9 cytokines—eotaxin, Flt-3 ligand, growth-related oncogene (GRO), interleukin (IL)-6, IL-8, IL-9, IFN-inducible protein-10 (IP-10), macrophage-derived cytokine (MDC), and vascular endothelial growth factor (VEGF)—in advanced proliferative diabetic retinopathy, and found that oxygen tension at the posterior pole was directly correlated with vitreous VEGF concentration.
Conclusion
We identified significant intraocular oxygen gradients in proliferative diabetic retinopathy. Our findings are consistent with the hypothesis that VEGF induces the development of neovascular complexes in the posterior retina that are richly perfused but nonetheless fail to redress hypoxia in the mid-vitreous. Upregulation of vitreous VEGF may be a consequence of retinal hypoxia at unidentified sites or of chronic inflammatory processes in advanced proliferative diabetic retinopathy.
Phototransduction and intraretinal neuronal processing present a uniquely high metabolic demand for oxygen that is normally met by a highly efficient retinal vascular supply. The normal function and survival of retinal cells is vulnerable to deficiencies in oxygen delivery; retinal ischemia is responsible for major causes of vision loss including diabetes. Adaptive tissue responses that protect against ischemia by compensatory changes in cellular metabolism and perfusion are mediated by molecular oxygen-sensing mechanisms, including stabilization of hypoxia-inducible transcription factors (HIFs) that orchestrate the expression of downstream cytokines including vascular endothelial growth factor (VEGF). The impact of diabetic microvascular disease on retinal ischemia and neovascularization is well established. However, the extent to which hypoxia is responsible for retinal dysfunction and for triggering adaptive tissue responses, including pathologic neovascularization in diabetes, is not well defined.
Oxygen tension across the retina has been measured directly using polarographic electrodes in animal models. The direct measurement of oxygen tension within the human retina would present a significant risk of adverse effects and has not been reported. Measurement of oxygen tension in the vitreous, which is believed to reflect global oxygenation of the retina, has demonstrated lower levels of oxygen in the vitreous of diabetic individuals compared to nondiabetic individuals. However, the oxygen state of the vitreous may be influenced by active metabolism of oxygen, for example by ascorbate, and does not help identify any regional differences in retinal oxygenation. Experimental investigation in cats has demonstrated that measurement of preretinal oxygen tension closely reflects oxygenation of the inner retina. In this study we investigated the feasibility of measuring the preretinal oxygen tension in human subjects and investigated the distribution of oxygen across the retina in proliferative diabetic retinopathy.
A causative association between retinal oxygen and the development of retinal neovascularization was first suggested by Michaelson and further explored in 1956 by Wise, who speculated that a hypoxia-induced growth factor, “factor X,” was responsible for inducing retinal neovascularization. Many candidate cytokines and growth factors have since been characterized, and VEGF has emerged as a particularly prominent mediator of intraocular angiogenesis. The expression of VEGF is upregulated by HIF-1alpha, which is stabilized in hypoxia. The concentrations of both VEGF and HIF-1alpha are increased in the vitreous in proliferative diabetic retinopathy and appear to correlate with disease activity, suggesting that stabilization of HIF-1alpha is responsible for VEGF production and progression of retinopathy. However, there is accumulating evidence that the HIF system can be activated independently of hypoxia, for example in an inflammatory microenvironment, which is a common feature in the pathogenesis of proliferative diabetic retinopathy. Both nitric oxide and reactive oxygen species, which are elevated in the diabetic vitreous, can increase HIF levels and may thereby induce pro-inflammatory and pro-angiogenic gene expression.
In this study we investigated the extent to which hypoxia is responsible for proliferative retinopathy by correlating intraocular oxygen tensions with the concentrations of vitreous cytokines.
Methods
Study Population
We recruited 14 individuals having vitrectomy surgery for advanced proliferative diabetic retinopathy and 14 control subjects having surgery for idiopathic epiretinal membrane or full-thickness macular hole. Informed consent was obtained from all subjects prior to entering the study. Exclusion criteria were any history of previous intraocular surgery or the presence of intraocular hemorrhage or inflammation. All subjects included in this study were phakic. Because systemic hyperoxia can influence intraocular oxygen tensions, we included only patients having surgery under local anesthesia who maintained peripheral oxygen saturations of 95% minimum during surgery without supplementary inhaled oxygen.
Measurement of Oxygen Tension
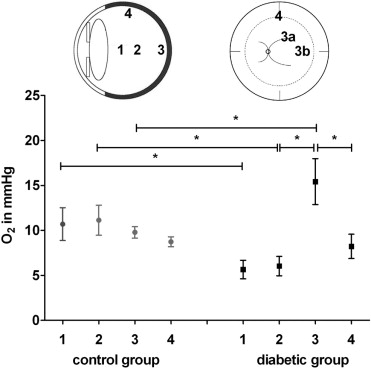
We measured intraocular oxygen tensions using an Oxylab pO 2 optical sensor (Oxford Optronix, Oxford, United Kingdom) set in fast mode (1 measurement per second). Prior to measuring oxygen tensions in the eyes of human subjects, we determined the effect of gas sterilization and the endoscopic illumination on the reliability of the sensor in gas mixtures of known oxygen tensions (0-147.4 mm Hg). Oxygen probes were gas-sterilized (Sterrad 100Nx; Johnson & Johnson, New Brunswick, New Jersey, USA) prior to use in human subjects. Using a 20-gauge 3-port pars plana technique, we sited the infusion cannula in the inferotemporal port without turning on the intraocular infusion. The oxygen probe was introduced via a heavy liquid cannula through a second port into the vitreous cavity and an endoscopic light pipe was introduced through the third port. We measured oxygen tensions by holding the sensor at specific sites in the eye until the monitor recorded constant values. We measured oxygen tensions in the anterior vitreous 3 mm posterior to the posterior pole of the lens (1), in the mid-vitreous (2), at the retinal surface 1 disc-macula diameter temporal to the macula (3a), at the retinal surface superior to the superotemporal arcade (3b), and at the retinal surface in the mid-periphery (superior equator, 4) ( Figure ). All preretinal measurements were taken with the probe in light contact with the retinal surface. To determine the test-retest variability of the sensors in vivo, and to identify any artefactual disturbance of intraocular oxygen tension caused by the measurement technique itself, we measured the mid-vitreous oxygen tension at both the start and the completion of the measurements. Once the measurements were completed and the vitreous sample collected (see below), the intraocular infusion was turned on and the vitreous surgery was performed as planned.
Sample Collection and Preparation
Undiluted vitreous samples (0.3-0.5 mL) were obtained from the mid-vitreous using a vitreous cutter at the start of vitrectomy, prior to intraocular infusion of fluid. Blood samples (5 mL) were obtained by venous puncture following surgery. The vitreous and blood samples were transferred directly into sterile plastic tubes on ice. The vitreous was subsequently centrifuged at 500 g for 10 minutes, and the blood sample at 1500 g for 15 minutes, at 4 C to remove the cellular components. The supernatants were aliquoted and stored at -80 C.
Cytometric Bead Array
Multiplex bead analysis was performed as previously described. Briefly, both vitreous and plasma samples were analyzed using the Milliplex Human Cytokine Panel 1 (catalog number MPXHCYTO-60K; Millipore UK Ltd, Watford, Uinited Kingdom) for the following 42 cytokines: endothelial growth factor (EGF), eotaxin, fibroblast growth factor 2 (FGF-2), Flt-3 ligand (Flt-3L), fractalkine, granulocyte colony-stimulating factor (G-CSF), granulocyte-macrophage colony-stimulating factor (GM-CSF), growth-related oncogene (GRO), interferon (IFN)-α2, IFN-γ, interleukin (IL)-1α, IL-1β, IL-1Rα, IL-2, IL-3, IL-4, IL-5, IL-6, IL-7, IL-8, IL-9, IL-10, IL-12 (p40), IL-12 (p70), IL-13, IL-15, IL-17, IFN-inducible protein-10 (IP-10), monocyte chemoattractant protein (MCP)-1, MCP-3, macrophage-derived cytokine (MDC), macrophage inflammatory protein (MIP)-1α, MIP-1β, platelet-derived growth factor (PDGF)-AA, PDGF-AB, sCD40L, sIL-2Rα, regulated on activation normal T expressed and secreted (RANTES), transforming growth factor (TGF)-α, tumor necrosis factor (TNF)-α, TNF-β, and VEGF in a single sample. Samples were brought to room temperature and added in duplicate to 96-well filter-bottom plates. Antibody-coated capture beads were added to the wells and incubated on a plate shaker at 4 C overnight. After a washing step, beads were further incubated with biotin-labeled secondary antibody for 1 hour and then incubated with streptavidin-phycoerythrin for 30 minutes. Then 100 μL of sheath fluid was added to each well and samples were analyzed using a bioassay analyzer (model 200; Luminex, Austin, Texas, USA). Cytokine concentrations were determined from standard curves prepared on each plate and expressed as picogram per milliliter (pg/mL). Concentrations below the detection limit of 3.2 pg/mL are treated as having a value of 1.6 pg/mL for the purposes of the analysis.
Statistical Analysis
Data were analyzed using GraphPad Prism software (Prism 5; GraphPad Software, La Jolla, California, USA). Correlation of the in vitro oxygen measurements and the in vivo test-retest measurements were calculated using the Pearson correlation coefficient. Differences in intraocular O 2 tensions between subjects with diabetes and controls, and in the concentrations of cytokines detected in more than 5 vitreous samples (n = 13), were analyzed using a 2-tailed Mann-Whitney test and expressed as mean ± SEM. To correct for multiple univariate analyses, the Bonferroni correction algorithm of error I level was applied for the cytokine analysis to retain the global error level at 5%. P values less than .0039 (= 0.05/13) were considered statistically significant. Correlations between cytokine concentrations and intraocular oxygen tensions were determined using the nonparametric Spearman correlation coefficient.
Results
Ex Vivo Assessment of Sensor Accuracy
To determine the reliability of the oxygen sensor before and after gas sterilization, we tested 6 probes in 6 sealed containers filled with a range of gas mixtures of known oxygen tensions (0-147.4 mm Hg). We identified very strong correlations between sensor readings and actual oxygen tensions, both before (Pearson correlation 0.997, P = .0001) and after gas sterilization of the probes (Pearson correlation 0.996, P = .0001). We also determined that illumination of the sensor by the endoillumination source did not affect its reliability when the light source was held still and distant to the sensor. Stable oxygen tension readings were reached 35 seconds after transferring the probes from an oxygen-rich to an oxygen-poor environment (147 to 6.9 mm Hg), and 25 seconds after transferring them within 2 oxygen-poor environments (6.9 to 0 mm Hg). On the basis of these findings, we allowed for at least 35 seconds at each intraocular site in human subjects before recording the oxygen tension.
Characteristics of Subjects Recruited
We enrolled 14 individuals with advanced proliferative diabetic retinopathy. Six had type 1 diabetes and 8 had type 2 diabetes. All subjects had active preretinal neovascularization despite previous panretinal photocoagulation (2000-3000 laser burns) and had developed tractional retinal detachments involving the macula, but had no significant vitreous hemorrhage at the time of surgery. We also enrolled 14 control subjects without diabetes, 10 having surgery for idiopathic epiretinal membrane and 4 having surgery for idiopathic full-thickness macular hole. The age of the subjects with diabetes ranged from 26 to 78 years (mean 52.2 ± 13.6) and those in the control group from 58 to 78 years (mean 66.0 ± 5.7, P = .004).
Measurement of Intraocular Oxygen Tension
The measurement of intraocular oxygen tensions was completed within approximately 5 minutes in each subject. Except for an entry-site break in 1 subject, not directly associated with the use of the oxygen probe, there were no adverse events. To determine the test-retest variability in vivo and to identify any artefactual disturbance of intraocular oxygen tension caused by the measurement technique itself, we compared the mid-vitreous oxygen tension measurement at the start and the completion of the process and found the 2 values to be highly correlated (Pearson r = 0.94, P = .0001). Because the oxygen tension measured at the retinal surface superior to the superotemporal arcade was very similar to that temporal to the macula in each group, we used the mean of the 2 values to indicate preretinal oxygen tension at the posterior pole. The mean oxygen tension in the mid-vitreous was 46% lower in diabetic subjects than in control subjects (6.03 ± 1.08 mm Hg vs 11.12 ± 1.67 mm Hg, P = .017) and the oxygen tension in the anterior vitreous was 47% lower in diabetic subjects (5.6 ± 1.03 mm Hg vs 10.69 ± 1.82 mm Hg, P = .023). In contrast, we found that the mean oxygen tension at the retinal surface of the posterior pole was 37% higher in diabetic subjects than in control subjects (15.42 ± 2.55 vs 9.78 ± 0.64, P = .039). Within the group of control subjects we found no significant difference in preretinal oxygen tension between the posterior pole and the mid-periphery (9.78 ± 0.64 mm Hg vs 8.73 ± 0.54 mm Hg, P = .39). In contrast, within the group of diabetic subjects the mean oxygen tension at the posterior pole was 47% higher than in the mid-periphery (15.42 ± 2.55 vs 8.22 ± 1.34, P = .024; Figure ).
Cytokine Analysis
We detected the presence of 35 of the 42 cytokines tested in the vitreous and plasma samples using multiplex cytokine arrays. IL-4, IL-13, TGF-α, and TNF-β were not detectable in vitreous or in plasma samples. The concentrations of PDGF-AA, PDGF-AB, and RANTES were greater than could be quantified with reference to the standard curve. We measured significantly greater vitreous concentrations of eotaxin, Flt-3L, GRO, IL-6, IL-8, IP-10 (CCL22), MDC, and VEGF in the subjects with diabetes compared to controls. With the exceptions of eotaxin, MDC, and GRO, these cytokines were present at higher concentrations in the vitreous than in the corresponding plasma. IL-9 was the only cytokine found to be significantly reduced in the diabetic vitreous compared with the control vitreous. The other tested cytokines were present in similar concentrations in diabetes and control subjects, or at concentrations below the detection limit of the assay ( Supplemental Table 1 , available at AJO.com ).
Correlation of Intraocular Oxygen Tensions and Vitreous Cytokine Concentrations
To explore the hypothesis that retinal oxygenation influences the profiles of cytokines present in the vitreous, we investigated the correlation of vitreous cytokine concentrations with intraocular oxygen tensions. We identified a positive correlation between the preretinal oxygen tension at the posterior pole and the vitreous concentration of VEGF. This correlation was highly significant when including both diabetic and control subjects (Spearman r = 0.61, P = .002), and indicated a strong trend to statistical significance when the analysis is restricted to subjects with diabetic retinopathy alone (r = 0.56, P = .07). We found no correlation between mid-vitreous oxygen tension and the concentration of VEGF (r = 0.33, P = .35) or any cytokine measured, but did identify a significant positive correlation between concentrations of the cytokines VEGF and MCP-1 (r = 0.75, P = .002) and between G-CSF and GRO (r = 0.78, P = .001, see Supplemental Table 2 , available at AJO.com ).
Stay updated, free articles. Join our Telegram channel

Full access? Get Clinical Tree


