Purpose
To investigate the correlation between the inner-retinal irregularity index and visual outcomes before and after idiopathic epiretinal membrane (ERM) surgery.
Design
Retrospective cohort study.
Methods
We analyzed 66 eyes of 66 patients with idiopathic ERM. Ophthalmic examinations included best-corrected visual acuity (BCVA) measurements, metamorphopsia assessment, and spectral-domain optical coherence tomography before surgery and 1, 3, and 6 months post-surgery. Correlations between the inner-retinal irregularity index, defined as the length ratio between the inner plexiform layer and retinal pigment epithelium, and visual outcomes before and after ERM surgery were evaluated and compared with the correlation between the central foveal thickness, ganglion cell–inner plexiform layer (GC-IPL) thickness, interdigitation zone defect, and visual outcomes.
Results
Inner-retinal irregularity index and central foveal thickness were significantly correlated with BCVA and metamorphopsia at each follow-up examination (all P < .05). The interdigitation zone defect correlated with BCVA at 3 and 6 months post-surgery ( P < .001 and P < .015, respectively). However, GC-IPL thickness was not correlated with visual outcomes at any follow-up examination. The preoperative interdigitation zone defect was correlated with 6-month BCVA ( P = .035) and the preoperative inner-retinal irregularity index was significantly correlated with the 6-month BCVA and marginally correlated with the 6-month metamorphopsia ( P = .018 and P = .097, respectively).
Conclusion
The inner-retinal irregularity index was significantly correlated with visual outcomes before and after ERM surgery. This index can be used as a new surrogate marker for inner-retinal damage and a predictive prognostic marker in ERM.
Epiretinal membrane (ERM) is a common macular disorder characterized by fibrocellular proliferation on the inner retinal surface causing decreased or distorted central vision. To improve visual function in patients with ERM, surgical removal is recommended as a standard treatment resulting in favorable visual outcomes. However, even with successful ERM surgeries, good visual outcomes are not always observed. As such, surgery is determined based on an ophthalmologist’s clinical decision making in the face of a variety of ERM disease patterns. Therefore, many studies have investigated predictive prognostic factors for the visual outcome after ERM surgery.
With the introduction of optical coherence tomography (OCT), microstructural analysis of the retina has become possible. In ERM, qualitative or quantitative change of the outer retina, which includes the ellipsoid zone (previously photoreceptor inner segment and outer segment junction) and the interdigitation zone (previously cone outer segment tip, or COST), and central foveal thickness (CFT), which reflects the entire retina, have been correlated with visual outcomes in multiple studies. Our group has also previously shown that early postoperative macular thickness measured by time-domain OCT correlates with visual prognosis and that photoreceptor status is significantly associated with surgical outcomes in patients with ERM. However, because the main mechanism of ERM involves wrinkling of the inner retinal layer caused by tangential traction, such analysis of the outer retina alone has limitations in predicting and explaining the visual prognosis of ERM.
Recently, multiple studies explaining the visual prognosis of ERM, which causes retinal ganglion or inner nuclear layer (INL) cell damage owing to the inner retinal layer wrinkling, through inner-retinal thickness or ganglion cell–inner plexiform layer (GC-IPL) thickness have been reported. However, because the parameters used in those studies were measured using autosegmentation, their accuracy, reliability, and repeatability are questionable; moreover, since reports on the inaccuracy of the parameters have been made, the utility of such parameters has become controversial.
Therefore, the purpose of the present study was to investigate the correlation between the inner-retinal layer irregularity index—a parameter that we hypothesized as being directly associated with the disease mechanism and reflecting inner-retinal layer change—and visual outcomes before and after ERM surgery. Moreover, through comparison with other previously used parameters, including CFT, interdigitation zone defect (which is known as the most sensitive marker of outer retinal layer), and GC-IPL thickness, we aimed to show the effectiveness of the inner-retinal irregularity index as a predictive prognostic marker in patients with ERM.
Methods
The institutional review board of Seoul National University Bundang Hospital approved the study (IRB No.: SNUBH B-1511-324-114), which was conducted in accordance with the tenets of the Declaration of Helsinki.
Patient Selection
Retrospective medical chart review was performed for 108 consecutive patients with ERM who were followed for longer than 6 months after ERM surgery at Seoul National University Bundang Hospital between January 1, 2013 and December 31, 2014. ERM was diagnosed clinically by fundus examination with slit-lamp examination or indirect ophthalmoscopy, fundus photography, and spectral-domain OCT (SDOCT) examination. Only patients with idiopathic ERM were included in this study. Patients were excluded if they had ERM in both eyes or a secondary ERM (eg, history of trauma [n = 2], retinal detachment surgery [n = 4], uveitis [n = 2], history of laser treatment [n = 4]). Patients with axial length (AL) greater than 26 mm or myopia greater than −6.0 diopters (n = 6), diabetic retinopathy (n = 5), macular degeneration or other maculopathy (n = 4), coexisting macular hole (n = 3), or glaucoma (n = 0) were also excluded. Because visual outcome after ERM surgery may be confounded by the progression of cataracts or their removal over the course of this study, patients with cataracts of Emery-Little classification grade II or higher (n = 12) were also excluded. If eyes had mild cataracts preoperatively, combined cataract surgery was performed on elderly patients as a preventive approach at the surgeon’s discretion and based on the patient’s demands. Nevertheless, 5 eyes of 5 patients who received cataract surgery during the total follow-up period owing to cataract formation or progression were included in this study. Finally, 66 eyes of 66 patients with idiopathic ERM who had a contralateral normal eye were included in the analysis.
Main Outcome Measures
The main outcome measures were (1) correlation between the inner-retinal irregularity index and visual outcomes before and after ERM surgery; and (2) prediction of 6-month visual outcomes based on the preoperative inner-retinal irregularity index. Visual outcomes were defined as the best-corrected visual acuity (BCVA) and metamorphopsia.
Ocular Examination and Data
All patients underwent comprehensive ophthalmologic examination before surgery and at 1, 3, and 6 months after surgery. Examinations included measurement of the BCVA, metamorphopsia, intraocular pressure, noncycloplegic refraction (Autorefractor KR-8900; Topcon Corp, Tokyo, Japan), and AL (Axis II PR; Quantel Medical, Inc, Bozeman, Montana, USA). Slit-lamp biomicroscopy, indirect fundus examination, fundus photography (Vx-10; Kowa Optimed, Tokyo, Japan), fluorescein angiography (FA) (Vx-10; Kowa Optimed), and SDOCT (Spectralis OCT; Heidelberg Engineering Inc, Heidelberg, Germany) were performed. Among them, AL and FA were performed only before surgery and the other measurements were performed at each follow-up time point. The BCVA measurements were made using a Snellen chart and were converted to the logarithm of the minimal angle resolution (logMAR) unit for statistical analysis. The severity of the metamorphopsia was quantified with the M-chart (M-CHARTS; Inami Co, Tokyo, Japan). The scores for metamorphopsia for horizontal lines and metamorphopsia for vertical lines were measured separately, and the mean of the 2 scores was used for statistical analysis. We also used a value of 2.0 for a metamorphopsia score >2.0 for the statistical analysis.
Optical Coherence Tomography Evaluation
The same SDOCT device was used in all cases. For all the patients, horizontal and vertical scans at maximal resolution were performed through the fovea. The eye-tracking system and automatic software were used to detect and maintain the same scanning position through the fovea, ensuring that the follow-up scans would be performed at precisely the same location. We confirmed the location and position of the scans with simultaneous real-time scanning laser ophthalmoscope infrared images of the retina. Additionally, the fovea was scanned, and the sections through the fovea were confirmed by the presence of the foveal bulge, foveal depression, and thinning of the inner retinal layer on SDOCT. Using the SDOCT images obtained as such, we defined the inner-retinal irregularity index, which is newly described in the present study, along with macular GC-IPL thickness, interdigitation zone defect, and CFT, as predictive prognostic markers for ERM, and we evaluated the markers qualitatively and quantitatively.
The GC-IPL thickness was calculated as the sum of separately measured thickness of the GC layer and the IPL. Segmentation of the GC layer and the IPL was performed manually by transferring the points of the 2 borders of the retina obtained automatically to GC layer borders and IPL borders, respectively. This segmentation process was performed in 25 horizontal scans with 6.1 mm of length separated by 250 μm. The thicknesses were then obtained automatically in all quadrants of a circle area with a diameter of 1–3 mm centered on the fovea, and averaged. CFT was defined as the mean retinal thickness within the central 1-mm zone of the Early Treatment Diabetic Retinopathy Study (ETDRS) grid. This value was calculated automatically by the OCT software used for the evaluation. Horizontal and vertical foveal B-scans were used for analysis of the interdigitation zone defect. When a loss of integrity was observed, we measured the length of the interdigitation zone defect size ( Supplemental Figure 1 ; Supplemental Material available at AJO.com ).
Inner-Retinal Irregularity Index Measurement
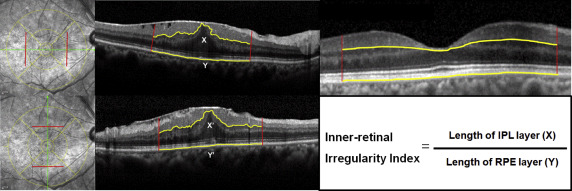
The inner-retinal irregularity index was defined as the value that was calculated by dividing the length of the inferior border of the IPL by the length of the retinal pigment epithelium (RPE) layer. The inner-retinal irregularity index uses the length of the inferior border of the IPL (an inner retinal layer that can be easily assessed owing to its clear contrast differences with the inner nuclear layer and can best represent the overall state of the inner retinal layers because of its anatomic location), which corresponds to the circle area of the ETDRS grid with a diameter of 3 mm centered on the fovea, as the target line. To minimize interindividual variations, the length of the RPE was set as the reference line (because lesions rarely invade into the RPE in ERM patients, and measurements can be made easily owing to its relatively consistent contours). The lengths were measured on both the horizontal and vertical foveal B-scans, and the mean of the values obtained from the 2 scans was defined as the final inner-retinal irregularity index. As an exception, in 4 eyes with ERM that showed false results in foveal B-scans because of highly deformed retinal layers, the most compatible scan with the fovea was selected from the raster scans and the inner-retinal irregularity index was measured. To validate the compatibility of the selected scans, we also obtained measurements for the scans above and below the selected scan, and confirmed that the variability was less than 95%. To confirm the consistency of the index, measurements were also made in the subjects’ contralateral normal eyes; the index was 1.035 ± 0.013 (1.007–1.046), and the variability was below 95%, showing relatively good reliability. The detailed measurement protocol of the inner-retinal irregularity index is as follows: the OCT scans were exported from the OCT acquisition software as grayscale, compression-free, quality-preserving JPEG images. Then, the images were opened in Image J (available in the public domain at http://rsb.info.nih.gov/ij/ ) with Neuron J and frames calibrated to 400 × 400 μm. Neuron J is a semi-automated layer-tracing software package, which is a plug-in module for Image J, a free JAVA-based image analysis software package. Layer tracing is initiated by locating the beginning of the vertical line, which corresponds to the previously marked ETDRS 3-mm circle, and the tracing algorithm subsequently computes and shows the optimal path. Relatively accurate lengths are measured as outlined above; however, in some areas with low-contrast layers, the program fails to find the correct path. In such a case, tracing mode is changed to manual tracing mode to accurately measure the length of interest ( Figure 1 ).
For precise qualitative and quantitative analyses, interdigitation zone defects and inner-retinal irregularity indexes were measured separately and independently by 2 retina specialists (K.H.C., J.H.C.) who were masked to the patients’ details. If there were any discrepancies in the measurement of qualitative parameters, another senior investigator (K.H.P.) was consulted for the final decision.
Surgical Methods
All surgeries were performed by a single surgeon (K.H.P.) under 2% lidocaine sub-Tenon anesthesia. A 3-port 25 gauge transconjunctival sutureless vitrectomy using the Alcon Constellation Vision System (Alcon Surgical, Fort Worth, Texas, USA) was performed to remove the ERM. In patients with a visually significant cataract, phacoemulsification with implantation of an intraocular lens was performed before the transconjunctival sutureless vitrectomy. A contact lens (Hoya Corp, Tokyo, Japan) was used during vitrectomy. Posterior vitreous detachment was induced with active ocutome suction over the optic disc if posterior vitreous detachment was not already present. After core vitrectomy, the ERM was removed using end-gripping forceps (Alcon, Fort Worth, Texas, USA). Internal limiting membrane (ILM) peeling was performed based on the surgeon’s discretion, with the assistance of triamcinolone acetonide in most cases and with 0.03% indocyanine green (ICG) dye (Dong In Dang Pharmaceutical, Shiheung-Si, Kyunggi-Do, Korea) staining in 6 cases. The ERM and/or ILM peeling was started at the outer region around the fovea, usually in the parafoveal area.
Statistical Analysis
All continuous variables are reported as mean ± standard deviation values. The normality of the distributions of all variables was assessed by the Shapiro-Wilk test. In the analysis of factors affecting the preoperative and postoperative visual acuity, independent t tests were used for factors with binary variables, and Pearson correlation coefficient or Spearman rank correlation coefficient were used for factors with continuous variables, depending on the normality of their distribution. To investigate the relationships between the predictive prognostic factors and BCVA or metamorphopsia according to follow-up time, the Spearman rank correlation coefficient was used for the inner-retinal irregularity index, CFT, GC-IPL thickness, and interdigitation zone defect. In addition, to conduct a more accurate analysis of whether the inner-retinal irregularity index correlated with BCVA and metamorphopsia by adjusting for the time variant, we conducted an analysis using the generalized estimated equation (GEE) model, which is known to be appropriate for the analysis of longitudinal and other correlated data. Moreover, to assess the correlation between the preoperative predictive prognostic factors and the 6-month visual outcome, multiple regression analysis was conducted.
For qualitative analysis, Cohen’s kappa coefficient was computed to evaluate interobserver agreement in determining interdigitation zone defect on SDOCT images (<0 indicated no agreement, 0–0.20 indicated slight agreement, 0.21–0.40 indicated fair agreement, 0.41–0.60 indicated moderate agreement, 0.61–0.80 indicated substantial agreement, and 0.81–1.00 indicated almost-perfect agreement). For quantitative analyses, the reliability of the inner-retinal irregularity index and interdigitation zone defect size measurement was assessed by the absolute agreement model of the intraclass correlation coefficient (ICC). A high ICC value (ICC ≥0.8) shows that there was good agreement between the investigators. Bland-Altman plot analyses were performed to see if there was any proportional bias between measurements.
In the qualitative analysis of interdigitation zone defect of macular area, the SDOCT findings had excellent interobserver agreement between the 2 investigators, with a Cohen’s kappa value of 0.891. In the quantitative analysis of the inner-retinal irregularity index and interdigitation zone defect size at each follow-up time point, the mean ICC value between the 2 investigators was 0.917 (95% confidence interval, 0.887–0.938) with a good agreement. The Bland-Altman plot for quantitative analysis showed a 95% limit of agreement of −0.009 to 0.070, with a mean difference of −0.012 μm. No significant proportional or systemic bias was observed in the interobserver agreement of quantitative data analysis ( Supplemental Figure 2 ; Supplemental Material available at AJO.com ).
Statistical analyses were performed using SPSS version 18.0 for Windows (SPSS, Inc, Chicago, Illinois, USA), and a P value <.05 was considered to indicate a statistically significant difference.
Results
This study included 66 eyes from 66 patients who were treated with ERM surgery with or without ILM peeling. Adverse events such as remaining of ERM, iatrogenic macular hole, retinal detachment, or endophthalmitis were not reported during or after the operations. Though 5 of the 66 eyes (8%) showed a recurrence of thin ERM during the 6-month follow-up period, thin ERM rarely influences inner-retinal irregularity and thus reoperations are not required. The demographics and clinical patient data are presented in Table 1 . Factors affecting the preoperative BCVA, including the age, sex, lens status, symptom duration, intraocular pressure, axial length, and refractive error, were all found to have statistically nonsignificant correlations with the preoperative BCVA; moreover, factors affecting the postoperative BCVA, including implementation of the intraoperative procedure of ERM surgery, or ILM peeling, ICG dye usage, and combined surgery, also exerted statistically nonsignificant influences on the postoperative BCVA (all P > .05). However, as ILM peeling could affect the postoperative retinal structure, subgroup analysis was performed according to ILM peeling. ILM peeling affected the interdigitation zone at 1 month after ERM surgery but it had no influence at 3 and 6 months ( Supplemental Table ; Supplemental Material available at AJO.com ). In particular, although 5 eyes (8%) underwent cataract surgeries after 4.4 ± 2.3 months from ERM surgery during the total follow-up period of the analysis dataset owing to newly formed cataracts, this did not influence the 6-month BCVA ( P = .312).
| Characteristics | ERM Patients (N = 66) | P Value |
|---|---|---|
| Factors affecting preoperative BCVA | ||
| Age (y) | 66.1 ± 7.9 (46–90) | .523 b |
| Sex (M: F) | 26 (39%): 40 (61%) | .683 a |
| Lens status (cataracts: no cataracts) d | 39 (59%): 27 (41%) | .939 a |
| Symptom duration (y) | 1.4 ± 1.7 (0.1–5) | .878 b |
| Intraocular pressure (mm Hg) | 10.7 ± 3.1 (6–19) | .526 c |
| Axial length (mm) | 23.8 ± 1.2 (22.1–25.8) | .647 c |
| Refractive error | 0.6 ± 1.9 (−5.75–3.50) | .784 c |
| Factors affecting postoperative BCVA | ||
| Intraoperative procedure of ERM surgery | ||
| ILM peeling | 32 (48%) | .273 a |
| ICG dye | 6 (9%) | .408 a |
| Combined cataract surgery | 21 (32%) | .578 a |
| Cataract surgery after ERM surgery | 5 (8%) | .312 a |
| Duration from ERM surgery to cataract surgery (mo) | 4.4 ± 2.3 (1–6) | |
a Calculated by independent t test.
b Calculated by Pearson correlation analysis.
c Calculated by Spearman rank correlation analysis.
d The presence of cataracts was considered if Emery-Little grade was >II; 6 pseudophakic eyes were included in the no cataracts status.
Change of Best-Corrected Visual Acuity, Metamorphopsia, and Predictive Prognostic Markers According to Follow-up Time After Epiretinal Membrane Surgery
Table 2 demonstrates a gradual improvement of the visual outcomes (ie, BCVA and metamorphopsia) over the 6-month period after the ERM surgery. BCVA improved from 0.354 ± 0.20 logMAR before surgery to 0.142 ± 0.108 logMAR at 6 months postoperatively, and metamorphopsia improved from 0.651 ± 0.577 before surgery to 0.377 ± 0.455 at 6 months postoperatively. The most substantial improvements in BCVA and metamorphopsia were observed at 1 month postoperatively ( P < .001 and P = .006, respectively). The inner-retinal irregularity index, CFT, and GC-IPL thickness, among the predictive prognostic markers assessed, also improved, particularly at 1 month postoperatively, showing a similar trend to the visual outcomes. The marker that showed a trend that was most similar to that of the visual outcome was the inner-retinal irregularity index; temporal changes can be seen from Figure 2 , which presents representative serial SDOCT images showing the temporal changes of the inner-retinal irregularity index after ERM surgery. The index value decreased gradually from 1.317 before surgery to 1.124 at 6 months postoperatively; the irregularity of the inferior border of the IPL also flattened in response to decreases in the index value, and such flattening of the irregularity could be easily seen by eye. In contrast to the aforementioned trends, the interdigitation zone defect was most frequently and abundantly observed 1 month after the surgery and decreased afterward. Figure 3 shows temporal changes in visual outcomes and predictive prognostic markers in a graph, and the overall trend changes can be observed easily.
| Before Surgery | 1 Month Post-Surgery | 3 Months Post-Surgery | 6 Months Post-Surgery | |
|---|---|---|---|---|
| BCVA (logMAR) | 0.35 ± 0.20 (0–0.7) | 0.21 ± 0.15 (0–0.7) | 0.18 ± 0.13 (0–0.5) | 0.14 ± 0.11 (0–0.5) |
| Metamorphopsia a | 0.65 ± 0.58 (0–2.0) | 0.49 ± 0.50 (0–2.0) | 0.42 ± 0.46 (0–2.0) | 0.38 ± 0.46 (0–2.0) |
| Inner-retinal irregularity index | 1.254 ± 0.086 (1.12–1.49) | 1.174 ± 0.070 (1.053–1.379) | 1.151 ± 0.067 (1.045–1.397) | 1.125 ± 0.054 (1.045–1.276) |
| Central foveal thickness (μm) | 440 ± 66.8 (297–615) | 375 ± 55.8 (263–503) | 360 ± 51.3 (258–469) | 353 ± 50.4 (248–466) |
| GC-IPL thickness (μm) | 52 ± 6.3 (28–65) | 49 ± 7.0 (25–62) | 47 ± 6.6 (28–59) | 47 ± 8.4 (27–58) |
| Interdigitation zone defect (n, %), (μm) | 21 (31.8%), 418 ± 138.2 (112–582) | 38 (57.6%), 474 ± 158.5 (218–624) | 28 (42.4%), 353 ± 112.1 (87–574) | 15 (23.8%), 199 ± 97.4 (68–428) |
Stay updated, free articles. Join our Telegram channel

Full access? Get Clinical Tree


