Purpose
To evaluate the effects of topically applied bevacizumab and sunitinib on experimentally induced corneal neovascularization.
Design
Experimental animal study.
Methods
Thirty-six New Zealand rabbits were involved. One eye per rabbit was used. Corneal neovascularization was induced by placing 5 silk sutures in the upper cornea. Rabbits were randomized to 1 of 3 groups (12 rabbits each): Group 1 received saline 0.9%, Group 2 bevacizumab 5 mg/mL, and Group 3 sunitinib 0.5 mg/mL. All treatments were administered 3 times daily for 14 days. Photographs were taken on a slit lamp on days 7 and 14, and angiographic photographs were taken on day 14. The area of neovascularization was measured in mm 2 , percentage of the total corneal area, and percentage of the corneal surface covered by sutures.
Results
On day 14, corneal neovascularization area in Group 1 (25.92 ± 5.08 mm 2 , 18.78% ± 3.5% of corneal surface, 105.59% ± 18.9% of corneal surface with sutures) was larger than in Groups 2 (18.52 ± 7.94 mm 2 , 13.67% ± 5.8%, 76.35% ± 33.2%) (1-way analysis of variance, P = .041) and 3 (4.57 ± 2.32 mm 2 , 3.40% ± 1.7%, 18.94% ± 9.2%)( P < .001). Neovascularization in Group 2 was larger than in Group 3 ( P < .001). Compared to saline, corneal neovascularization was inhibited 28.5% by bevacizumab and 82.3% by sunitinib. Sunitinib settled on the iris.
Conclusions
Topical administration of both bevacizumab and sunitinib inhibits corneal neovascularization in rabbits. But vascular endothelial growth factor (VEGF) pathway blockade by bevacizumab was not sufficient for a profound inhibition. Blocking both VEGF and platelet-derived growth factor pathways using sunitinib was 3-fold more effective.
Angiogenesis is the formation of new blood vessels from preexisting vascular structures. In the cornea, it is a not-infrequent consequence of various inflammatory, infectious, and traumatic corneal disorders. Corneal neovascularization, however, has the unwanted consequence of opacification of adjacent corneal tissue and thus can result in significant reduction in visual function.
Angiogenesis is a complex multistep process tightly regulated by the action of both stimulatory (angiogenic factors) and inhibitory (angiogenic inhibitors) molecules. Vascular endothelial growth factor (VEGF) appears to be 1 of the most important regulators of corneal angiogenesis. Corneal epithelial and endothelial cells, vascular endothelial cells of limbal vessels, and fibroblasts and macrophages in scar tissue all have been found to excrete VEGF, especially in inflamed and vascularized corneas. VEGF and its tyrosine kinase receptors VEGFR1 (flt-1) and, particularly, VEGFR2 (flk-1) promote many aspects of the angiogenic process. VEGF increases vascular permeability of venules and induces vascular endothelial cell mitosis and migration.
A second important regulator of angiogenesis is platelet-derived growth factor (PDGF). Newly formed vessels will regress spontaneously unless they are enveloped by pericytes, an event promoted by platelet-derived growth factor B (PDGFB). Vascular endothelial cells produce PDGFB, and the surrounding mural cells (pericytes and vascular smooth muscle cells) express platelet-derived growth factor receptor type β (PDGF receptor type β or PDGFRβ).
Bevacizumab is a monoclonal antibody that binds to VEGF with high specificity, thereby blocking VEGF-mediated signaling pathways and thus angiogenesis. Bevacizumab, approved originally for the treatment of metastatic colorectal cancer, has been used in ophthalmology (off-label) for the treatment of exudative age-related macular degeneration, proliferative diabetic retinopathy, and iris rubeosis, with promising results. Recently, topical and subconjunctival administration of bevacizumab has been reported in experimental models and in human clinical cases for inhibition or regression of corneal neovascularization. Corneal neovascularization was inhibited or regressed significantly in the above studies, although it was not completely eliminated.
Sunitinib is a small molecule receptor tyrosine kinase inhibitor with antitumor as well as antiangiogenic activity. It is approved by the US Food and Drug Administration (FDA) for use in the treatment of renal and gastrointestinal tumors. Sunitinib selectively inhibits VEGFR2 and platelet-derived growth factor receptor β phosphorylation. In ophthalmology, orally administered sunitinib was able to reduce significantly choroidal neovascularization in mice. As far as we know, there are no previous studies on topical administration of sunitinib for inhibition of corneal neovascularization or any other form of ocular angiogenesis. Inhibition of both VEGF and platelet-derived growth factor signaling could be more effective in blocking angiogenesis than targeting the VEGF system alone.
The purpose of this study was to evaluate the effect of topical administration of bevacizumab and topical administration of sunitinib in the prevention of experimentally induced corneal neovascularization in a rabbit model. With this approach, we test the hypothesis that blocking both VEGF and platelet-derived growth factor pathways using sunitinib is more effective in inhibiting corneal neovascularization than blocking the VEGF system alone using bevacizumab.
Methods
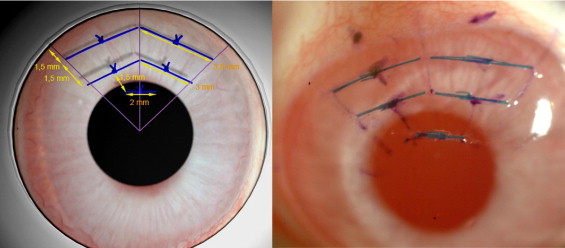
This experimental study involved 36 male 2.5-month-old New Zealand white rabbits that weighed 2.5 to 3.0 kg. Under general anesthesia induced by intramuscular injection of ketamine HCl (20 mg/kg body weight) and xylazine HCl (6 mg/kg body weight), supplemented by topical anesthesia (0.4% oxybuprocaine hydrochloride), a modification of a previously described suture technique was used to induce corneal neovascularization. In brief, 5 8-0 interrupted blue virgin silk (LorcaMarin SA, Murcia, Spain) sutures were placed at midstromal depth in the upper cornea following an inverted triangle pattern. First, the upper quarter of the cornea was traced on the epithelium with a radial keratotomy corneal marker and gentian violet. Then, the first 2 sutures were placed parallel to and 1.5 mm away from the limbus; they were approximately 3.8 mm in length. Subsequently, a second row with 2 3.0-mm-long sutures was placed parallel to and 1.5 mm away from the first row. Finally, a single 2.0-mm-long suture was placed 1.5 mm away from the second row and near the triangle vertex ( Figure 1 ). After suture placement, erythromycin ophthalmic ointment was administered 3 times a day for 1 day. To increase reproducibility, the whole process was carried out on each rabbit under the operating microscope by the same investigator (J.J.P.S.). Only 1 eye per rabbit was used.
Following suture placement, the rabbits were randomized to 1 of 3 groups: Group 1 (n = 12) received topical 0.9% saline, Group 2 (n = 12) received 5 mg/mL bevacizumab (Avastin, Roche Registration Ltd, Welwyn Garden City, UK), and Group 3 (n = 12) received 0.5 mg/mL sunitinib (Axon Medchem BV, Groningen, The Netherlands). All treatments were administered topically 3 times daily for 14 days and were started 12 hours after suturing in all groups. Bevacizumab concentration (5 mg/mL) was chosen based on previous studies to facilitate comparison. This number is approximately 224 000 times higher than the bevacizumab half maximal inhibitory concentration (IC 50 ), which is estimated to be 22.3 ng/mL in studies on VEGF-induced human umbilical vein endothelial cell (HUVEC) proliferation. Sunitinib inhibits VEGF-induced proliferation of HUVECs with an IC 50 value of 2.13 ng/mL; thus, following the same rationale as that for bevacizumab (224 000 × 2.13), a 0.5 mg/mL approximate concentration is obtained. Topical formulation of bevacizumab consisted of the intravenous solution (25 mg/mL) mixed with 0.9% sterile saline. The final formulation provided 5 mL of bevacizumab 5 mg/mL and a pH of 6.4. Topical sunitinib consisted of sunitinib malate powder (99% chemical purity) mixed with sterile saline. Final formulation provided 5 mL of sunitinib 0.5 mg/mL and a pH of 6.7. All eye drops were prepared every day before use in the hospital pharmacy and were stored at +4°C.
Just before suture placement, the dimensions of each cornea were measured so that corneal surface area could be calculated. These dimensions included horizontal and vertical corneal diameters and anterior chamber depth (ACD). Corneal diameters were measured using a caliper, and ACD using standard ultrasound biometry (Ocuscan RxP, Alcon Laboratories Inc, Fort Worth, Texas, USA). For corneal surface area calculation, we considered the shape of the cornea as a spheroidal dome, applying the straightforward spheroidal dome surface formula S = π(r 2 + h 2 ), where r represents the radius of the base (r = d/2, d = corneal diameter), h represents height of the dome (anterior chamber depth), and π = 3.14159.
All animals were evaluated by slit-lamp biomicroscopy (slit-lamp biomicroscopy study), once animals had been anesthetized as described above. Rabbit corneas were evaluated by slit-lamp biomicroscopy on the third, seventh, and 14th days. Corneal photographs were taken with ×10 magnification using a FinePrix S2Pro digital camera (Fuji Photo Film Co. Ltd, Tokyo, Japan) attached to the slit-lamp microscope (SL-D7; Topcon Corp, Tokyo, Japan). On day 3, 2 different calibrated color photographs were taken from each cornea to measure the corneal surface covered by the sutures. On days 7 and 14, 2 color and 1 red-free calibrated photographs were taken to measure the corneal surface covered with neovascular vessels. The mean value from all 3 pictures was used. Neovascularization of each cornea was evaluated by an examiner who was masked to the treatment groups. Image analysis of each photograph was performed using an image processing and analysis software program (Image-Pro Plus V.6.0; Media Cybernetics Inc, Bethesda, Maryland, USA). The corneal surface covered with neovascularization was measured on the calibrated photographs in terms of square mm, as well as the percentage of the total area of the cornea and the percentage of the corneal area covered by sutures, which might facilitate comparison with previous studies.
All animals were also evaluated by fluorescein angiography on day 14 (angiography study). Anterior segment angiography was performed after intravenous injection into the ear vein of 0.3 mL/kg of 10% fluorescein. Corneal photographs were taken between 2 and 3 minutes after fluorescein injection using a Nikon fundus camera (NFC-50; Nikon Corporation, Tokyo, Japan). Three different high-quality calibrated photographs were chosen to measure the corneal surface covered with neovascular vessels, and the mean value was used. The image analysis of each photograph was performed using the same image processing software program used for the biomicroscopy study. The corneal surface covered with neovascular vessels was measured in terms of square mm (mm 2 ), percentage of the total area of the cornea, and percentage of the corneal area covered by sutures. After measuring the area of neovascularization, the animals were killed.
A screening for adverse ocular effects was also performed by slit-lamp biomicroscopy on days 7 and 14, and any adverse effects were recorded, as well as photographed and measured if appropriate. Specifically, attention was paid to conjunctival hyperemia, corneal epitheliopathy, anterior chamber cellular reaction (number of inflammatory cells seen in a 1 × 3-mm high-powered beam), and iris and lens changes. Fundus examination was performed by indirect ophthalmoscopy before the animals were killed.
Statistical analysis was performed using SPSS software version 15.0 for Windows (SPSS, Inc, Chicago, Illinois, USA). Parametric statistical analyses were done, once the normal distribution of the data under consideration was verified by the 1-sample Kolmogorov-Smirnov procedure. Analysis was first performed on the changes over time in each group for corneal neovascularization using the paired-samples Student t test. Subsequently, group differences at specific time points for continuous variables were tested using the 1-way analysis of variance (1-way ANOVA). Levene statistic was used to test the equality of group variances in 1-way ANOVA. When the group variances were equal pairwise multiple comparisons were tested using the Tukey test, and when they were unequal using the Tamhane test. Differences were considered statistically significant when P values were less than .05.
Results
Basic Corneal Dimensions
The basic corneal dimensions and calculated corneal surface area for each group are shown in Table 1 . There were no significant differences in basic dimensions and calculated corneal surface area between groups (1-way ANOVA, P > .05). The corneal surface covered by sutures is also shown in Table 1 , with no significant differences between groups (1-way ANOVA, P = .818). These results show that corneal dimensions were similar for all groups before treatment. In addition, the amount of stimulus to induce a neovascular response in the cornea was also similar in all groups.
| Group 1 (Saline) | Group 2 (Bevacizumab) | Group 3 (Sunitinib) | 1-Way ANOVA | |
|---|---|---|---|---|
| Horizontal corneal diameter (mm) | 12.93 ± 0.22 | 12.80 ± 0.25 | 12.82 ± 0.16 | P = .270 |
| Vertical corneal diameter (mm) | 12.03 ± 0.33 | 11.83 ± 0.38 | 11.90 ± 0.16 | P = .292 |
| Mean corneal diameter (mm) | 12.48 ± 0.22 | 12.31 ± 0.29 | 12.36 ± 0.10 | P = .183 |
| Corneal radius (mm) | 6.24 ± 0.11 | 6.15 ± 0.14 | 6.18 ± 0.06 | P = .183 |
| Anterior chamber depth (mm) | 2.22 ± 0.23 | 2.32 ± 0.23 | 2.12 ± 0.07 | P = .050 |
| Corneal surface area (mm 2 ) | 138.1 ± 6.6 | 136.3 ± 7.4 | 134.2 ± 2.8 | P = .290 |
| Corneal surface covered by sutures (mm 2 ) | 24.63 ± 2.48 | 24.37 ± 2.23 | 24.04 ± 2.05 | P = .818 |
Corneal Neovascularization by Slit-Lamp Biomicroscopy
The corneal surface covered with neovascularization measured on the calibrated photographs is shown in Tables 2 and 3 in terms of square mm, percentage of the total area of the cornea, and percentage of the corneal area covered by sutures, for all 3 groups.
| Group 1 (Saline) | Group 2 (Bevacizumab) | Group 3 (Sunitinib) | 1-Way ANOVA | |
|---|---|---|---|---|
| Square mm | 16.96 ± 2.51 | 11.38 ± 4.47 | 2.46 ± 0.90 | P < .001 |
| Percentage of neovascularized area to total corneal area | 12.31 ± 1.9 | 8.39 ± 3.2 | 1.82 ± 0.6 | P < .001 |
| Percentage of neovascularized area to corneal area covered by sutures | 69.18 ± 9.7 | 46.65 ± 18.4 | 10.11 ± 3.2 | P < .001 |
| Inhibition rate | 0% | 33% | 85.5% |
| Group 1 (Saline) | Group 2 (Bevacizumab) | Group 3 (Sunitinib) | 1-Way ANOVA | |
|---|---|---|---|---|
| Square mm | 25.92 ± 5.08 | 18.52 ± 7.94 | 4.57 ± 2.32 | P < .001 |
| Percentage of neovascularized area to total corneal area | 18.78 ± 3.5 | 13.67 ± 5.8 | 3.40 ± 1.7 | P < .001 |
| Percentage of neovascularized area to corneal area covered by sutures | 105.59 ± 18.9 | 76.35 ± 33.2 | 18.94 ± 9.2 | P < .001 |
| Inhibition rate | 0% | 28.5% | 82.3% |
In Group 1 (saline), corneal neovascularization area on the seventh day was 16.96 ± 2.51 mm 2 , which represents 12.31% ± 1.9% of total corneal surface and 69.18% ± 9.7% of all corneal surface covered by sutures. The corneal neovascular area increased significantly up to 25.92 ± 5.08 mm 2 on day 14 (paired-samples t test, P < .001), which represents 18.78% ± 3.5% ( P < .001) of total corneal surface and 105.59% ± 18.9% ( P < .001) of corneal surface covered by sutures. These results show that the corneal surface covered with neovascular vessels increases over time in Group 1, and 14 days are more than enough for the new vessels to cover all the stimulating area (corneal surface covered by sutures).
In Group 2 (bevacizumab), corneal neovascularization area on the seventh day was 11.38 ± 4.47 mm 2 (8.39% ± 3.2% of total corneal surface, 46.65% ± 18.4% of corneal surface covered by sutures). The neovascular area also increased significantly up to 18.52 ± 7.94 mm 2 on day 14 (paired-samples t test, P < .001) (13.67% ± 5.8% of total corneal surface and 76.35% ± 33.2% of corneal surface covered by sutures) ( P < .001). Therefore, the corneal surface covered with new vessels increases over time, but at 14 days only 76.35% of the stimulating area was covered by neovascular tissue.
In Group 3 (sunitinib), corneal neovascularization area on the seventh day was 2.46 ± 0.90 mm 2 (1.82% ± 0.6% of total corneal surface, 10.11% ± 3.2% of corneal surface covered by sutures). The corneal neovascular area also increased significantly, up to 4.57 ± 2.32 mm 2 on day 14 (paired-samples t test, P = .002) (3.40% ± 1.7% of total corneal surface and 18.94% ± 9.2% of corneal surface covered by sutures) ( P = .001). The corneal surface covered with new vessels also increased over time in this group, but on day 14 only 18.94% of the stimulating area was covered by new vessels.
Seven days after treatment onset, corneal neovascularization area (in terms of square mm) in Group 1 was larger than in Groups 2 (1-way ANOVA, P = .005) and 3 ( P < .001). Similarly, neovascularization area in Group 2 was significantly larger than in Group 3 ( P < .001). Therefore, in comparison with saline, corneal neovascularization was inhibited 33% by bevacizumab and 85.5% by sunitinib. Fourteen days after onset of treatment, corneal neovascularization area in Group 1 was also larger than in Groups 2 (1-way ANOVA, P = .041) and 3 ( P < .001). Neovascularization area in Group 2 was also significantly larger than in Group 3 ( P < .001). Therefore, in comparison with saline, corneal neovascularization was inhibited 28.5% by bevacizumab on the 14th day and 82.3% by sunitinib ( Figure 2 ).
Stay updated, free articles. Join our Telegram channel

Full access? Get Clinical Tree


