Purpose
To examine whether intraocular lens (IOL) power prediction error (PE) after cataract surgery differs according to patient age.
Design
Prospective cohort study.
Methods
We consecutively enrolled 75 eyes of 75 patients 59 years of age or younger, and 150 eyes of 150 patients in each of 3 age groups (60–69, 70–79, and 80–89 years), for whom phacoemulsification and implantation of a single-piece acrylic IOL was planned. The IOL power was calculated using the optimized SRK/T formula. Objective refraction was measured using an autorefractometer at approximately 3 months postoperatively, and the mean arithmetic PE and median absolute PE were compared among age groups.
Results
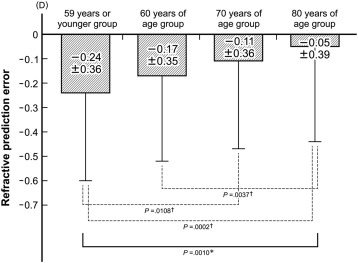
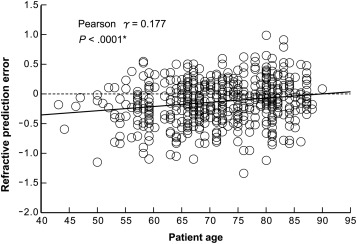
The mean preoperative refractive error predicted by the SRK/T formula was similar among age groups ( P = .4179). The mean postoperative spherical equivalent was significantly more myopic in younger patients ( P < .0001). Mean PE was −0.24 diopters (D) in those ≤59 years of age, −0.17 D in those 60–69 years of age, −0.11 D in those 70–79 years of age, and −0.05 D in those 80–89 years of age; the mean PE was less myopic in older patients ( P = .0008). The median absolute PE did not differ significantly among groups ( P = .6192). Mean PE was positively correlated with age ( P < .0001). Multiple regression analysis revealed that age, preoperative axial length, average corneal curvature, and anterior chamber depth were independent predictors of the age-related difference in PE.
Conclusion
PE was less myopic by approximately 0.06 D per decade as age increased, suggesting that patient age should be considered when selecting IOL power.
Refractive prediction error (PE) is the most common complication after cataract extraction and intraocular lens (IOL) implantation surgery. Although advances in precise ocular biometry measurements and IOL power calculation formulas have substantially improved refractive outcomes, PE remains a major concern in cataract surgery. Ophthalmic surgeons continue to work to improve the accuracy of IOL power calculations.
The IOL power is primarily determined by axial length (AL), corneal curvature, and estimated postoperative anterior chamber depth (ACD), which is now referred to as “effective lens position.” Several studies have demonstrated that the use of standard formulas, including the SRK/T formula, to calculate IOL power leads to greater PE values in eyes with a short, long, or extremely long AL ; in eyes with a steep or flat corneal curvature ; and in eyes for which it is difficult to obtain a precise estimate of the effective lens position. Furthermore, ocular biometry, including AL, corneal curvature, and ACD, change with increasing age. These findings suggest that PE after cataract surgery differs according to the patient’s age. Only 1 study to date, by Nuzzi and associates, however, has demonstrated that both mean arithmetic PE and mean absolute PE increase with patient age.
The purpose of the present study was to examine whether PE after cataract surgery differs according to patient age at the time of surgery. When PE was found to differ according to age, independent significant predictors of the age-related difference were evaluated.
Methods
Study Design
This was a prospective cohort study. This study was performed in a single center at the Hayashi Eye Hospital, Fukuoka, Japan, from January 5, 2015 to December 15, 2015. The study adhered to the tenets of the Declaration of Helsinki. The Institutional Review Board/Ethics Committee of the Hayashi Eye Hospital approved the study protocol, and informed consent to participate in the study was obtained from all participants after detailed explanation of the nature of the study.
Patients
A clinical research coordinator began screening all consecutive patients scheduled for cataract surgery at the Hayashi Eye Hospital on January 5, 2015. Only eyes undergoing their first cataract surgery by a single surgeon (K.H.) were included in the study, and eyes that had been included in other studies were excluded. Major inclusion criteria were as follows: eyes that were to undergo phacoemulsification surgery with single-piece hydrophobic acrylic IOL implantation, eyes without extremely short or long AL (<20.5 or >26.5 mm, respectively), and eyes that were targeted for emmetropia. Exclusion criteria were eyes in which AL could not be measured by swept-source optical coherence tomography (IOLMaster 700, version 1.14; Carl Zeiss Meditec AG, Jena, Germany); eyes with pathology of the cornea, vitreous, or macula; eyes scheduled for extracapsular or intracapsular cataract extraction; history of previous ocular surgery or inflammation; eyes with pseudoexfoliation syndrome; eyes with a pupil diameter <4.0 mm after mydriasis; eyes with distance-corrected visual acuity of 20/30 or worse; patient refusal; and any anticipated difficulties with examination or follow-up. Patient recruitment was continued until 150 eyes were enrolled in each of the 3 age groups of 60–69 years, 70–79 years, and 80–89 years and, owing to the scarcity of patients 59 years or younger, until 75 eyes were enrolled in the ≤59 years of age group.
Intraocular Lens Power Calculation
Preoperative AL was measured using the IOLMaster 700. Preoperative corneal curvature at the steepest and flattest meridians was measured using an autorefractometer/keratometer (Tonoref II, version 1.17; Nidek, Gamagori, Japan), and the average value of these meridians (average K value) was used for the IOL power calculation. The IOL power was calculated using the SRK/T formula with the optimized A-constants. The single-piece hydrophobic acrylic IOL implanted was the AcrySof SN60WF (Alcon Laboratories, Ft. Worth, Texas, USA). The optimized A-constant was determined according to the AL based on our previous data ; the A-constant was 119.19 when the AL was shorter than 26.00 mm and 119.50 when the AL was 26.01 mm or longer.
Surgical Procedures
A single surgeon (K.H.) performed all of the surgeries using essentially the same procedure described previously. First, a continuous curvilinear capsulorrhexis measuring approximately 5.0 mm in diameter was accomplished using a bent needle through a 0.6-mm side port. After continuous curvilinear capsulorrhexis, a single-plane clear corneal incision was made using a 2.4-mm stainless steel keratome (Alcon Laboratories). After thorough hydrodissection, endocapsular phacoemulsification of the nucleus and aspiration of the residual cortex were performed. The clear corneal wound was not enlarged for implantation of the SN60WF. The lens capsule was inflated with 1% sodium hyaluronate (Healon; AMO, Santa Ana, California, USA or Hyaguard; Nitten Co Ltd, Nagoya, Japan), after which the IOL was placed into the capsular bag using a Monarch II IOL injector (Alcon Laboratories). After IOL insertion, the viscoelastic material was thoroughly evacuated. No sutures were placed in any case.
Outcome Measures
All enrolled eyes were examined preoperatively and at approximately 3 months postoperatively. Refractive spherical and cylindrical powers were measured objectively using the Tonoref II. Manifest spherical equivalent value was determined as the spherical power plus half the cylindrical power. The arithmetic PE after cataract surgery was defined as the difference between the postoperative stable manifest spherical equivalent value and preoperative refractive error predicted by the SRK/T formula (preoperative target refraction). The median absolute PE was also calculated.
The vector (magnitude and meridian) of the regular corneal astigmatism was determined using the Tonoref II. The regular astigmatism vector was decomposed into vertical/horizontal (J 0 ) and oblique (J 45 ) components using the power vector analysis described by Thibos and Horner. The power vector analysis shows the vertical (90 degrees)/horizontal (180 degrees) regular astigmatic component as the J 0 and the oblique (45 degrees and 135 degrees) components as the J 45 . ACD was also measured using the IOLMaster 700. ACD was the distance between central corneal epithelium and the IOL surface. The simulated K value was also measured by videokeratography with the Topographic Modeling System-4 (TMS-4, version 4.3B; Tomey, Nagoya, Japan). All examinations were performed by experienced ophthalmic technicians unaware of the purpose of the study.
Statistical Analysis
Data regarding arithmetic PE, absolute PE, preoperative target refraction, manifest spherical equivalent value, average K value, AL, ACD, and other continuous variables were tested for normality of distribution by visual inspection of histograms. Because the arithmetic PE, preoperative target refraction, manifest spherical equivalent value, average K value, AL, ACD, and other continuous variables, except for absolute PE, were normally distributed, these continuous variables were compared among age groups by analysis of variance. Absolute PE was not normally distributed, and, therefore, the absolute PE was compared among age groups using the Kruskal-Wallis test. Categorical variables were compared among age groups using the χ 2 goodness-of-fit test. When a statistically significant difference was detected in the arithmetic PE, preoperative target refraction, manifest spherical equivalent value, average K value, AL, ACD, and other continuous variables, the difference between each age group pair was compared using the unpaired t test for these continuous variables and the χ 2 or Fisher exact test for categorical variables with Bonferroni adjustment. Simple correlations between PE and patient age, AL, ACD, average K value, and other variables, and between patient age and the AL, ACD, and average K value, were examined using the Pearson correlation analysis. To identify the independent significant predictors of an age effect on the PE, a multiple linear regression analysis was performed. Seven possible variables were entered into this analysis. Any differences with a P value of less than .05 were considered statistically significant.
Results
The 525 enrolled patients underwent all scheduled examinations. Mean patient age at the time of surgery (± standard deviation [SD]) was 71.6 ± 9.3 years, and there were 347 women (66.1%). The patient characteristics at baseline in the 4 age groups are shown in Table 1 . The 4 age groups did not differ significantly with regard to the ratio of left and right eyes, sex, corneal astigmatism, or elapsed time between surgery and examinations. The preoperative manifest spherical equivalent value was significantly less myopic with increasing age ( P < .0001).
| Characteristic | Age Group | P Value | |||
|---|---|---|---|---|---|
| ≤59 Years | 60–69 Years | 70–79 Years | 80–89 Years | ||
| Age | 56.1 ± 3.7 | 66.1 ± 2.1 | 73.9 ± 2.8 | 82.6 ± 2.4 | <.0001 a |
| Sex (male/female) | 30/45 | 38/112 | 54/96 | 56/94 | .0591 |
| Left/right eyes | 35/45 | 77/73 | 73/77 | 74/76 | .9232 |
| Corneal astigmatism (D) | −0.75 ± 0.47 | −0.71 ± 0.50 | −0.75 ± 0.47 | −0.81 ± 0.52 | .3697 |
| MRSE (D) | −2.18 ± 2.86 | −1.19 ± 3.22 | −0.27 ± 1.91 | −0.00 ± 1.33 | <.0001 a |
| Time interval b | 3.20 ± 0.40 | 3.19 ± 0.40 | 3.22 ± 0.42 | 3.17 ± 0.38 | .7894 |
a Statistically significant difference among the age groups.
Preoperatively, the mean preoperative target refraction was similar among the 4 age groups ( P = .4763; Table 2 ). At approximately 3 months postoperatively, the mean spherical and cylindrical refractive power values were increased according to age ( P < .0001). The mean postoperative manifest spherical equivalent value was less myopic with an increase in age ( P = .0102; Table 2 ). The mean arithmetic PE was less myopic by approximately 0.06 diopter (D) per decade of increased age ( P = .0010; Figure 1 ). Comparison of each age group pair revealed that PE differed significantly between the ≤59 years of age group and the 80–89 years of age group ( P = .0002), between the ≤59 years of age group and the 70–79 years of age group ( P = .0108), and between the 60–69 years of age group and the 80–89 years of age group ( P = .0037). The median absolute PE did not differ significantly among age groups ( P = .6192; Table 2 ). Simple correlation analysis revealed that the arithmetic PE was significantly associated with increased age (Pearson r = 0.177, P < .0001; Figure 2 ). The PE was also significantly associated with the preoperative average K value and the J 0 component (Pearson r = 0.248 and 0.144, P < .0001 and P = .0009, respectively), while the PE was not significantly associated with the preoperative AL, preoperative ACD, preoperative corneal astigmatism, or the J 45 component ( P ≤ .1497).
| Parameter | Age Group | P Value | |||
|---|---|---|---|---|---|
| ≤59 Years | 60–69 Years | 70–79 Years | 80–89 Years | ||
| Preoperative target refraction (D) | −0.28 ± 0.15 | −0.31 ± 0.15 | −0.31 ± 0.15 | −0.31 ± 0.18 | .4763 |
| Postoperative MRSE (D) | −0.52 ± 0.39 | −0.48 ± 0.36 | −0.42 ± 0.38 | −0.36 ± 0.39 | .0102 a |
| PE (D) | −0.24 ± 0.36 | −0.17 ± 0.35 | −0.11 ± 0.36 | −0.05 ± 0.39 | .0010 a |
| Range | −1.16 to 0.56 | −1.11 to 0.52 | −1.34 to 0.63 | −1.71 to 1.00 | – |
| Median absolute PE (D) | 0.26 | 0.27 | 0.24 | 0.23 | .6192 b |
a Statistically significant difference among the age groups compared using the analysis of variance.
b Compared among the age groups using the Kruskal-Wallis test.
Preoperatively, the mean AL was significantly shorter with increasing age, and the ACD became shallower with increasing age ( P < .0001; Table 3 ), while the average K value did not differ significantly among age groups ( P = .1886). Mean corneal astigmatism and the J 45 component did not differ significantly among age groups ( P ≥ .3697), while the J 0 component changed significantly from a with-the-rule astigmatism to an against-the-rule astigmatism with increasing age ( P < .0001). Simple correlation analysis revealed that AL and ACD were negatively associated with age ( P < .0001), while the average K value was weakly positively associated with age ( P = .0217).


