Purpose
To compare the detection rates of identifying the posterior border of the sclera and lamina cribrosa and measurement reproducibility of scleral and laminar thicknesses using the enhanced depth imaging (EDI) of Heidelberg Spectralis optical coherence tomography (OCT) and swept-source OCT.
Design
Cross-sectional design.
Methods
Both EDI-OCT and swept-source OCT images were obtained in 32 myopic glaucoma patients. Subfoveal choroidal, subfoveal scleral, and central laminar thicknesses were measured from obtained B-scan images. Each measurement was performed at 3 locations by 2 masked observers. The detection rates and measurement reproducibility were evaluated from selected B-scans.
Results
The posterior border of the sclera was visible in 10 eyes (31%) using EDI-OCT. This was improved to be visible in 17 eyes (53%) using swept-source OCT. According to the McNemar χ 2 test, the detection rate of the posterior border of the sclera was significantly different between EDI-OCT and swept-source OCT ( P = 0.008). The detection rate of the posterior border of the lamina cribrosa was similar for the 2 devices. In highly myopic eyes, the detection rate of the posterior border of the sclera and lamina cribrosa was not statistically different between EDI-OCT and swept-source OCT. Intersystem ICCs was 0.769 (95% CI, 0.714–0.893) for subfoveal scleral thickness and 0.900 (95% CI, 0.887–0.917) for laminar thickness. The mean subfoveal scleral thickness was 464.32 ± 213.24 μm using EDI-OCT and 650.26 ± 222.30 μm using swept-source OCT. There was statistical difference in the measured subfoveal scleral thickness by the 2 devices ( P = 0.018).
Conclusions
Compared with EDI-OCT, swept-source OCT had an advantage in imaging the posterior sclera. Imaging the lamina cribrosa was similar when using both devices.
Structural changes of the optic nerve head (ONH) are important in the pathogenesis of glaucoma. Growing evidence suggests that the lamina cribrosa and sclera both contribute to ONH changes. Previous studies of the lamina cribrosa and sclera of the human eye involved only histologic examination of human eyes during autopsy. For example, the Jonas group investigated the lamina cribrosa and posterior sclera in terms of histology. Although this work provided valuable information regarding the structure of the posterior segment of the eye, the examinations were performed after postmortem and postenucleation changes, so the results may have been influenced by deformation during fixation and sectioning. To increase our understanding of the contribution of the lamina cribrosa and sclera to glaucoma, there are increasing needs to image these structures in vivo.
Optical coherence tomography (OCT) is used primarily to measure the retinal nerve fiber layer and assess the optic disc in glaucoma. Recent advances in OCT have enabled imaging of deeper layers of the ONH, including the lamina cribrosa and sclera. Two instruments are currently commercially available to image deep ocular tissue: the enhanced-depth imaging technique of the Heidelberg spectral-domain OCT (EDI-OCT) and swept-source OCT. Measurement of the laminar thickness by EDI-OCT is reported to display good interobserver and intervisit reproducibility. Swept-source OCT has a longer central wavelength, improving its tissue penetration compared to conventional spectral-domain OCT instruments. With deeper penetration, the sclera and retrobulbar structures around the ONH may be visible by swept-source OCT. The EDI-OCT and swept-source OCT measurements display good correlation between choroidal thicknesses and good reproducibility between devices. However, no comparison of the imaging techniques in terms of visualizing the lamina cribrosa and sclera has been reported. Here, we investigated the reproducibility of thickness measurements of the sclera and lamina cribrosa in myopic glaucoma eyes using EDI-OCT and swept-source OCT. This may further expand our understanding of the important clinical implications of these devices for glaucoma studies.
Methods
This prospective study followed all guidelines for experimental investigation in human subjects required by the Institutional Review Board of Seoul St. Mary’s Hospital and tenets of the Declaration of Helsinki. Participating in the study were 33 patients with myopic open-angle glaucoma (33 eyes), who participated after providing informed consent. Swept-source OCT (DRI-OCT system; Topcon, Tokyo, Japan) and EDI-OCT (Spectralis; Heidelberg Engineering, Heidelberg, Germany) images were obtained simultaneously at the Seoul St. Mary’s Hospital, Seoul, South Korea. All examinations were obtained within a 1-month period.
Each participant underwent comprehensive ophthalmic assessment, including the measurement of best-corrected visual acuity, slit-lamp biomicroscopy, Goldmann applanation tonometry, dilated stereoscopic examination of the ONH and fundus, color disc photography, red-free retinal nerve fiber layer (RNFL) photography (VX-10; Kowa Optimed, Tokyo, Japan); achromatic automated perimetry using the 24-2 Swedish Interactive Threshold Algorithm standard program (Humphrey Visual Field Analyzer; Carl Zeiss-Meditec Dublin, CA, USA); and Cirrus HD-OCT (Carl Zeiss Meditec). Central corneal thickness and axial length were measured using ultrasound pachymetry (Tomey, Nagoya, Japan) and ocular biometry (IOL Master; Carl Zeiss Meditec). Experienced ophthalmologists performed both SS-OCT and EDI-OCT. Both OCTs were performed with full pupil dilation.
All eyes investigated required a best-corrected visual acuity of ≥20/40. Eyes with axial lengths longer than 30 mm were excluded. Those with intraocular disease or neurologic disease that could cause visual field loss were excluded. Eyes with consistently unreliable visual fields (defined as false-negative >25%; false-positive >25%; and fixation losses >20%) were also excluded.
Glaucoma was defined as the presence of an abnormal glaucomatous optic disc (diffuse or focal thinning of the neuroretinal rim) and an abnormal visual field consistent with glaucoma. A glaucomatous visual field change was defined as the consistent presence of a cluster of 3 or more non-edge points on the pattern deviation plot with a probability of occurring in <5% of the normal population, with 1 of these points having the probability of occurring in <1% of the normal population; a pattern standard deviation of P < 5%, or a glaucoma hemifield test result outside normal limits.
Swept-source Optical Coherence Tomography
The DRI-OCT system uses an axial scan rate of 100,000 Hz operated in the 1 μm wavelength region. This OCT uses a light source of a wavelength-sweeping laser centered at 1050 nm, with a repetition rate of 100,000 Hz, yielding an 8 μm axial resolution in tissue. Transverse resolution was set to approximately 20 μm. A single OCT image consisting of 1000 A lines can be acquired in 10 ms. The imaging depth was 2.6 mm in the tissue, and the lateral scan length was adjustable.
Two scanning protocols were used in each participant: 12 mm 5-line raster scans to include both the macular and ONH region and 6 mm 5-line raster scans at the ONH. For 12 mm 5-line raster scans, 96 single images were registered and averaged to create a multiaveraged single image. For the 6 mm, 5-line raster scan, 32 single images were registered and averaged.
Enhanced-depth Imaging of Heidelberg Spectralis Optical Coherence Tomography
The Heidelberg Spectralis OCT system provides up to 40,000 A-scans per second with 7 μm depth resolution in tissues and 14 μm transversal resolution of images of ocular microstructures. The EDI-OCT technique has been described in detail elsewhere.
EDI OCT B-scans at the macula and around the ONH were obtained using the Spectralis OCT system. Two scanning protocols were used for each participant; 9 mm, 5-line raster scans to include both macular and ONH regions and 6 mm optic-cube scans at the ONH. Each section was obtained using eye tracking. For 9 mm 5-line raster scans, 100 single images were acquired and averaged to create a multiaveraged single image. For 6 mm optic-cube scans, 35 single images were acquired and averaged.
Identification and Measurement of Choroidal, Scleral, and Laminar Thicknesses
Choroidal thickness was defined as the vertical distance between the retinal pigment epithelium and the chorioscleral interface. Scleral thickness was defined as the distance between the chorioscleral interface and the outer scleral border. The outer surface of the sclera was carefully identified in OCT scans from retro-ocular structures. Scleral tissues were identified by their lamellar morphologic features and high reflectivity values. Laminar thickness was defined as the distance between the anterior and posterior borders of the highly reflective region at the vertical center of the ONH in horizontal B-scans.
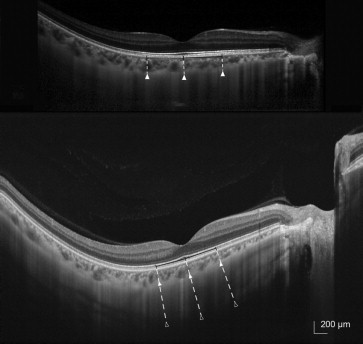
Using multiaveraged OCT images, we measured the choroidal, scleral, and laminar thicknesses. Measurements were made using the caliper function of the OCT software by 2 masked observers. Choroidal thickness was defined as the vertical distance between the retinal pigment epithelium and the chorioscleral interface. Scleral thickness was defined as the distance between the chorioscleral interface and the outer scleral border. The outer surface of the sclera was carefully identified in OCT scans from retro-ocular structures. Scleral tissues were identified by their lamellar morphologic features and high reflectivity values. Choroidal and scleral thicknesses were measured at 3 points at the subfoveal region ( Fig. 1 ). The average of measurements at the subfoveal point and 500 μm temporally and nasally therefrom were calculated. Laminar thickness was defined as the distance between the anterior and posterior borders of the hyper-reflective region at the bottom of the ONH. Measurements were performed along a perpendicular line from the reference line connecting the end of the Bruch membrane. An average of 3 measurements were considered for laminar thickness, which was measured at the center of the reference line and 50 μm temporally and 100 μm temporally therefrom.
For comparison of measurements, the B-scans were selected from the raster scans to correspond between 2 devices. The borders of the chorioscleral interface, outer scleral border and anterior, and posterior lamina cribrosa borders had to be identified to measure the thicknesses of the structures in this study. After outlining borders, thicknesses were measured by 2 masked observers (HYP and HYS). Each identifiable border that was agreed on by the 2 observers was included in the subsequent measurement analysis.
Measurement Reproducibility
The intersystem and interobserver reproducibility values were evaluated in terms of the intraclass correlation coefficient (ICC); coefficient of variation (CV); and coefficient of repeatability (CR) (1.96 × standard deviation of difference between measures). The interobserver reproducibility per device was evaluated, using the mean values of the repeated measurements of the 2 observers and the corrected standard deviation between the 2 repeated measurements per observer. To assess intersystem reproducibility, we used an analysis of variance to determine device-to-device reproducibility for repeated measurements. According to Fleiss, ICC scores ≥0.75, 0.40–0.75, and ≤0.4 are considered to be excellent, moderate and poor, respectively.
Statistical Analyses
Statistical analyses were performed using SPSS software (v 16.0; SPSS, Chicago, IL). Measured thicknesses were compared using a paired t test. The detection rates of each border were compared by using the McNemar χ 2 test. A value of P < 0.05 was considered to indicate statistical significance.
Results
EDI-OCT and swept-source OCT were performed in 33 eyes of 33 myopic glaucoma patients. Of these, 1 patient was excluded due to poor cooperation during image acquisition. The baseline characteristics of the remaining 32 patients are shown in Table 1 . The mean age was 51.62 ± 13.05 years. The mean spherical equivalent was −5.54 ± 4.86 diopters (range, −9.0 to 3.5 dipoters; median, −3.25 diopters) with a mean axial length of 24.42 ± 1.80 mm (range, 22.51 to 29.77 mm; median, 24.10 mm). The mean central corneal thickness was 532.24 ± 31.96 μm. The mean average RNFL thickness was 75.28 ± 10.21 μm. The averaged mean deviation of the visual field was −4.77 ± 4.16 decibels.
| Age, years | 51.62 ± 13.05 |
| Gender, Male:female | 11:21 |
| Spherical equivalent, diopter | −5.54 ± 4.86 |
| Axial length, mm | 24.42 ± 1.80 |
| Central corneal thickness, μm | 532.24 ± 31.96 |
| Intraocular pressure, mm Hg | 15.26 ± 2.74 |
| Average RNFL thickness, μm | 75.28 ± 10.21 |
| Mean deviation of perimetry, dB | −4.77 ± 4.16 |
Rates of Detection of Each Structure
The detection rates of the posterior border of each structure are shown in Table 2 . The posterior borders of the choroid was visible in all eyes using both devices. The posterior borders of the sclera were visible in 10 eyes (31%) using EDI-OCT. This improved to 17 eyes (53%) using swept-source OCT. By the McNemar χ 2 test, the detection rate of the posterior border of the sclera was significantly different between EDI-OCT and swept-source OCT ( P = 0.008). The posterior border of the lamina cribrosa was delineated in 24 eyes (75%) using EDI-OCT and in 26 eyes (81%) using swept-source OCT. Of the 32 eyes, 9 were highly myopic (axial length more than 26.0 mm). The detection rates of the posterior border of the sclera and lamina cribrosa in highly myopic eyes using EDI-OCT and swept-source OCT did not differ significantly.
| All eyes | Highly myopic eyes | |||
|---|---|---|---|---|
| EDI-OCT | Swept-source OCT | EDI-OCT | Swept-source OCT | |
| Posterior border of the choroid | 32 (100%) | 32 (100%) | 9 (100%) | 9 (100%) |
| Posterior border of the sclera | 10 (31%) | 17 (53%) a | 6 (67%) | 7 (78%) |
| Posterior border of the lamina cribrosa | 24 (75%) | 26 (81%) | 7 (78%) | 7 (78%) |
a Significantly different from EDI-OCT by McNemar χ 2 test ( P = 0.008).
Measurement Reproducibility
To evaluate interobserver and intersystem reproducibilities, the lines of the chorioscleral border, the posterior scleral border, and the posterior laminar border were determined independently by 2 observers. The interobserver and intersystem ICCs, CVs, and CRs of each thickness measurement are shown in Table 3 . The interobserver ICCs were 0.925 (95% CI, 0.846–0.963) using EDI-OCT and 0.929 (95% CI, 0.862–0.971) using swept-source OCT for subfoveal choroidal thickness. The interobserver ICCs were 0.890 (95% CI, 0.742–0.908) using EDI-OCT and 0.897 (95% CI, 0.863–0.911) using swept-source OCT for subfoveal scleral thickness. The interobserver ICCs were 0.906 (95% CI, 0.890–0.921) using EDI-OCT and 0.907 (95% CI, 0.895–0.930) using swept-source OCT for laminar thickness. The agreement on thickness measurements using both devices was calculated as the intersystem ICC. Intersystem ICCs were 0.936 (95% CI, 0.936–0.978) for subfoveal choroidal thickness; 0.769 (95% CI, 0.710–0.854) for subfoveal scleral thickness; and 0.900 (95% CI, 0.887–0.917) for laminar thickness.
| Intersystem ICC | Interobserver ICC | ||||||||
|---|---|---|---|---|---|---|---|---|---|
| EDI-OCT | Swept-source OCT | ||||||||
| ICC (95% CI) | CV, % | CR, μm | ICC (95% CI) | CV, % | CR, μm | ICC (95% CI) | CV, % | CR, μm | |
| Subfoveal choroidal thickness | 0.936 (0.872–0.978) | 5.10 | 31.4 | 0.925 (0.846–0.963) | 5.80 | 35.8 | 0.929 (0.862–0.971) | 5.05 | 35.0 |
| Subfoveal scleral thickness | 0.769 (0.710–0.854) | 9.20 | 55.7 | 0.890 (0.742–0.908) | 6.76 | 38.9 | 0.897 (0.863–0.911) | 6.21 | 38.1 |
| Laminar thickness | 0.900 (0.887–0.917) | 6.26 | 39.2 | 0.906 (0.890–0.921) | 6.08 | 37.1 | 0.907 (0.895–0.930) | 5.98 | 35.2 |
Thicknesses of the Choroid, Sclera and Lamina Cribrosa
Mean (± standard deviation) thicknesses of the subfoveal choroid were 263.54 ± 70.24 μm using EDI-OCT and 270.50 ± 73.18 μm using swept-source OCT. No significant differences in subfoveal choroidal thickness measurements by the devices were observed ( P = 0.816). Mean subfoveal scleral thicknesses were 464.32 ± 213.24 μm using EDI-OCT and 650.26 ± 222.30 μm using swept-source OCT. Significant differences between the measured subfoveal scleral thickness by the 2 devices were evident ( P = 0.018). Laminar thicknesses were 267.22 ± 60.48 μm using EDI-OCT and 306.10 ± 77.27 μm using swept-source OCT. The differences between the laminar thickness measurements of the 2 devices were not significant ( P = 0.244) ( Table 4 ). Measured thicknesses for highly myopic eyes are shown in Table 5 . Subfoveal choroidal, subfoveal scleral, and laminar thicknesses were similar in highly myopic eyes according to the 2 devices.


