There is more information on a sleep study report than just the Apnea-Hypopnea Index or Respiratory Disturbance Index. This article explains how to evaluate any sleep study report to get the most information out of it. Maximum information allows the optimal treatment of patients with obstructive sleep apnea and some other sleep disorders.
Key points
- •
All in-laboratory sleep study reports should include sleep architecture, respiratory summary, periodic limb movements, sleep fragmentation and electrocardiography.
- •
Knowing what information to look for in all of these categories allows clinicians to treat patients with obstructive sleep apnea in a thoughtful and comprehensive way.
- •
Home sleep testing does not give as much information as an in-laboratory sleep study, but there are still some patients in whom a home sleep test may be more appropriate.
Otolaryngologists are frequently called upon to treat patients with obstructive sleep apnea (OSA). One of the most important tools we have to help us decide what treatment options, if any, are in the best interest of our patients is the sleep study.
A sleep study is a test that measures certain parameters to determine, among other things, a patient’s degree of OSA. It can be used diagnostically or it can be used to measure a response to treatment, such as after surgery or with an oral appliance in place. A sleep study can be performed in a sleep lab or at home. It is usually performed at night. However, it is sometimes done during the day in patients, such as shift workers, who generally work at night and sleep during the day.
A sleep study can also be used as a therapeutic procedure in an attempt to treat a patient with OSA. This study can take the form of a continuous positive airway pressure (CPAP), bilevel positive airway pressure (BPAP), or adaptive servoventilation (ASV) titration. CPAP and BPAP titrations are performed to treat OSA, whereas an ASV titration is used in patients with central or complex sleep apnea. In general, whichever modality is used, low pressure is used at the beginning of the study. The pressure is then slowly advanced, in response to respiratory events and snoring, until the optimal pressure setting is identified.
A therapeutic oral appliance titration can also be performed in the laboratory. During this study, the mandible is protruded by advancing the oral appliance in response to events, similar to a positive airway pressure (PAP) titration, within parameters set by the titrating physician/dentist prior to the study.
There are other studies that are performed in a sleep lab. These studies include a multiple sleep latency test (MSLT) and a maintenance of wakefulness test (MWT). The MSLT is used to assess someone’s ability to fall asleep in an attempt to quantify hypersomnolence as well as to identify patients with narcolepsy. It entails 4 to 5 nap periods on the day following a full night diagnostic sleep study. An MWT is used to measure a patient’s ability to maintain wakefulness. This test takes place during the day and consists of four 40-minute trials during which the patient sits up in bed with instructions to sit still and remain awake for as long as possible. It is frequently used for patients whose work, and ability to stay awake, may affect public safety.
The gold standard diagnostic sleep study is an in-laboratory polysomnography. Understanding the information that can be gleaned from an in-laboratory sleep study not only allows clinicians to treat patients with OSA but also allows home sleep apnea tests (HSATs) to be put in perspective.
When reviewing a sleep study with a patient in the office, it is easy to look at the apnea-hypopnea index (AHI) and/or respiratory disturbance index (RDI) and decide on treatment options. However, there is more information on a sleep study report than just the AHI/RDI. If clinicians know what information to look for on a sleep study report, it allows a more comprehensive and effective treatment plan for our patients with OSA.
How a sleep study report looks is predicated on what software was used to create it. Thus, sleep studies from 2 different sleep labs may look very different. However, if clinicians understand what categories to look for in a sleep study report, and what information is important within each category, it becomes easy to get the most information out of any given report. If most of the sleep studies assessed by a physician come from 1 laboratory, it is simple, within a short period of time, to be able to quickly peruse a study for what information is important and relevant.
Before looking at what general categories make up a sleep study report, it is helpful to look at what information is collected during a sleep study and how this information is presented.
After patients check in at the sleep lab, they are brought to a private room. The sleep lab technician then hooks up the patient by attaching all of the appropriate leads. The patient is then instructed to go to sleep. During the course of the night, data are collected from all of the leads. If a lead falls off, the technician sees this on a computer monitor in a separate monitoring room and goes back into the patient’s room to reattach the lead. After the patient leaves the laboratory, the collected data are then scored by a sleep technologist. The sleep technologist puts in the stages of sleep and marks the events. Subsequently, this scored study is then interpreted by a sleep physician who looks at all of the scored data and restages sleep/wakefulness and overscores events as deemed necessary.
It is beyond the scope of this article to teach readers how to score and interpret the raw data on a sleep study, but it will be easier for readers to look at a sleep study report if they have a visual of what is recorded during the course of a study night.
The leads used during an in-laboratory diagnostic sleep study are standardized. Each lead contributes to the overall picture that develops during the course of a study. The leads that are represented on the top half of sleep study raw data help clinicians to determine whether someone is awake or asleep. The leads represented on the bottom half of the page/screen generally provide information about events, including respiratory events, limb movements, and cardiac events ( Fig. 1 ).
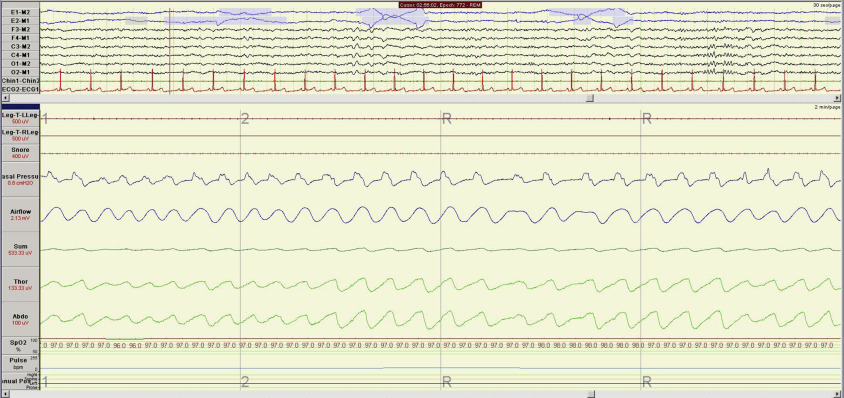
The top half of a sleep study screen includes 2 electrooculography (EOG), or eye, leads; 6 electroencephalography (EEG) leads; and a chin electromyography (EMG) lead. As stated earlier, taken together, these leads have definable findings that help clinicians determine not only whether the patient is awake or asleep but, if asleep, what stage of sleep the patient is in.
In a sleep study, sleep is artificially broken down into 30-second epochs. Whatever stage of sleep, or wakefulness, constitutes most of a 30-second epoch is the stage the epoch gets scored as. If a patient’s total recorded time on a sleep study is, for example, 5 hours, there will be 600 epochs that need to be staged. Five hours is 300 minutes. Each minute has 2 epochs of 30 seconds and, therefore, 300 minutes × 2 epochs/min = 600 epochs.
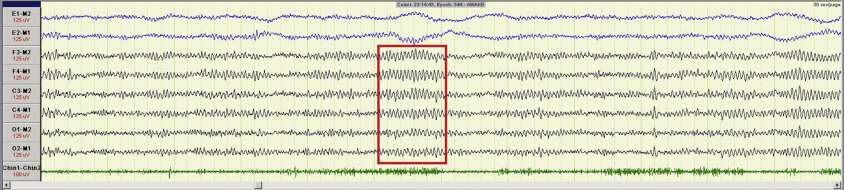
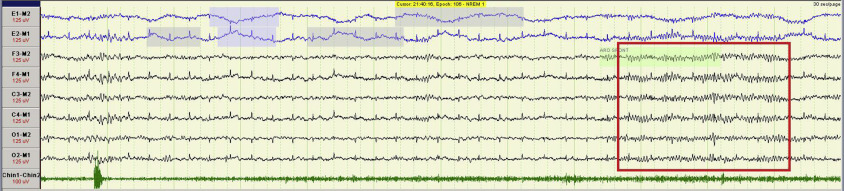
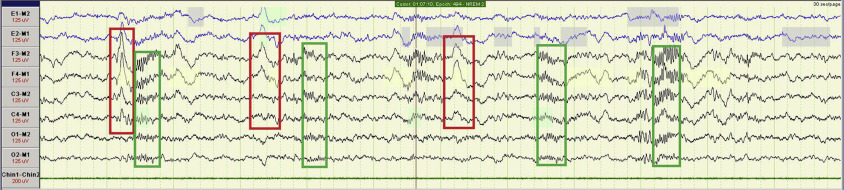
Findings that help to define stages of sleep include alpha waves encompassing greater than 50% of an epoch in stage W (wakefulness) ( Fig. 2 ); low-amplitude, mixed-frequency EEG activity and alpha waves of less than 50% of an epoch in stage N1 ( Fig. 3 ); sleep spindles and K complexes in stage N2 ( Fig. 4 ); and delta waves in stage N3 ( Fig. 5 ). Clearly, when asleep, the EOG, or eye, leads, help to determine whether the patient is in stage rapid eye movement (REM) sleep ( Fig. 6 ). The figures in this article show typical findings in drowsiness before sleep onset and each stage of sleep. They are presented here, and visualized best on a sleep study, in a 30-second window.
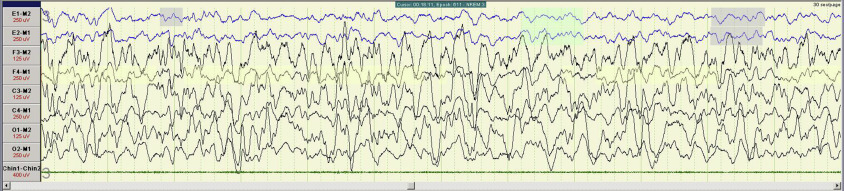
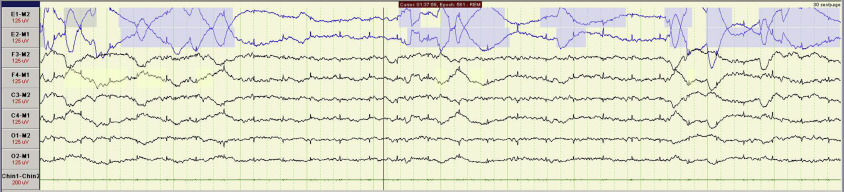
The chin EMG also helps to stage sleep. There is a steady decrease in tone represented on the EMG from wakefulness to stages N1, N2, N3, and then into stage REM. This progression is evident on the lowest line (green) on Figs. 2–6 .
Keep in mind that the EEG montage, or configuration, that is used for sleep studies is not as comprehensive as the montage used for EEGs that are used specifically to assess seizure activity.
The bottom half of the page generally includes nasal pressure and airflow readings, chest and abdominal effort belt leads, a microphone to record snoring, body position sensor, electrocardiography (ECG), and 2 leg EMG leads. All of these leads are generally best viewed in a 2-minute screen, other than the ECG lead, which is easier to analyze in a 30-second window (see Fig. 1 ).
In general, there are 5 categories to look for in a sleep study: sleep architecture, respiratory summary, periodic limb movements, arousal analysis or sleep fragmentation, and cardiac analysis (ECG).
Sleep architecture
In life, there are 3 states of being: wakefulness, non-REM sleep, and REM sleep. When everything is working well, these 3 states of being are separate and distinct. People flow smoothly from one state to another in a fairly standard pattern during a typical 24-hour period.
Sleep architecture is the basic structural organization and pattern of sleep. It is what happens with respect to the order and pattern of staging of sleep during the course of the night. One component of the sleep architecture is what percentage of the night people spend in each sleep stage.
As stated earlier, sleep is separated into non-REM sleep and REM sleep. In adults, non-REM sleep is usually ∼75% to 80% of the night, whereas stage REM is usually ∼20% to 25% of the night. Until recently, non-REM sleep was separated into stages 1, 2, 3, and 4. In 2008, the American Academy of Sleep Medicine (AASM) discontinued the use of stage 4 sleep. Now, non-REM sleep is separated into stages N1, N2, and N3. Stage N3 encompasses what used to be stages 3 and 4.
Normal sleep architecture changes with age. Not only do newborns spend much more time sleeping during a 24-hour period than adults, but they spend ∼50% of their sleep in stage REM or active sleep. Stage N3 sleep slowly decreases with age.
Stage N1 sleep is light or drowsy sleep with a very low arousal threshold. It is frequently the interface between wakefulness and the deeper stages of sleep. It is nonrestorative. When falling asleep at night, people generally go from wakefulness, briefly into stage N1, and then into stage N2. After awakenings at night, people sometimes again transition through stage N1 to the deeper stages of sleep. Some patients with very severe OSA, or significantly disrupted sleep for any reason, have frequent arousals and then transition through stage N1. They therefore have a much higher percentage of stage N1 than is normal or desired.
Adults generally spend more time in stage N2 than any other stage of sleep. There is a higher arousal threshold in stage N2 than in stage N1 sleep.
Stage N3, or slow-wave sleep, is generally considered to be the deepest stage of sleep and the most restorative. Physiologically, it is a very stable stage to be in. During this stage, the heart rate is generally at its lowest, as is the blood pressure. Sleep apnea events are less frequent during this stage of sleep than in any other sleep stage because of its stability.
Stage REM sleep is generally the stage in which people dream. Physiologically, several things happen during stage REM. First, the brain is very active. The brain uses as much glucose during stage REM as it does when awake.
Second, people are in effect paralyzed during stage REM. People lose muscle tone in all of the muscles of the body except the eyes, the heart, and the diaphragm. If people had muscle tone during stage REM, they could get out of bed and act out their dreams. It is, therefore, protective to be paralyzed in stage REM.
The inability to lose muscle tone during stage REM is seen in an entity called REM Behavior Disorder. This entity can be dangerous to the patient, and to those around the patient. Patients act out their dreams without an awareness of the consequences. This condition is seen most commonly in patients with Parkinson’s disease.
In contrast, the downside of losing muscle tone in stage REM is that many patients with OSA tend to have a higher AHI or RDI in stage REM than in non-REM sleep. Less muscle tone leads to more airway collapse, and therefore, more respiratory events.
Adults with normal sleep go from wakefulness to drowsiness to non-REM sleep. After ∼80 to 110 minutes, the first REM period occurs. People generally go through 4 to 6 non-REM to REM cycles during the night before awakening in the morning. This sequence can be seen most easily on a sleep study report by looking at the hypnogram. The hypnogram is an overall view or gestalt of what transpired in the course of a night with respect to sleep staging.
The hypnogram in Fig. 7 shows essentially normal sleep architecture. It shows a patient going from wakefulness into non-REM sleep. The patient then transitions through stage N2 and then into stage N3, and then stage REM. This patient has 6 non-REM/REM cycles. Slow-wave sleep, stage N3, predominates in the first third of the night, whereas stage REM is more prevalent in the last third of the night.
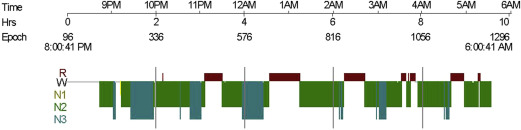
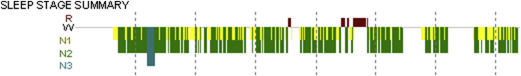
The hypnogram in Fig. 8 is representative of a patient with very severe OSA. Note how he cannot stay in the deeper stages of sleep and has frequent arousals with reentry to sleep through Stage N1 (yellow). After the hypnogram, the author looks at a table that shows what percentage of the night was spent in each stage of sleep and compares this with normal values.
The total sleep time (TST) is the amount of time during the night that the patient was asleep, as verified by EEG.
Sleep efficiency is the percentage of the night, from the time the sleep technician says “Lights out, go to sleep” until the lights are turned on in the morning, that the patient was actually sleeping. Normal sleep efficiency is greater than 85%. Keep in mind that the patient is sleeping in a strange place and is attached to many wires, which may decrease the patient’s sleep efficiency artificially. This is especially true during the patient’s first sleep study secondary to what is called “first-night effect” in the sleep lab.
The sleep latency shows how long it took for the patient to get into the first epoch of sleep from the time the technician says, “Lights out, go to sleep.” Normal sleep latency is less than 30 minutes. Again, keep in mind that a decreased sleep efficiency and an increased sleep latency may be secondary to the environment in which the patient is sleeping in.
In contrast, a high sleep efficiency (eg, 98%) with a low sleep latency (eg, 2 minutes), in this kind of environment, may be secondary to significant hypersomnolence; the patient is so tired that they can fall asleep anywhere, anytime, under any circumstances.
The author frequently sees patients who are dragged into the office by their bed partners for snoring, and possible sleep apnea. The patient may deny that they have any sleep issues because they can fall asleep anywhere as soon as their head hits the pillow. Here is an opportunity to explain to them that this is not normal. A normal sleep latency is 5 to 30 minutes, not 30 seconds.
Another latency that is very important is the REM latency. This is how long it takes a person to progress from the first epoch of sleep to the first epoch of stage REM sleep. Normal REM latency is 80 to 110 minutes. A very short REM latency, such as 5 minutes, can be pathologic. It suggests, but is not pathognomonic for, the possibility of narcolepsy.
Narcolepsy is the intermingling of wakefulness and stage REM sleep. The symptom of cataplexy is pathognomonic for narcolepsy but is only seen in ∼50% of patients with narcolepsy. Cataplexy is a sudden attack of muscle weakness that is usually triggered by strong emotion (laughing more commonly than crying).
As can be seen above, there is a lot of useful information that can be obtained from understanding sleep architecture, both normal and abnormal, before even considering the respiratory summary.
Sleep architecture
In life, there are 3 states of being: wakefulness, non-REM sleep, and REM sleep. When everything is working well, these 3 states of being are separate and distinct. People flow smoothly from one state to another in a fairly standard pattern during a typical 24-hour period.
Sleep architecture is the basic structural organization and pattern of sleep. It is what happens with respect to the order and pattern of staging of sleep during the course of the night. One component of the sleep architecture is what percentage of the night people spend in each sleep stage.
As stated earlier, sleep is separated into non-REM sleep and REM sleep. In adults, non-REM sleep is usually ∼75% to 80% of the night, whereas stage REM is usually ∼20% to 25% of the night. Until recently, non-REM sleep was separated into stages 1, 2, 3, and 4. In 2008, the American Academy of Sleep Medicine (AASM) discontinued the use of stage 4 sleep. Now, non-REM sleep is separated into stages N1, N2, and N3. Stage N3 encompasses what used to be stages 3 and 4.
Normal sleep architecture changes with age. Not only do newborns spend much more time sleeping during a 24-hour period than adults, but they spend ∼50% of their sleep in stage REM or active sleep. Stage N3 sleep slowly decreases with age.
Stage N1 sleep is light or drowsy sleep with a very low arousal threshold. It is frequently the interface between wakefulness and the deeper stages of sleep. It is nonrestorative. When falling asleep at night, people generally go from wakefulness, briefly into stage N1, and then into stage N2. After awakenings at night, people sometimes again transition through stage N1 to the deeper stages of sleep. Some patients with very severe OSA, or significantly disrupted sleep for any reason, have frequent arousals and then transition through stage N1. They therefore have a much higher percentage of stage N1 than is normal or desired.
Adults generally spend more time in stage N2 than any other stage of sleep. There is a higher arousal threshold in stage N2 than in stage N1 sleep.
Stage N3, or slow-wave sleep, is generally considered to be the deepest stage of sleep and the most restorative. Physiologically, it is a very stable stage to be in. During this stage, the heart rate is generally at its lowest, as is the blood pressure. Sleep apnea events are less frequent during this stage of sleep than in any other sleep stage because of its stability.
Stage REM sleep is generally the stage in which people dream. Physiologically, several things happen during stage REM. First, the brain is very active. The brain uses as much glucose during stage REM as it does when awake.
Second, people are in effect paralyzed during stage REM. People lose muscle tone in all of the muscles of the body except the eyes, the heart, and the diaphragm. If people had muscle tone during stage REM, they could get out of bed and act out their dreams. It is, therefore, protective to be paralyzed in stage REM.
The inability to lose muscle tone during stage REM is seen in an entity called REM Behavior Disorder. This entity can be dangerous to the patient, and to those around the patient. Patients act out their dreams without an awareness of the consequences. This condition is seen most commonly in patients with Parkinson’s disease.
In contrast, the downside of losing muscle tone in stage REM is that many patients with OSA tend to have a higher AHI or RDI in stage REM than in non-REM sleep. Less muscle tone leads to more airway collapse, and therefore, more respiratory events.
Adults with normal sleep go from wakefulness to drowsiness to non-REM sleep. After ∼80 to 110 minutes, the first REM period occurs. People generally go through 4 to 6 non-REM to REM cycles during the night before awakening in the morning. This sequence can be seen most easily on a sleep study report by looking at the hypnogram. The hypnogram is an overall view or gestalt of what transpired in the course of a night with respect to sleep staging.
The hypnogram in Fig. 7 shows essentially normal sleep architecture. It shows a patient going from wakefulness into non-REM sleep. The patient then transitions through stage N2 and then into stage N3, and then stage REM. This patient has 6 non-REM/REM cycles. Slow-wave sleep, stage N3, predominates in the first third of the night, whereas stage REM is more prevalent in the last third of the night.


