Purpose
To investigate in open-angle glaucoma the focal macular photopic negative response and spectral-domain optical coherence tomography measurements of retinal thicknesses in the superior and inferior macula.
Design
Comparative case series.
Methods
We studied 63 eyes of 63 patients with open-angle glaucoma and 41 normal eyes of 41 volunteers. Photopic negative responses were recorded using a spotlight (diameter of 15 degrees of circle), projected onto the whole or superior or inferior macula. Ganglion cell complex (nerve fiber + ganglion cell + inner plexiform layers) thickness was measured using spectral-domain optical coherence tomography.
Results
Mean photopic negative response amplitude over the entire macula was significantly ( P < .001) decreased compared with that of controls in eyes with early (n = 24; to 62.1%), moderate (n = 21; to 57.2%), and severe (n = 18; to 49.3%) open-angle glaucoma, but not significantly different among eyes with various stages of glaucoma. Mean ganglion cell complex thickness was significantly ( P < .001) decreased compared with that of controls in eyes with early (86.0%), moderate (78.3%), and severe (71.2%) glaucoma, and thinning correlated positively with glaucoma severity ( P < .001). Mean photopic negative response amplitude correlated significantly ( P < .001) with ganglion cell complex thickness over the whole, superior, and inferior macular areas ( r = 0.57 to 0.74). In 16 eyes without visual field defect in the inferior hemifield, mean photopic negative response amplitude was 56.5% of normal ( P < .001), and mean ganglion cell complex thickness in the superior macula was 92.1% of normal ( P = .004).
Conclusions
Focal macular photopic negative response amplitude correlates with ganglion cell complex thickness, but decreases more abruptly in early glaucoma compared with ganglion cell complex thickness.
Retinal ganglion cell (RGC) loss in glaucoma occurs as a result of damage of the RGC axon within the optic nerve head, which consequently leads to atrophic changes in clinically observable structures, such as the optic nerve head and retinal nerve fiber layer (RNFL), and to functional loss that is detectable with visual field testing. These structural changes, specifically RNFL defects and thinning of the neuroretinal rim in the optic nerve head, have been shown to precede visual field loss that is clinically detectable with visual field testing. In fact, the results of histologic studies of enucleated eyes of patients with glaucoma by Quigley and associates and Kerrigan-Baumrind and associates and of eyes of primates with experimental glaucoma by Harwerth and associates indicate that considerable loss of RGCs has occurred by the time visual field deficits are detected. In glaucoma, however, functional loss seems to occur before the results of achromatic static automated perimetry become abnormal because functional decline can be detectable in electrophysiologic results in eyes with suspected glaucoma. Thus, it would be useful to deepen our understanding of the relationship between structural damage and electrophysiologic functional loss associated with glaucoma.
Recently, glaucoma research has focused on how changes in RGC structure in the macula relate to macular functional abnormalities. Studies using optical fundus imaging methods such as retinal thickness analyzers and optical coherence tomography (OCT) showed significant thinning of the macula in eyes with glaucoma and that thinning results from the loss of RGCs; approximately 50% of RGCs are located within the macular region. The latest OCT imaging technology, spectral-domain OCT (SD OCT), allows for automated measurement of the thicknesses of retinal layers, namely the ganglion cell layer (GCL), RNFL, and inner plexiform layer (IPL), where the RGC bodies, axons, and dendrites, respectively, are located. The thickness of these combined layers, referred to as the ganglion cell complex , is more severely decreased than the total retinal thickness in eyes with glaucoma and severe visual field defects, indicating that RGC structure is a more definitive indicator of glaucoma than total retinal thickness.
Results of a number of studies suggest that the photopic negative response in the photopic electroretinography (ERG) results originates primarily from activity of RGCs and their axons. The photopic negative response is represented by the negative wave that appears immediately after the ERG B-wave. In primates with experimental glaucoma, blocking action potentials of the RGCs by an intravitreal injection of tetrodotoxin reduces the amplitude of the photopic negative response. In clinical studies, the amplitude of the photopic negative response in full-field ERG results was reduced in patients with diseases involving RGC damage, such as glaucoma, retinal vascular disease, and optic nerve diseases. Furthermore, in patients with glaucoma, the amplitude of full-field photopic negative responses correlated with retinal sensitivity measured by visual field testing, RNFL thickness measured by scanning laser polarimetry, and the results of optic disc topography. Amplitude of the full-field photopic negative response also has been shown to be useful in discriminating between eyes with and without glaucoma.
In 2000, Colotto and associates were the first to report that the amplitude of the photopic negative response in focal macular ERG results was reduced in patients with early glaucoma, and since then, several studies have recorded focal photopic negative responses with simultaneous fundus monitoring, so that the focal photopic negative responses could be linked to selected areas. Machida and associates discovered that decreased focal photopic negative responses in the central macula and in the supertemporal and inferotemporal regions of the macula were associated with decreased retinal sensitivity in patients with open-angle glaucoma (OAG) and that this decrease could be used to discriminate between eyes with and without glaucoma. Tamada and associates found that the focal photopic negative response amplitude and the ratio of the focal photopic negative response to B-wave amplitude in retinal local areas were correlated linearly with structural parameters, such as the optic disc rim area, the cup-to-disc area ratio, and circumpapillary RNFL thickness of the corresponding sectors. Kurimoto and associates found, in normal primate eyes, distinct asymmetries in photopic negative response amplitudes recorded along vertical compared with horizontal meridians. These previous findings imply that comparing a photopic negative response in local retinal areas, particularly in areas across hemispheres in eyes with glaucoma, may yield interesting findings, and indeed, studies using the Glaucoma Hemifield Test (Carl-Zeiss Meditec, Dublin, California, USA), a sensitive indicator for glaucomatous visual field defects, show that glaucoma damage occurs asymmetrically across the horizontal meridian.
We undertook the study reported here to characterize further the focal photopic negative response in OAG using 2 approaches. We compared focal macular photopic negative response amplitudes (indicating macular function) and ganglion cell complex thickness (as an indication of RGC structure) measured by SD OCT. We also recorded focal macular photopic negative responses separately from each macular hemisphere and compared results with findings regarding unilateral visual field defects.
Methods
Subjects
Sixty-three eyes of 63 patients with OAG (confirmed by open angles on gonioscopy; 28 men and 35 women; mean age, 64.0 ± 12.0 years; range, 35 to 78 years) who were examined between October 2007 and March 2009 at the Glaucoma Service of Kyoto University Hospital (Kyoto, Japan) were included in this study. Glaucoma was diagnosed only if the optic disc had the characteristic appearance of glaucoma and visual field defects were detected by standard automated perimetry (SAP). Glaucomatous optic disc abnormalities were defined on stereoscopic examination as loss or thinning of the neuroretinal rim, notching, disc hemorrhage, or a vertical cup-to-disc ratio larger than that of the fellow eye by more than 0.2. Visual field defects resulting from glaucoma were defined as: (1) glaucoma hemifield test results outside of normal limits or (2) pattern standard deviation with less than 5% probability of being normal on 2 consecutive SAP tests. Only reliable SAP results (those with fixation loss < 20%, false-positive results < 15%, or false-negative results < 33%) were considered. Forty-one normal eyes of 41 volunteers (21 men and 20 women; mean age, 59.9 ± 9.4 years; range, 42 to 77 years) served as controls.
All study patients and volunteers underwent a comprehensive ophthalmologic examination, including automated refractive keratometry, measurements of uncorrected visual acuity and best-corrected visual acuity using the 5-m Landolt chart, slit-lamp examinations, intraocular pressure measurements using a Goldmann applanation tonometer, SAP using the Humphrey Field Analyzer with 24-2 Swedish interactive threshold algorithm (Carl Zeiss Meditec), dilated funduscopy, stereo disc photography using a 3-Dx simultaneous stereo disc camera (Nidek, Gamagori, Japan), and SD OCT with RTVue-100 (Optovue, Inc, Fremont, California, USA).
Individuals with neurologic disease or a history of diabetes or corticosteroid use were excluded, and eyes with any type of retinal pathologic features, opaque media, or a history of retinal laser procedures or surgery were excluded. Eyes also were excluded if best-corrected visual acuity was worse than 20/20 in the Snellen equivalent or equivalent refractive error was not between +3.00 and −6.00 diopters. When both of a patient’s or volunteer’s eyes were eligible for inclusion in the study, 1 eye was selected randomly for inclusion.
Focal Macular Electroretinography Recording
For each subject, focal macular ERG recording and SD OCT were performed on the same day and within 3 months of visual field testing. ERG recording was performed after the pupils were dilated maximally with topical applications of 0.5% tropicamide and 0.5% phenylephrine. In this study, focal photopic ERGs were obtained concurrent with funduscopy by using a stimulation system integrated into the infrared fundus camera by the Mayo Co (Nagoya, Japan), a system originally developed by others. The stimulus was a spotlight with a diameter of 15 degrees of circle, either circular or superior hemicircular or inferior hemicircular, that was projected onto the whole, superior, or inferior macula ( Figure 1 ). The white stimulus light (a 2-Hz rectangular wave) and white background illumination of 181.5 cd/m 2 and 6.9 cd/m 2 power, respectively, were produced by light emitting diodes with spectral emissions at 375 to 780 nm and 400 to 800 nm, respectively. The stimulus cycle was light on for 150 milliseconds and light off for 350 milliseconds. The recording electrode was a Burian-Allen bipolar contact lens electrode (Hansen Ophthalmic Laboratories, Iowa City, Iowa, USA) inserted into the conjunctival sac. The left ear served as a ground.
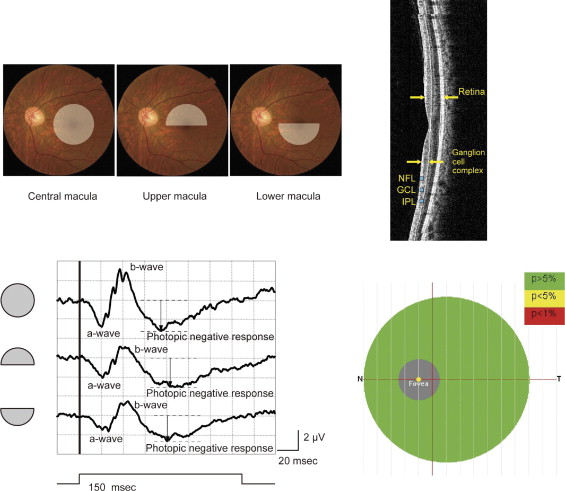
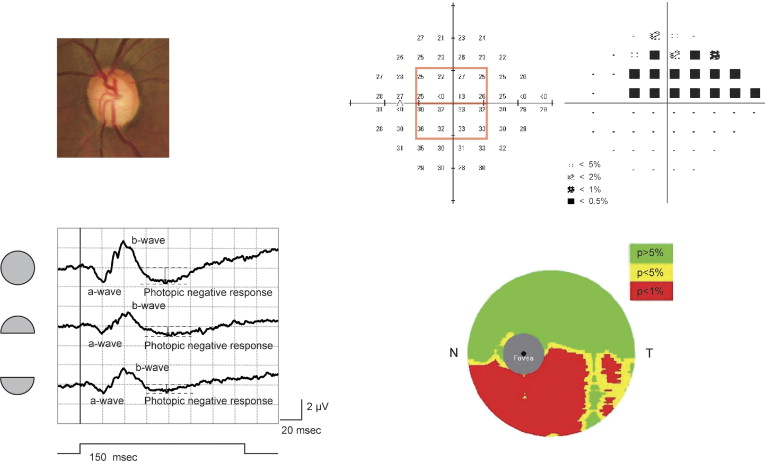
Focal ERGs were recorded from the whole macular area or only from the superior half or inferior half of the macular area stimulated ( Figure 1 , Top left), whereas the subject kept his or her gaze fixated, as instructed, on the center of the visual field; the infrared fundus image showed whether the fixation point remained on the fovea. Between 200 and 300 responses were recorded from each eye and were averaged by a signal processor (Neuropack MEB-2204; Nihon Kohden, Tokyo, Japan). The focal ERG response was digitized at 10 kHz with a band-pass filter of 5 to 500 Hz. The amplitude of the A-wave and of the photopic negative response were measured from the baseline to the peak of the A-wave and photopic negative response, respectively. The amplitude of the B-wave was measured from the trough of the A-wave to the peak of the B-wave ( Figure 1 , Bottom left, and Figure 2 , Bottom left).
Humphrey Visual Field Analysis
Eyes with OAG were categorized according to mean deviation (MD) on SAP as having early glaucoma (MD of less than −6), moderate glaucoma (MD between −6 and −12), or severe glaucoma (MD of −12 or more). The mean visual sensitivity of the central 16 test points on 24-2 SAP was taken to represent the visual sensitivity of the whole macula, and the mean visual sensitivities of the superior and inferior 8 points were taken to represent visual sensitivity of the superior and inferior macula, respectively ( Figure 2 , Top right).
Thickness Measurements with the RTVue-100
SD OCT scanning was performed using the RTVue-100, which acquires 26 000 axial scans (A-scans) per second and has a 5-μm depth resolution in tissue. For this study, we used a serial vertical scan protocol to sample a 7-mm square area of the macula. This protocol uses a scan pattern of 1 horizontal line and 15 vertical lines at 0.5-mm intervals to acquire a total of 14 928 A-scans over 0.6 seconds. We centered the scans 0.75 mm temporally from the fixation point to improve sampling of the temporal periphery. Software (version 4.0) built into the RTVue automatically calculates the mean thickness of the total retina, the mean thickness of the ganglion cell complex, and total retina minus ganglion cell complex. Only images with an image quality index of 50.0% or more was used for analysis.
Statistical Analyses
Paired t tests were used to determine whether ERG results and SD OCT findings differed significantly for superior versus inferior areas of the macula in normal eyes. A 1-way analysis of variance was performed with post hoc Bonferroni correction to compare focal macular ERG amplitudes and macular thickness measurements among normal eyes and eyes with visual field defects resulting from early, moderate, or severe glaucoma. Pearson correlation coefficients were calculated to identify associations between various parameters, linear and logarithmic correlations were obtained, and the stronger correlation coefficient was used. Statistical analyses were performed using PASW Statics software version 17.0 (SPSS, Inc, Chicago, Illinois, USA). The level of statistical significance was set at P < .05.
Results
There was no significant difference in mean age or gender between patients with OAG and study volunteers.
Asymmetry in Normal Eyes
For the 41 normal eyes, mean amplitudes of the photopic negative response and of the A-wave were significantly larger in the superior compared with the inferior hemisphere of the macular area studied ( P = .008 for A-wave amplitudes, P < .001 for photopic negative response amplitudes), but mean B-wave amplitudes were not significantly different between hemispheres ( Table 1 ). The mean thickness of the total retina ( P < .001) and the value of the total retina minus the ganglion cell complex ( P < .001) were significantly greater in the superior compared with the inferior macula in the normal eyes in this study, but mean ganglion cell complex thickness in the hemispheres did not differ significantly ( Table 1 ).
| Superior Macula | Inferior Macula | P Value a | |
|---|---|---|---|
| Focal macular ERG results (μV) | |||
| A-wave amplitude | 1.26 ± 0.34 | 1.15 ± 0.26 | .008 |
| B-wave amplitude | 2.30 ± 0.55 | 2.30 ± 0.53 | .970 |
| Photopic negative response amplitude | 2.14 ± 0.46 | 1.86 ± 0.37 | < .001 |
| Retinal thickness (μm) | |||
| Total retina | 267.66 ± 14.31 | 263.80 ± 13.25 | < .001 |
| Ganglion cell complex b | 96.82 ± 7.61 | 97.06 ± 6.56 | .706 |
| Total retina minus ganglion cell complex b | 170.88 ± 8.87 | 166.82 ± 8.94 | < .001 |
a Paired t test; level of significance for this study was P < .05.
b Nerve fiber layer + ganglion cell layer + inner plexiform layer.
Focal Macular Electroretinography Results and Macular Thicknesses
Table 2 shows mean amplitudes of focal macular ERG waves and mean retinal layer thicknesses in the whole, superior, and inferior macular areas in normal eyes and in eyes with early (n = 24), moderate (n = 21), or severe (n = 18) glaucoma. Figure 3 shows box-and-whisker plots of these results and statistical significances of differences among means. Mean photopic negative response amplitudes in eyes with early, moderate, or severe glaucoma were smaller than mean amplitudes in normal eyes in all macular areas ( Table 2 ), and the reductions in amplitudes (over the whole macula to 62.1%, 57.2%, and 49.3% of normal; in the superior macula to 58.4%, 56.1%, and 50.5% of normal; and in the inferior macula to 62.4%, 48.9%, and 50.0% of normal) were significant ( P < .001 for each; Figure 3 ). However, the differences in mean photopic negative response amplitude for eyes with early, moderate, or severe glaucoma were not significant ( Figure 3 , Top right).
| Normal | Early | Moderate | Severe | |
|---|---|---|---|---|
| Subjects (n) | 41 | 24 | 21 | 18 |
| Mean age ± SD (yrs) | 59.9 ± 9.4 | 65.7 ± 9.9 | 61.2 ± 12.8 | 65.2 ± 13.6 |
| Focal macular ERG amplitudes (μV), mean ± SD | ||||
| Whole a | ||||
| A-wave | 1.98 ± 0.41 | 1.60 ± 0.42 | 1.61 ± 0.45 | 1.62 ± 0.44 |
| B-wave | 4.17 ± 0.93 | 3.40 ± 0.86 | 3.34 ± 0.90 | 3.61 ± 0.63 |
| Photopic negative response | 3.06 ± 0.59 | 1.90 ± 0.56 | 1.75 ± 0.50 | 1.51 ± 0.38 |
| Superior b | ||||
| A-wave | 1.26 ± 0.34 | 0.96 ± 0.25 | 0.98 ± 0.27 | 1.01 ± 0.25 |
| B-wave | 2.30 ± 0.55 | 1.82 ± 0.42 | 1.94 ± 0.65 | 1.98 ± 0.48 |
| Photopic negative response | 2.14 ± 0.46 | 1.25 ± 0.39 | 1.20 ± 0.40 | 1.08 ± 0.38 |
| Inferior c | ||||
| A-wave | 1.15 ± 0.26 | 0.88 ± 0.20 | 0.81 ± 0.28 | 0.92 ± 0.23 |
| B-wave | 2.30 ± 0.53 | 1.84 ± 0.50 | 1.83 ± 0.55 | 1.83 ± 0.49 |
| Photopic negative response | 1.86 ± 0.37 | 1.16 ± 0.38 | 0.91 ± 0.39 | 0.93 ± 0.20 |
| Macular layer thicknesses (μm), mean ± SD | ||||
| Whole a | ||||
| Total d | 265.74 ± 13.47 | 254.48 ± 11.28 | 247.14 ± 13.49 | 237.68 ± 15.72 |
| Ganglion cell complex e | 96.91 ± 6.86 | 83.32 ± 7.28 | 75.85 ± 7.86 | 69.04 ± 7.50 |
| Total minus ganglion cell complex e | 168.85 ± 8.75 | 171.19 ± 7.95 | 171.26 ± 7.64 | 168.66 ± 9.74 |
| Superior b | ||||
| Total d | 267.66 ± 14.31 | 260.28 ± 14.29 | 253.05 ± 16.95 | 241.52 ± 18.90 |
| Ganglion cell complex e | 96.82 ± 7.61 | 87.91 ± 9.40 | 79.65 ± 11.97 | 72.87 ± 11.59 |
| Total minus ganglion cell complex e | 170.88 ± 8.87 | 172.48 ± 8.80 | 173.37 ± 8.42 | 168.71 ± 10.49 |
| Inferior c | ||||
| Total d | 263.80 ± 13.25 | 248.64 ± 12.67 | 241.20 ± 14.66 | 233.84 ± 13.72 |
| Ganglion cell complex e | 97.06 ± 6.56 | 78.75 ± 10.67 | 72.08 ± 9.70 | 65.21 ± 6.44 |
| Total minus ganglion cell complex e | 166.82 ± 8.94 | 169.88 ± 8.20 | 169.14 ± 7.49 | 168.58 ± 9.57 |
e Nerve fiber layer + ganglion cell layer + inner plexiform layer.
Amplitudes of the A-wave also were significantly smaller than normal in the whole, superior, and inferior macular areas in eyes with any stage of glaucoma ( P = .023 to < .001), but the actual differences in mean amplitudes were small (70.4% to 81.8% of normal; Figure 3 , Top left). Similarly, the amplitude of the B-wave was slightly smaller in all macular areas (79.1% to 86.6% of normal) in eyes with any stage of glaucoma ( Figure 3 , Top middle). The mean amplitudes of A-waves and B-waves were not significantly different among eyes with various stages of glaucoma ( Figure 3 , Top left and middle).
Mean total retinal thicknesses and mean ganglion cell complex thicknesses in the whole, superior, and inferior macular areas of eyes with early, moderate, and severe stages of glaucoma were progressively smaller than in normal eyes ( Table 2 ).
Mean total retinal thicknesses, from early to severe, were 95.8%, 93.0%, and 89.4% of normal for the whole macula; 97.2%, 94.5%, and 90.2% of normal for the superior macula; and 94.3%, 91.4%, and 88.6% of normal for the inferior macula. These differences were significant ( P = .01 to < .001) for all stages except for the superior macula in eyes with early OAG ( Figure 3 , Bottom left). In addition, mean thickness of the total retina was significantly less in eyes with severe OAG compared with eyes with early OAG in all (whole, superior, and inferior) macular areas ( P = .001 for all; Figure 3 , Bottom left).
Mean ganglion cell complex thicknesses in eyes with early to severe OAG were 86.0%, 78.3%, and 71.2% of normal for the whole macula; 90.8%, 82.3%, and 75.3% of normal for the superior macula; and 81.1%, 74.3%, and 67.2% of normal for the inferior macula. The differences from normal were significant ( P < .001) for all stages of glaucoma ( Figure 3 , Bottom middle). Differences among groups with OAG showed that with progression of glaucoma, the ganglion cell complex became significantly thinner over the whole macular area ( P = .027 to < .001; Figure 3 , Bottom middle), and in the superior macular area, it was significantly thinner in eyes with moderate or severe OAG compared with eyes with early OAG ( P < .001 and P = .034, respectively), and in the inferior macular area, the ganglion cell complex was significantly thinner in eyes with severe OAG compared with eyes with early OAG ( P < .001; Figure 3 , Bottom middle). The value for total retina minus ganglion cell complex was not significantly different from normal in any macular area (whole, superior, or inferior) for any stage of OAG ( Figure 3 , Bottom right).
Correlation of Photopic Negative Response Amplitude and Ganglion Cell Complex Thickness with Visual Sensitivity
Figure 4 shows correlations between focal macular photopic negative response amplitude ( Figure 4 , Top left, Top middle, Top right) or ganglion cell complex thickness ( Figure 4 , Bottom left, Bottom middle, Bottom right) and visual sensitivity (24-2 SAP results) for the whole macula ( Figure 4 , Top left and Bottom left) or for the opposite (superior or inferior) macular area. As Table 3 shows, photopic negative response amplitude and ganglion cell complex thickness correlated significantly ( P < .001) with each other and with visual sensitivity for the whole macular area and for the opposite (superior or inferior) macular area, whether expressed in linear or logarithmic units.


