Purpose
To evaluate the relationship between rates of change on frequency doubling technology (FDT) perimetry and longitudinal changes in quality of life (QoL) of glaucoma patients.
Design
Prospective observational cohort study.
Methods
One hundred fifty-two subjects (127 glaucoma and 25 healthy) were followed for an average of 3.2 ± 1.1 years. All subjects were evaluated with National Eye Institute Visual Function Questionnaire (NEI VFQ-25), FDT, and standard automated perimetry (SAP). Glaucoma patients had a median of 3 NEI VFQ-25, 8 FDT, and 8 SAP tests during follow-up. Mean sensitivities of the integrated binocular visual fields were estimated for FDT and SAP and used to calculate rates of change. A joint longitudinal multivariable mixed model was used to investigate the association between change in binocular mean sensitivities and change in NEI VFQ-25 Rasch-calibrated scores.
Results
There was a statistically significant correlation between change in binocular mean sensitivity for FDT and change in NEI VFQ-25 scores during follow-up in the glaucoma group. In multivariable analysis with the confounding factors, each 1 dB/year change in binocular FDT mean sensitivity corresponded to a change of 0.8 units per year in the NEI VFQ-25 scores ( P = .001). For binocular SAP mean sensitivity, each 1 dB/year change was associated with 2.4 units per year change in NEI VFQ-25 scores ( P < .001). The multivariable model containing baseline and rate of change information from SAP had stronger ability to predict change in NEI VFQ-25 scores compared to the equivalent model for FDT (R 2 of 50% and 30%, respectively; P = .001).
Conclusion
SAP performed significantly better than FDT in predicting change in NEI VFQ-25 scores in our population, suggesting that it may still be the preferable perimetric technique for predicting risk of disability from the disease.
Glaucoma is an optic neuropathy characterized by progressive degeneration of retinal ganglion cells, leading to characteristic changes to the optic nerve and loss of visual function. The main goal of glaucoma treatment is to prevent patients from developing significant functional loss that could lead to disability and decrease in quality of life (QoL). The understanding of how visual function loss in glaucoma affects QoL is important in guiding therapeutic decisions. Such assessment has frequently been done by evaluating the relationship between visual field loss, as measured by standard automated perimetry (SAP), and QoL outcomes, as measured by standardized questionnaires such as the National Eye Institute Visual Function Questionnaire (NEI VFQ-25).
In a recent longitudinal study, we demonstrated that rates of progressive visual field loss on SAP were significantly associated with decline in QoL over time. However, although SAP remains the gold-standard test for assessing functional loss in glaucoma, other tests have been proposed, such as frequency doubling technology (FDT) perimetry. FDT is based on the hypothesis that contrast sensitivity to frequency doubling stimuli (low-spatial-frequency gratings flickering at high temporal frequency) is reduced in glaucoma. The test has been shown to perform as well as, if not better than, SAP for detection of glaucomatous visual field defects with high sensitivity and specificity and less variability in areas of low sensitivity. Recent studies have also suggested that FDT perimetry may detect progressive visual field defects not apparent on SAP.
FDT has been proposed as a selective perimetric test that attempts to target the parasol ganglion cells (M cells). These cells project to the magnocellular layers of the lateral geniculate nucleus and are sensitive to low contrast and to high-temporal- and low-spatial-frequency stimuli linked to motion perception. In contrast, SAP is not selective for a particular ganglion cell type and any of the primary ganglion cell subtypes can respond to an achromatic stimulus presented on an achromatic background. Although the selectivity of FDT testing has been a matter of controversy, it is conceivable that owing to their different stimulus properties, these tests may have different relationships with measures of QoL.
The purpose of the present study was to evaluate and compare the relationship between progressive visual field loss in FDT and SAP with changes in QoL as measured by the NEI VFQ-25 questionnaire in a cohort of glaucoma patients followed over time.
Methods
This was an observational cohort study. Participants from this study were included in a prospective longitudinal study designed to evaluate functional impairment in glaucoma, the Diagnostic Innovations in Glaucoma Study: Functional Impairment, conducted at the Visual Performance Laboratory, Department of Ophthalmology, University of California San Diego. Written informed consent was obtained from all participants. This study received institutional review board approval and the methodology adhered to the tenets of the Declaration of Helsinki and to the Health Insurance Portability and Accountability Act.
At each visit during follow-up, subjects underwent a comprehensive ophthalmic examination, including review of medical history, best-corrected visual acuity, slit-lamp biomicroscopy, intraocular pressure measurement using Goldmann applanation tonometry, gonioscopy, dilated ophthalmoscopic examination using a 78-diopter lens, and stereoscopic photographs of the optic nerves. Only patients with open angles on gonioscopy were included. Subjects with coexisting retinal disease, uveitis, or nonglaucomatous optic disc neuropathy were excluded from the study.
This study enrolled glaucoma patients diagnosed based on the presence of glaucomatous optic neuropathy and/or repeatable visual field defects. As SAP and FDT were being compared, we avoided a classification of glaucoma based solely on the presence of visual field defects by one or the other perimetric technique. Glaucomatous appearance of the optic disc was determined by the presence of neuroretinal rim thinning, excavation, or retinal nerve fiber layer defects as evaluated by masked assessment of stereoscopic photographs. Visual field defects were determined by the presence of pattern standard deviation with P < .05, and/or glaucoma hemifield test results outside normal limits for both perimetric techniques.
We also enrolled a group of 25 healthy subjects with normal optic disc evaluation and normal SAP and FDT results (defined as a pattern standard deviation within 95% confidence limits and a glaucoma hemifield test result within normal limits). The NEI VFQ-25 questionnaires were obtained annually, and both SAP and FDT tests were obtained at 6-month intervals. For inclusion, all subjects were required to have had a minimum of 2 NEI VFQ-25 questionnaires and at least 5 SAP and 5 FDT tests during follow-up.
Perimetric Testing
All patients underwent SAP testing with the Swedish interactive threshold algorithm (SITA) standard 24-2 strategy using the Humphrey Field Analyzer II (Carl Zeiss Meditec, Inc, Dublin, California, USA). FDT was performed using the Humphrey matrix (Carl-Zeiss Meditec, Inc) with 24-2 threshold strategy. Only reliable tests were included (less than 33% fixation losses and false negatives, and less than 15% false positives). An integrated binocular field was obtained using the monocular fields for the right and left eyes according to the binocular summation technique described by Nelson-Quigg and associates. After binocular summation thresholds were obtained, an average of all thresholds was calculated to obtain the mean sensitivity for FDT and SAP.
Rasch Analysis of the NEI VFQ-25 Questionnaire
QoL was assessed by the NEI VFQ-25 questionnaire. This questionnaire consists of 25 questions measuring overall vision, difficulty with near-vision and distance activities, ocular pain, driving difficulties, limitations with peripheral vision and color vision, social functioning, role limitations, dependency, and mental health symptoms related to vision plus an additional single-item general health rating question. Rasch analysis was performed to obtain final estimates of “person measures” or Rasch scores, summarizing the NEI VFQ responses.
We have previously published the details of the Rasch modeling procedure in this population. In brief, Rasch scores can be used to express where each respondent falls on a linear scale representing the degree of impairment as measured by the NEI VFQ-25 and can be used for subsequent parametric statistical analyses. Rasch analysis was performed using Andrich rating-scale models to obtain the estimates of the required ability of each item, perceived ability of each subject, and the category thresholds for each response category. Rasch analysis locates item difficulty and person ability on a logit (log odds) scale. Person ability scores were rescaled linearly to range from 0 to 100. Person and item measures were examined for fit to the Rasch model using infit and outfit item fit statistics, and model fitting has been previously described.
In order to account for lack of unidimensionality, the final Rasch model used only the items belonging to the general vision, near vision, distance vision, peripheral vision, color vision, and social functioning subscales. Items belonging to dependency (3 items), mental health (3 items), and role limitations (2 items) were excluded, as previous work has found these items belong to a separate socio-emotional dimension not directly related to visual functioning. In addition, the 2 items belonging to the subscale of ocular pain were also excluded, as they could not fit into the Rasch model. This is also an expected result, as ocular pain would likely produce changes in QoL that are not directly related to those produced by loss of vision from glaucoma.
Clinical, Demographic, and Socioeconomic Variables
Visual acuity was measured using the Early Treatment Diabetic Retinopathy Study chart and change in visual acuity during follow-up was calculated as the difference between the logMAR visual acuity at the last follow-up visit and at the baseline visit. We also collected information about marital status (married [yes/no]), presence of health insurance (yes/no), degree of education (at least high school degree [yes/no]), and income (less than $25,000/year [yes/no]).
Presence or history of systemic medical conditions was also investigated, including diabetes mellitus, arthritis, high blood pressure, heart disease, stroke, depression, asthma, and cancer. A simple summation score was used to create a comorbidity index ranging from 1 to 4. In addition, we collected information on whether the patient had undergone glaucoma filtering surgery and/or cataract surgery during follow-up. As these variables could potentially affect patient perceptions about QoL, they were included as potentially confounding factors in the analysis of relationship between FDT and SAP with NEI VFQ-25 results.
Statistical Analyses
The investigation of the association between NEI VFQ-25 scores, FDT, and SAP data was performed with a joint multivariable longitudinal linear mixed model. Details about this model have been presented elsewhere. In this type of analysis the average evolution of a specific response is described using a linear function of time, and subject-specific deviations from this average evolution are introduced by random intercepts and random slopes, allowing the study of effects of different baseline values and different rates of change for each patient. In a joint-modeling approach using mixed models, the random effects are determined for each response process and different processes are associated by imposing a joint multivariable distribution on the random effects.
Multivariable linear regression models were also performed to evaluate the association between rates of change on FDT, SAP, and NEI VFQ-25 scores after adjusting for potentially confounding socioeconomic and clinical variables. Statistical analysis was performed using commercially available software Winsteps version 3.81.0 (Chicago, Illinois, USA) and Stata version 13 (StataCorp LP, College Station, Texas, USA). The alpha level (type I error) was set at 0.05.
Results
The study included 254 eyes of 127 glaucoma patients and 50 eyes of 25 healthy participants. Table 1 summarizes clinical and demographic characteristics of included subjects. In the glaucoma group mean age at baseline was 65.8 ± 12.3 years. Glaucoma patients were followed for an average of 3.2 ± 1.1 years and had a median of 3 NEI VFQ-25 questionnaires, 8 FDT tests, and 8 SAP tests. Mean ± standard deviation (SD) of the binocular mean sensitivity at baseline was 24.5 ± 4.5 dB and 29.5 ± 3.2 dB (for FDT and SAP, respectively).
| Variables | Glaucoma Group (n = 127) | Control Group (n = 25) |
|---|---|---|
| Age, y | 65.8 ± 12.3 | 48.0 ± 10.9 |
| Sex, % female | 48% | 72% |
| Race, % black | 24% | 32% |
| LogMAR visual acuity (better eye) | −0.06 ± 0.11 | −0.10 ± 0.10 |
| LogMAR visual acuity (worse eye) | 0.03 ± 0.17 | −0.07 ± 0.11 |
| FDT (median number of tests and IQR) | 8 (5–9) | 7 (6–8) |
| FDT baseline MD (better eye), dB | −2.5 ± 4.1 | −0.3 ± 1.8 |
| FDT baseline MD (worse eye), dB | −5.7 ± 5.6 | −1.3 ± 1.9 |
| SAP (median number of tests and IQR) | 8 (6–10) | 7 (6–8) |
| SAP baseline MD (better eye), dB | −1.4 ± 3.4 | 0.4 ± 0.9 |
| SAP baseline MD (worse eye), dB | −4.0 ± 5.7 | −0.1 ± 0.8 |
| FDT baseline binocular mean sensitivity, dB | 24.5 ± 4.5 | 28.5 ± 2.0 |
| SAP baseline binocular mean sensitivity, dB | 29.5 ± 3.2 | 32.5 ± 0.8 |
| NEI VFQ-25 (median number of questionnaires and IQR) | 3 (2–3) | 2 (2–3) |
| Baseline NEI VFQ-25 score | 67.8 ± 21.6 | 82.8 ± 20.5 |
| Filtering surgery during follow-up, % yes | 6% | 0% |
| Cataract surgery during follow-up, % yes | 9% | 0% |
| Education, % with at least high school degree | 96% | 92% |
| Income, lower than $25,000 | 7% | 0% |
| Marital status, % married | 70% | 64% |
| Comorbidity index | 1.2 ± 1.1 | 0.4 ± 0.6 |
| Health insurance, % yes | 93% | 96% |
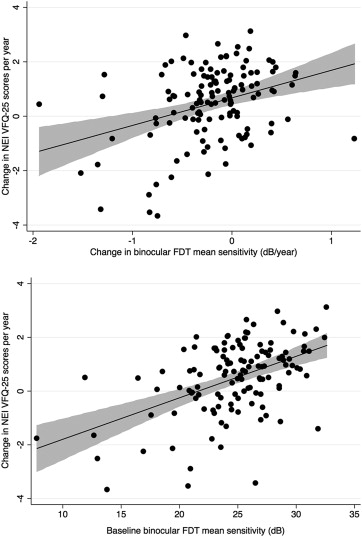
There was a significant correlation between change in NEI VFQ-25 scores and change in binocular FDT mean sensitivity during follow-up (R 2 = 14%; P < .001) ( Figure 1 , Top). There was also a relationship between severity of the visual field defect on FDT perimetry at baseline and change in NEI VFQ-25 scores. Subjects with more severe disease at baseline were more likely to have a decrease in NEI VFQ-25 scores during follow-up (R 2 = 23%; P < .001) ( Figure 1 , Bottom). In a multivariable model including both baseline and rate of change in FDT mean sensitivity, each 1 dB/year change in binocular FDT mean sensitivity corresponded to a change of 0.8 units/year in NEI VFQ-25 scores.
There was also a correlation between change in binocular SAP mean sensitivity and NEI VFQ-25 scores during follow-up (R 2 = 44%, P < .001) ( Figure 2 , Top). Eyes with more severe disease measured by SAP at baseline were also more likely to have a decrease in NEI VFQ-25 scores during follow-up (R 2 = 27%, P < .001) ( Figure 2 , Bottom). In a multivariable model including both baseline and rates of SAP mean sensitivity change, each 1 dB/year change in binocular SAP mean sensitivity was associated with a change of 2.2 units per year in NEI VFQ-25 scores. The predictive ability of the multivariable model containing baseline and longitudinal SAP information (R 2 = 50%) was superior to that of the equivalent model for FDT (R 2 = 30%; P = .001).
Table 2 shows multivariable models for predicting change in NEI VFQ-25 scores while adjusting for potentially confounding variables. Both FDT and SAP rates of change were still predictors of change in NEI VFQ-25 scores ( P = .001, P < .001, respectively) after adjustment for confounding variables. Because of the strong correlation between rates of change for FDT and SAP (R 2 = 62%; P < .001), it was not possible to include both metrics as predictors of change in NEI VFQ-25 scores in the same model owing to multicollinearity.
| Variables | FDT | SAP | ||
|---|---|---|---|---|
| Coefficient (95% CI) | P Value | Coefficient (95% CI) | P Value | |
| Change in binocular mean sensitivity (dB/y) | 0.86 (0.35–1.37) | .001 | 2.47 (1.84–3.10) | <.001 |
| Baseline binocular mean sensitivity, dB | 0.11 (0.06–0.17) | <.001 | 0.10 (−0.03–0.72) | .001 |
| Change in visual acuity, per 0.1 logMAR | 0.08 (−1.44–1.57) | .938 | 0.46 (−0.46–1.39) | .322 |
| Age, per decade older | −0.05 (−0.04–0.25) | .593 | −0.03 (−0.14–0.20) | .942 |
| Sex, female | 0.62 (0.21–1.30) | .003 | 0.46 (0.11–0.82) | .011 |
| Race, black | 0.38 (−0.04–0.80) | .107 | 0.23 (−0.12–0.5) | .279 |
| Filtering surgery during follow-up, yes | 0.08 (−0.81–0.98) | .741 | 0.03 (−0.61–0.62) | .074 |
| Cataract surgery during follow-up, yes | 0.35 (−0.37–1.07) | .524 | 0.05 (−0.22–0.62) | .519 |
| Comorbidity index | −0.04 (−0.22–0.13) | .575 | −0.06 (−0.22–0.08) | .431 |
| Education, with at least high school degree | −0.02 (−1.20–1.15) | .993 | −0.69 (−1.75–0.36) | .083 |
| Income, lower than $25,000 | 0.23 (−0.04–0.51) | .211 | 0.14 (−0.09–0.38) | .311 |
| Marital status, married | 0.25 (−0.23–0.74) | .267 | 0.22 (−0.19–0.63) | .209 |
| Insurance, yes | −0.03 (−0.93–0.94) | .955 | −0.23 (−1.01–0.54) | .772 |
Stay updated, free articles. Join our Telegram channel

Full access? Get Clinical Tree


