Purpose
To determine the correlation between the recovery of foveal microstructure and the visual acuity or the foveal sensitivity after idiopathic macular hole (MH) closure.
Design
Prospective, consecutive, observational case series.
Methods
We studied 43 eyes of 43 patients before and 1, 3, and 6 months after MH surgery. The best-corrected visual acuity (BCVA), the foveal sensitivity measured by MP1 microperimetry, and the photoreceptor inner and outer segment (IS/OS) junction and the external limiting membrane (ELM) determined by spectral-domain optical coherence tomography were investigated.
Results
Preoperatively, the lengths of the IS/OS junction defect and the ELM defect were significantly correlated with only the foveal sensitivity ( P < .0001). At all postoperative times, the lengths of both the IS/OS and ELM defects were significantly correlated with both the BCVA and the foveal sensitivity ( P < .05 for all). The preoperative lengths of both the IS/OS and ELM defects were significantly correlated with the foveal sensitivity at 6 months after surgery ( P = .0022, P = .0031, respectively). The IS/OS junction defect was significantly correlated with the ELM defect at all times ( P < .0001 for all). No restoration of the IS/OS junction was observed in eyes without the ELM restoration.
Conclusions
The restoration of the ELM is closely associated with that of the IS/OS junction. The preoperative IS/OS or ELM defect was associated with the postoperative foveal sensitivity. The restoration of not only the IS/OS junction but also the ELM may reflect the morphologic and functional recovery of the foveal photoreceptors in surgically closed MHs.
The anatomic success rates of macular hole (MH) surgery have been reported to be 85% to 100%, and significant improvements of the visual acuity have been found in 85% to 95% of these eyes. However, even with a closed MH, the postoperative best-corrected visual acuity (BCVA) was still not satisfactory in some cases. Histopathologic studies of autopsy eyes with an MH showed intraretinal changes including cystic retinal edema and disruption of the photoreceptor layer surrounding the MH.
With improvements of optical coherence tomography (OCT), the pathologic changes surrounding an MH can be observed in much greater detail in vivo. Ultrahigh-resolution OCT (UHR-OCT, 3 μm of axial resolution) and spectral-domain OCT (SD-OCT, 5 to 6 μm of axial resolution) have improved the ability to detect intraretinal microstructures and to identify pathologic changes in the retinal architecture in various diseases. For example, the junction between the inner and outer segments of the photoreceptors (IS/OS junction), and the junction between the inner segments and the Müller cells, the external limiting membrane (ELM), can be clearly detected. Several studies using UHR-OCT or SD-OCT have reported on the relationship between the restoration of only outer photoreceptor layer (IS/OS junction) and the recovery of the BCVA after successful MH closure. There is only 1 report on the relationship between the ELM restoration and the BCVA recovery. However, the relationship between the restoration of the IS/OS junction or the ELM and the recovery of the foveal sensitivity remains unclear. Also, the relationship between the restoration of the IS/OS junction and that of the ELM is unknown.
Thus, the purposes of this study were to determine the relationship between the restoration of the foveal microstructure and the foveal sensitivity after successful MH surgery, and to study the relationship between the restoration of the IS/OS and that of the ELM. To accomplish this, we analyzed SD-OCT images in terms of the IS/OS junction and the ELM after idiopathic MH closure.
Subjects and Methods
This prospective study was designed to examine patients with an idiopathic MH who were scheduled to undergo MH surgery. Forty-five patients who underwent pars plana vitrectomy for an MH at the Chiba University Hospital from April 1, 2009 to April 30, 2010 were studied. Cases with traumatic or secondary macular holes, myopic eyes with a refractive error of more than −8.00 diopters, and cases in which the MH was not closed after the primary surgery were excluded.
Two patients were lost to follow-up; therefore the results from 43 patients (16 men and 27 women) were used for the statistical analyses. The age of the patients ranged from 40 to 78 years (65.5 ± 7.3 [mean ± standard deviation] years). The interval between the onset of the visual disturbances and the time of surgery was estimated from the reports of the patients. The mean duration of symptoms was 3.4 ± 1.7 months. All patients were diagnosed with a stage 2, 3, or 4 idiopathic MH according to the Gass classification. The stage of the MH was classified as stage 2 in 13 eyes, stage 3 in 19 eyes, and stage 4 in 11 eyes. All patients had a standard ophthalmologic examination before and 1, 3, and 6 months after the surgery. The examination included BCVA, applanation tonometry, slit-lamp biomicroscopy, indirect ophthalmoscopy, color fundus photography, and retinal sensitivity measurements. The BCVA was measured with a standard Japanese Landolt visual acuity chart and converted into logarithm of minimal angle of resolution (logMAR) units for the statistical analyses.
The retinal sensitivity was measured with the Microperimetry 1 (MP1) using the software embedded in the 2006 model (Nidek MP1, NAVIS software version: MP1 SW 1.4.1.SP1; Nidek Technologies, Gamagori, Japan) with automated correction for eye movements. The follow-up examinations were made exactly over the previously tested retinal points. The auto-tracking system calculated the x and y coordinates and rotational shifts relative to a reference frame obtained by an infrared camera at the beginning of the examination and returned a map of the patient’s eye movements during the examination. Goldmann III stimuli and a 4-2 staircase strategy were used, and a rectangular 3 × 3-degree test grid with 24 stimulus locations covering an area of 10 degrees was used. The stimulus was projected onto a white background set at 1.27 cd/m 2 , and the stimulus duration was 100 msec. The differential luminance, defined as the difference between stimulus luminance and background luminance, was 127 cd/m 2 at 0 dB stimulation, and the maximum stimulus attenuation was 20 dB. The foveal sensitivity was defined as the mean retinal sensitivity for the 4 stimulus locations covering the central 2 degrees.
The preoperative data included the findings of medical and ophthalmic history, duration of symptom, preoperative BCVA, foveal sensitivity, lens status, clinical stage of MH, and MH diameter measured on the SD-OCT images. In all patients, the SD-OCT images of the foveal microstructures were determined on the same day as the clinical examination.
A 23-gauge system was used for the pars plana vitrectomy. The surgeries were performed by 3 surgeons (Y.M., T.B., and S.Y.). The vitrectomy was combined with phacoemulsification and aspiration with intraocular lens implantation in all cases. The internal limiting membrane (ILM) was removed in all eyes using triamcinolone acetonide (TA) or indocyanine green (ICG) to make the ILM more visible. TA was used in 16 eyes and ICG in 27 eyes. The ILM was peeled with forceps for 2 to 3 optic disc diameters around the MH under direct observation. A sulfur hexafluoride (SF 6 ) gas tamponade was used in all cases, and patients were instructed to maintain a prone position for 4 to 6 days. The closure of MH was confirmed as flat/closed by the postoperative OCT images.
Measuring Foveal Microstructures on Spectral-Domain OCT Images
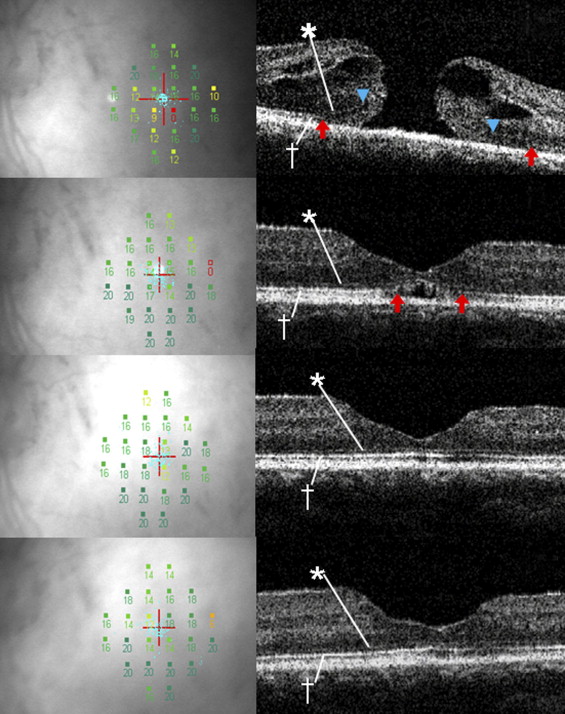
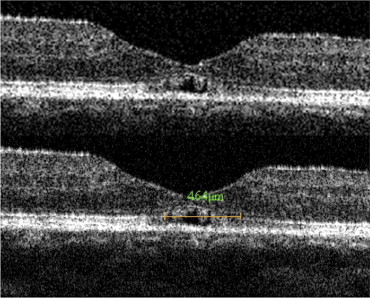
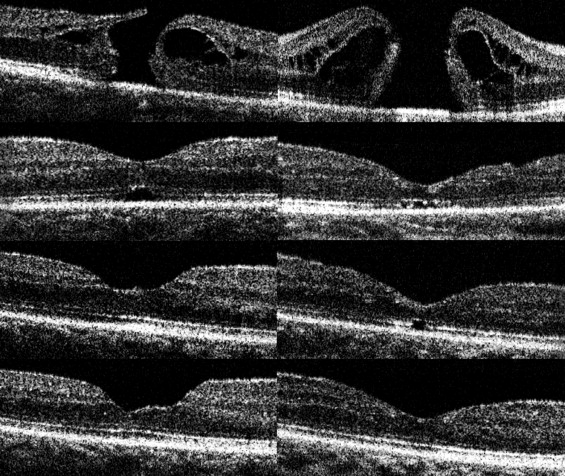
Images of the microstructure of the fovea were obtained by SD-OCT (RTVue-100, Optovue Inc, Fremont, California, USA) ( Figures 1-3 ). Three horizontal and 3 vertical 6-mm B-scan cross-sectional images were obtained from each eye. Scans with a signal strength index of more than 50.0 were considered appropriate, and representative (1 horizontal and 1 vertical) images were selected for the statistical analyses. The IS/OS junction and the ELM were considered to be intact in images in which they were continuous and accompanied with signal intensity similar to that in the peripheral macula. The linear distance between the disruption points of the IS/OS junction or the ELM was calculated by the caliper function on the software package in the 6-mm cross-sectional OCT image ( Figures 1 and 2 ). The IS/OS junction defect or the ELM defect was determined by averaging the horizontal and vertical lengths of each defect. The borders of the IS/OS junction and ELM defects were determined by 2 of the authors (T.B. and M.K.) who were masked to the BCVA, foveal sensitivity, and other clinical information. When their evaluations did not agree, the opinion of a third observer (Y.M.) was invited and the results were discussed until consensus was reached. The basal diameter of the MH was also calculated by the caliper function.
Statistical Analyses
Correlations between the SD-OCT measurements and the BCVA or the mean foveal sensitivity in the central 2 degrees were studied. Kruskal-Wallis 1-way analysis of variance (ANOVA) by ranks was performed to compare the changes between the preoperative and postoperative measurements. Correlations between the SD-OCT findings and the visual functions were analyzed with the Spearman rank correlation test. All analyses were conducted using JMP 8 (SAS Inc, Cary, North Carolina, USA). A P < .05 was considered to be significant.
Results
Postoperative Changes of Visual Acuity, Foveal Sensitivity, and Foveal OCT Findings
The mean preoperative BCVA was 0.72 ± 0.31 logMAR units. The mean postoperative BCVA was 0.51 ± 0.34 logMAR units at 1 month, 0.36 ± 0.28 logMAR units at 3 months, and 0.26 ± 0.25 logMAR units at 6 months. At all postoperative times, the BCVA significantly improved as compared with the preoperative BCVA ( P < .0001 for all). The mean preoperative foveal sensitivity was 8.28 ± 4.25 dB. The mean postoperative foveal sensitivity was 11.75 ± 3.37 dB at 1 month, 12.25 ± 3.64 dB at 3 months, and 13.31 ± 3.63 dB at 6 months. The postoperative foveal sensitivity at all times was significantly better than the preoperative foveal sensitivity ( P < .0001 for all).
The mean preoperative diameter of MH was 767.5 ± 249.1 μm. The mean preoperative length of the IS/OS junction defect was 1253.5 ± 335.0 μm, and this was reduced to 680.6 ± 471.2 μm at 1 month, 432.7 ± 483.8 μm at 3 months, and 211.7 ± 369.0 μm at 6 months. The mean preoperative length of the ELM defect was 752.9 ± 349.1 μm, and it was 219.4 ± 341.6 μm at 1 month, 123.2 ± 280.4 μm at 3 months, and 76.5 ± 208.8 μm at 6 months postoperatively. For both the IS/OS junction defect and the ELM defect, the postoperative values at 1, 3, and 6 months were significantly reduced as compared with the preoperative values ( P < .0001 for all).
Correlation Between Foveal OCT Parameters and Visual Function
The Table shows the correlation between foveal OCT parameters and visual function. The preoperative length of the IS/OS junction defect was significantly correlated with the preoperative foveal sensitivity (r = −0.56; P < .0001) but not with the preoperative BCVA (r = 0.11; P = .4614). Similarly, the preoperative ELM linear defect was significantly correlated with the preoperative foveal sensitivity (r = −0.56; P < .0001) but not with the BCVA (r = 0.11; P = .4497).


