Purpose
To investigate the relation between the optical coherence tomography (OCT) findings and retinal sensitivity in patients with retinitis pigmentosa (RP) by assessing the retinal thickness and retinal function using Fourier-domain OCT (FD-OCT) and microperimetry, respectively.
Design
Observational case series.
Methods
Fifty-nine patients (118 eyes) were enrolled, mean age 47 ± 14.8 years. Thirty-two healthy subjects (HS) were enrolled as a control group. Patients were assessed by means of FD-OCT and microperimetry. We analyzed the average foveal thickness (diameter of 1 mm centered on the point of fixation), the value of the retinal sensitivities corresponding to the 4 degrees centered on the fixation point, and logMAR visual acuity for regression analysis converted from Snellen chart.
Results
We distinguished 4 groups of RP patients according to the macular pattern seen on OCT images. The first group of 36 eyes, mean age of 33.5 ± 7.4 years, had no macular changes, mean best-corrected visual acuity (BCVA) of 0.95 ± 0.07, mean foveal thickness of 256.3 ± 9.14 μm, and mean retinal sensitivities inside the central 4 degrees of 19.27 ± 0.87 dB ( P > .05 for all the values). The second group of 28 eyes, mean age 35.4 ± 6.3 years, showed clinical macular edema (CME) on OCT images with mean BCVA of 0.72 ± 0.22, mean foveal thickness of 363.5 ± 93.45 μm, and mean retinal sensitivity inside the central 4 degrees of 15.94 ± 3.6 dB ( P < .01 for all the values). The third group of 26 eyes, mean age 50.8 ± 8.7 years, showed macular vitreoretinal traction on OCT images with a mean BCVA of 0.5 ± 0.2, mean foveal thickness of 337.1 ± 71.7 μm, and mean retinal sensitivity inside the central 4 degrees of 11.78 ± 3.09 dB ( P < .01 for all the values). The last group of 28 eyes, mean age 52.1 ± 13.6 years, showed macular retinal thinning on OCT images with mean BCVA of 0.36 ± 0.15, mean foveal thickness of 174.2 ± 24.40 μm, and mean retinal sensitivity inside the central 4 degrees of 10.22 ± 3.82 dB ( P < .01 for all the values).
Conclusions
MP-1 and FD-OCT showed high sensitivity for identifying functional and structural macular abnormalities, respectively. Future studies should investigate the relationships among photoreceptor cell loss, retinal sensitivity, and fixation in patients with RP.
The term retinitis pigmentosa (RP) comprises a heterogeneous group of genetic retinal disorders that primarily affect the rod and cone photoreceptors and retinal pigment epithelium (RPE). RP is a slowly progressive disease and typically affects the rods before the cones. RP can be an isolated finding, or it can be associated with other systemic conditions. Several genes are associated with RP, which can be inherited as an X-linked, autosomal dominant, or autosomal recessive condition. Cases of RP with no known family history, referred to as RP simplex, can also occur. RP can predispose patients to cystoid macular edema (CME), epiretinal membranes (ERM), and macular thinning. Time-domain optical coherence tomography (TD-OCT) is a recognized method for determining retinal structure in vivo and is particularly useful and accurate for measuring retinal thickness. Several OCT studies on RP have been reported, and most show the capability of OCT to recognize and follow CME in RP patients. However, visualizing, quantifying, and following microstructural changes within the photoreceptor and RPE layers is difficult using TD-OCT, which lacks an eye-tracking system and has a low-definition image.
Recently, improvements in OCT technology have been introduced. Fourier-domain optical coherence tomography (FD-OCT) provides increased axial resolution and scanning speed by recording the interferometric information using a Fourier-domain spectrometric method, instead of adjusting the position of a reference mirror. The resolution is up to 5 times that of conventional TD-OCT, and the imaging speed is up to 100 times the speed of conventional TD-OCT. Several studies have shown that FD-OCT is capable of imaging retinal pathologies in great detail. Recently, Spectralis OCT (Heidelberg Engineering, Heidelberg, Germany) was introduced for retinal imaging. The instrument features an eye-tracking device that corrects for eye movement during the scanning process. Implementation of eye tracking should lead to highly reproducible measurements of retinal thickness.
Many previous studies used the best-corrected visual acuity (BCVA) to evaluate retinal function. The introduction of fundus-related microperimetry allowed retinal sensitivity to be measured in maculopathy patients in order to assess macular function. The scanning laser ophthalmoscope (SLO; Rodenstock GmbH, Munich, Germany) has been the only commercial microperimeter available until recently, when a new instrument called Microperimeter 1 (MP-1, NIDEK Technologies, Padova, Italy) was introduced. With this instrument, the exact correlation between fundus disease and corresponding functional defects is determined by integrating real fundus imaging and computerized threshold perimetry. In the present study, we investigated the relation between the FD-OCT findings and retinal sensitivity in patients with retinitis pigmentosa by assessing the retinal thickness and retinal function using FD-OCT and microperimetry, respectively.
Materials and Methods
This study was an observational case series. Fifty-nine patients (118 eyes) were enrolled (mean age, 47 ± 14.8 years). The patients had retinitis pigmentosa and had been followed in the Department of Retinal Inherited Disease of the University of Rome “La Sapienza” for at least 3 years. Thirty-one patients were male and 28 were female. Of the 59 patients, 12 had autosomal dominant retinitis pigmentosa; 11, autosomal recessive retinitis pigmentosa; five, X-linked recessive retinitis pigmentosa; and 31, simplex retinitis pigmentosa. Thirty-two healthy subjects, 18 male and 14 female, were enrolled as a control group.
All subjects underwent a complete ophthalmologic examination, including BCVA with the Snellen method, Goldmann applanation tonometry, biomicroscopy of the anterior segment, indirect ophthalmoscopy of the retina, FD-OCT (Spectralis OCT, Heidelberg Engineering), microperimetry (MP-1; NIDEK Technologies), electroretinogram (ERG), and visual evoked potential (VEP).
The diagnosis of RP was based on the clinical findings, including compromised night and side vision, characteristic funduscopic findings, and reduced or nondetectable rod and cone a- and b-wave amplitudes as shown by electroretinography (ERG). Upon ophthalmoscopic examination, we found retinal pigmentary changes with arteriolar narrowing and a pale optic disc.
Patients younger than 18 years and those with any additional ocular disease, including glaucoma, ametropias of more than 6 diopters (D), severe opacities of the lens, and systemic diseases (particularly diabetes and hypertension), were excluded from the study.
Spectralis OCT
Patients underwent OCT performed with a Spectralis OCT (Heidelberg Engineering), in a pattern of 20 × 15-degree raster scans consisting of 19 high-resolution line scans, using a volumetric software protocol. Spectralis OCT allows up to 40 000 A-scans/s with a depth resolution of 7 μm in tissue and a transverse resolution of 14 μm by using a superluminescence diode with an 870-nm bandwidth. Furthermore, Spectralis OCT provides an automatic real-time (ART) function for increased image quality. With ART activated, multiple frames (B-scans) of the same location are performed during the scanning process, and the images are averaged to reduce noise. In our study, the number of frames was adjusted at 19 to improve image quality.
An eye tracker minimizes the effects of ocular movements. Retinal thickness (RT) was measured between the internal limiting membrane (ILM) and RPE. For statistical analysis, we used the average foveal thickness (1-mm diameter centered on the point of fixation). The CME, an intraregional hyporeflective area in the OCT images, was classified according to Otani and associates. Vitreoretinal traction was defined as hyper-reflective lines at the ILM. According to Grover and associates, we defined macular thinning as a fovea value ≤247.7 μm. We used the standardized method of Chan and associates for OCT image analysis.
All subjects had their pupils dilated with tropicamide 1% before the examinations.
Microperimetry
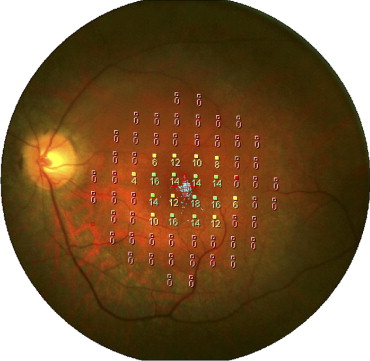
We used a MP-1 (NIDEK Technologies) for microperimetry, which was performed in all subjects with a red cross of 2 degrees as the fixation target, white background illumination of 4 apostilbs, Goldmann III stimuli with a projection time of 200 ms, and a customized grid of 68 stimuli around 10 degrees centered on the fovea ( Figure 1 ). We used a 4-2 staircase strategy, and the initial projecting senility was fixed at 8 dB. We analyzed the value corresponding to 4 degrees centered on the fixation point. The fixation pattern, stability, and fixation zone were classified according to Fujii and associates.
Statistical Analysis
The results are expressed as the mean ± standard deviation (SD). For the statistical analysis, we used SPSS ver. 14.0.1 for Windows (SPSS, Chicago, Illinois, USA). Statistical calculations were performed using individual logarithm of minimal angle of resolution (logMAR) acuity data, not decimal values, and the results were converted back, according to the procedure outlined by Holladay. To compare values between the RP patients and the healthy control group, we used the Student 2-tailed t test. The Pearson correlation test and linear regression analysis were used to analyze the effect of mean foveal central thickness on the logMAR visual acuity and retinal sensitivity. A P value <.05 was considered statistically significant.
Results
We enrolled 59 patients (118 eyes), with a mean age of 47.4 ± 14.8 years, who were affected by RP. As a control group, we enrolled 32 healthy subjects with a mean age of 52.1 ± 13.3 years, mean BCVA of 0.9 ± 0.06, mean foveal thickness of 276.3 ± 12.2 μm, and mean sensitivity of 19.8 ± 0.1 dB.
We distinguished 4 groups of RP patients according to the macular pattern seen on OCT images ( Table 1 , Figure 2 ). The first group of 36 eyes (10 male subjects, 8 female; mean age, 33.5 ± 7.4 years) had no macular changes, a mean BCVA of 0.95 ± 0.07, mean foveal thickness of 256.3 ± 9.14 μm, no retinal sensitivity in the peripheral visual field, and mean retinal sensitivity inside the central 4 degrees of 19.27 ± 0.87 dB. We did not find any significant difference in BCVA, foveal thickness, or retinal sensitivity between Group I and the healthy subjects ( P > .05). Linear regression of logMAR versus foveal thickness and retinal sensitivity versus foveal thickness gave r values of 0.073 and 0.329, respectively ( Table 2 ).
| Patient Group a (Number of Eyes; Mean Age; Male-Female Ratio) | BCVA (logMAR), Mean ± SD | Retinal Thickness (μm), Mean ± SD | Retinal Sensitivity (dB), Mean ± SD |
|---|---|---|---|
| Group I (36 eyes; 33.5 ± 7.4 years; 10M:8F) | 0.03 ± 0.03 b | 256.3 ± 9.14 b | 19.27 ± 0.87 b |
| Group II (28 eyes; 35.4 ± 6.3 years; 8M:6F) | 0.17 ± 0.16 | 363.5 ± 93.45 | 15.94 ± 3.60 |
| Group III (26 eyes; 50.8 ± 8.7 years; 6M:7F) | 0.32 ± 0.20 | 337.1 ± 71.7 | 11.78 ± 3.09 |
| Group IV (28 eyes; 52.1 ± 13.6 years; 7M:7F) | 0.50 ± 0.24 | 174.2 ± 24.40 | 10.22 ± 3.82 |
| HS (64 eyes; 52.1 ± 13.3 years; 18M:14F) | 0.04 ± 0.03 | 276.3 ± 12.2 | 19.8 ± 0.1 |
a Retinitis pigmentosa (RP) study population was divided into 4 groups according to the macular pattern seen on optical coherence tomography (OCT) images. Group I: patients affected by RP with no abnormalities at OCT images; Group II: RP patients affected by macular edema; Group III: RP patients affected by vitreomacular traction; Group IV: RP patients affected by retinal thinning. All the groups were compared with the HS for statistical significance by means of 2-tailed t test.
| Group a | BCVA (logMAR) vs Retinal Thickness (μm) | Retinal Sensitivity (dB) vs Retinal Thickness (μm) | ||||
|---|---|---|---|---|---|---|
| r | r 2 | P b | r | r 2 | P b | |
| I | 0.073 | 0.05 | .781 | 0.329 | 0.108 | .007 |
| II | 0.930 | 0.866 | <.001 | 0.786 | 0.618 | <.001 |
| III | 0.786 | 0.618 | .02 | 0.840 | 0.705 | <.001 |
| IV | 0.819 | 0.670 | <.001 | 0.791 | 0.626 | .021 |
Stay updated, free articles. Join our Telegram channel

Full access? Get Clinical Tree


