Purpose
To investigate the epithelial thickness in the cornea and limbus in limbal stem cell deficiency (LSCD) by using in vivo laser scanning confocal microscopy.
Design
Cross-sectional comparative study.
Methods
Confocal images of 48 eyes of 35 patients with LSCD collected by the Heidelberg Retina Tomograph III Rostock Corneal Module Confocal Microscope from 2010 to 2014 were analyzed. Volume Z-scans of the central cornea and the superior, nasal, inferior, and temporal limbus were included in the analysis. Eleven normal eyes served as control. Epithelial thickness in all locations was measured by 2 independent observers.
Results
The mean epithelial layer thickness was 48.6 ± 2.3 μm in the central cornea and 63.7 ± 11.3 μm in the limbus in the control. Compared with the epithelial thickness in normal control, the epithelial thickness in LSCD patients was reduced by an average of 20.2% in the central cornea and 38.5% in the limbus (all P < .05). The mean corneal epithelial thickness in patients with LSCD reduced 7.6%, 20.8%, and 61.3% in the early, intermediate, and late stage, respectively, compared to the control. In the limbus, the overall epithelial thickness decreased 30.0%, 39.7%, and 62.8% in the early, intermediate, and late stage of LSCD, respectively (all P < .05). Epithelial thinning correlated with the severity of LSCD in both cornea and limbus. In eyes with sectoral LSCD, a similar degree of epithelial thinning was also detected in the clinically unaffected limbal regions.
Conclusions
Both corneal and limbal epithelia become progressively thinner in LSCD. Epithelial thickness could be used as a diagnostic measure of LSCD.
Limbal stem cell deficiency (LSCD) occurs with destruction of limbal stem cells (LSCs) through either injury or congenital abnormality. LSCs are proposed to reside in the palisades of Vogt and in the deepest limbal epithelial cell layer. The basal cells of the limbus may consist of LSCs, trans-amplifying cells, and niche cells. Common causes of LSCD include chemical injuries, severe dry eyes, contact lens wear, Stevens-Johnson syndrome, multiple surgeries, and severe infectious keratitis. The hallmark of LSCD is invasion of conjunctival epithelium onto the cornea. Common symptoms and clinical findings include pain, superficial neovascularization, and recurrent or persistent epithelial defects.
The diagnosis of LSCD is largely based on careful clinical examination using fluorescein to detect the abnormal conjunctival epithelium on the cornea. Stippling staining in a vortex pattern along with epithelial thinning, irregularity, and opacity are often present. Detection of goblet cells on the cornea by impression cytology confirms the diagnosis. Goblet cells are normally found in conjunctival epithelium, and their presence on the cornea indicates invasion of the conjunctival epithelium onto the corneal surface. However, goblet cell deficiency can be concurrent with LSCD and may lead to a false-negative result. In addition, in the early stage of LSCD, goblet cells might not be present in the cornea. Use of conjunctival biomarkers is a recent development and still needs to be confirmed in larger clinical studies. Pannus or corneal neovascularization is seen in LSCD, but their presence does not necessarily indicate LSCD. In addition, the degree of LSCD cannot be reliably evaluated by impression cytology because of sampling error. To date, no classification system for LSCD has been established, partly because of the lack of a specific diagnostic marker of LSCD and the lack of a quantitative method to measure corneal epithelial cells on the corneal surface.
Accurate diagnosis of LSCD is important, as a corneal transplant will not survive in LSCD. Replenishment of the LSCs is the only appropriate treatment. In vivo scanning laser confocal microscopy has been used previously to analyze the corneal epithelium and associated structures in normal subjects and patients with LSCD. Central corneal basal cell density and subbasal nerve density are criteria that have been investigated as new indices to help in the diagnosis and, potentially, to quantify the degree of LSCD. In the current study, we investigated whether corneal and limbal epithelium thickness also correlates with the severity of LSCD.
Methods
This cross-sectional study was approved by the Institutional Review Board at the University of California, Los Angeles. A total of 48 eyes from 35 patients were included in this study. All eyes were examined by in vivo scanning laser confocal microscopy. Each patient underwent a comprehensive eye examination and slit-lamp microscopy before impression cytology and in vivo scanning laser confocal microscopy, and 26 eyes underwent impression cytology.
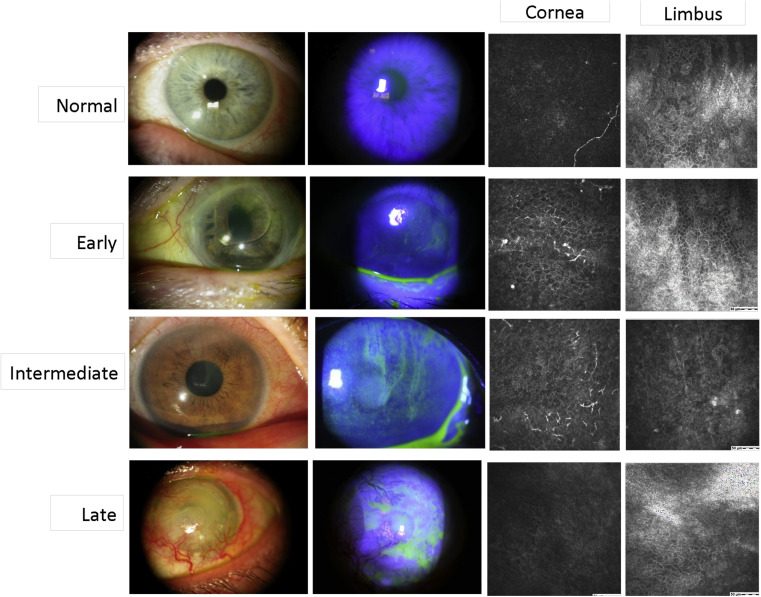
Based on the results of the slit-lamp examination and fluorescein staining, LSCD in the 48 eyes was characterized as early, intermediate, or late stage according to the criteria previously reported. Briefly, the early stage was characterized by stippling or late fluorescein staining, the intermediate stage was characterized by persistent late fluorescein staining in a vortex pattern, and the late stage was characterized by the same vortex staining and a history of cornea epithelial defect or persistent epithelial defect. Representative slit-lamp photographs are shown in Figure 1 . Affected limbal and corneal areas were identified by the location of fluorescein staining by slit-lamp examination. Affected areas were then stratified into superior, nasal, inferior, and temporal limbal sections. Unaffected areas were determined as the limbal sections outside of the affected sections. Each patient’s chart was also reviewed to determine any underlying etiology and predisposing factors that led to LSCD. A total of 10 eyes with normal presentation on slit-lamp examination and no previous history of ocular disease were selected as the control group.
Confocal Microscopy Analysis
Z-scan images were taken by the Heidelberg Retina Tomograph III Rostock Corneal Module Confocal Microscope (Heidelberg Engineering GmBH, Dossenheim, Germany). A minimum of 3 volume scans of the central cornea, and the superior, nasal, inferior and temporal limbus were collected. The volume scans with minimal motion artifacts were selected for analysis. Representative confocal images of each stage are shown in Figure 1 . Epithelial thickness was obtained by manually counting the focus positions of the initial image of the superficial epithelium to the final image of the basal cell layer. Each focal plane advanced 2 μm in depth.
Statistical Analysis
Statistical analyses were performed with SAS software (SAS Institute, Cary, North Carolina, USA). Intraclass correlation coefficients were used to assess the reliability of thickness measurements obtained by 2 independent observers. Kruskal-Wallis tests were used to compare the difference in thickness measurements among control group and different stages of LSCD. Any P value less than .05 indicated statistical significance.
Results
Patient Demographics
A total of 48 eyes of 35 patients with LSCD were studied, with 13 patients having bilateral involvement at the time of presentation. Representative slit-lamp photographs and confocal images of the cornea and limbal epithelium are shown in Figure 1 . The Table summarizes patients’ demographic features. The mean age of the study population was 60 years (range, 24–94 years). The mean age of the control group was 46.3 years (range, 27–88 years). There was no significant difference in age ( P = .11) or sex ( P = .51) between the control and LSCD groups. Diagnosis of LSCD was confirmed in 12 eyes by impression cytology. The leading etiology was contact lens wear (31.3%), followed by multiple surgeries (29.2%). In 42 eyes with sectoral LSCD, the superior limbus was the most commonly affected region in 23 eyes (54.8%), followed by the inferior limbus (17 of 42 eyes; 40.5%) and the temporal limbus (9 of 42 eyes; 21.4%). Each patient’s age, causative etiology, and stage of LSCD are listed in Supplemental Table 1 (available at AJO.com ).
| N (%) | |
|---|---|
| Sex (n = 35 patients; mean age 60 years) | |
| Male | 16 (45.7) |
| Female | 19 (54.3) |
| LSCD presentation (n = 48 eyes) | |
| Sectoral LSCD | 42 (87.5) |
| Total LSCD | 6 (12.5) |
| LSCD stage (n = 48 eyes) | |
| Early | 18 (37.5) |
| Intermediate | 25 (52.1) |
| Late | 5 (10.4) |
| Etiologies (n = 48 eyes) a | |
| Stevens-Johnson syndrome | 4 (8.3) |
| Multiple surgeries | 14 (29.2) |
| Contact lens | 15 (31.3) |
| Dry eye syndrome | 9 (18.75) |
| Chemical injury | 3 (6.3) |
| Drug toxicity | 6 (12.5) |
| Chronic keratoconjunctivitis | 5 (10.4) |
| Infectious keratitis | 3 (6.3) |
Epithelium thickness measurements were performed by 2 independent observers in a masked fashion. The intraclass correlation coefficient between the 2 observers (0.977; Supplemental Figure , available at AJO.com ) indicated a high consistency of the measurements. The mean epithelial thickness in all 5 regions of the ocular surface in the normal control group and in the LSCD groups are summarized in Supplemental Table 2 (available at AJO.com ). In the control group, the mean epithelium thickness (± SD) was 48.6 ± 2.3 μm in the central cornea and 63.7 ± 11.3 μm in the limbus. Epithelium thickness varied in different limbal regions: the mean epithelium thickness was thickest in the inferior limbus (68.3 ± 17.5 μm) and was thinner in the temporal limbus (62.7 ± 10.0 μm), nasal limbus (60.3 ± 12.1 μm), and superior limbus (59.4 ± 9.6 μm).
There was a significant decrease in the overall mean epithelium thickness in the cornea (38.8 ± 14.8 μm, 20.2%, P = .016) and limbus (39.2 ± 14.4 μm, 38.5%, P < .001) in the LSCD group compared to that in the normal control group. Because contact lens wear was the leading etiology of LSCD, to determine whether the decrease in epithelium thickness was unique to this group of patients, epithelium thickness was analyzed in the contact lens and the non–contact lens subjects. There was more cornea epithelial thinning in the non–contact lens subjects (35.8 ± 15.3 μm) than in the contact lens group (45.5 ± 11.5 μm, P = .01). There was no difference in the limbal epithelial thickness between contact lens (40.6 ± 12.8 μm) and non–contact lens subjects (38.5 ± 15.2 μm, P = .9). Therefore, epithelial thinning was detected in all LSCD subjects regardless of the etiology.
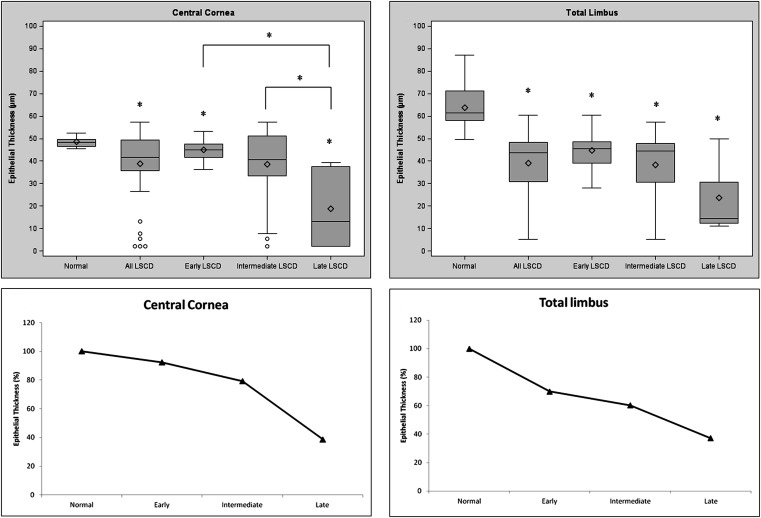
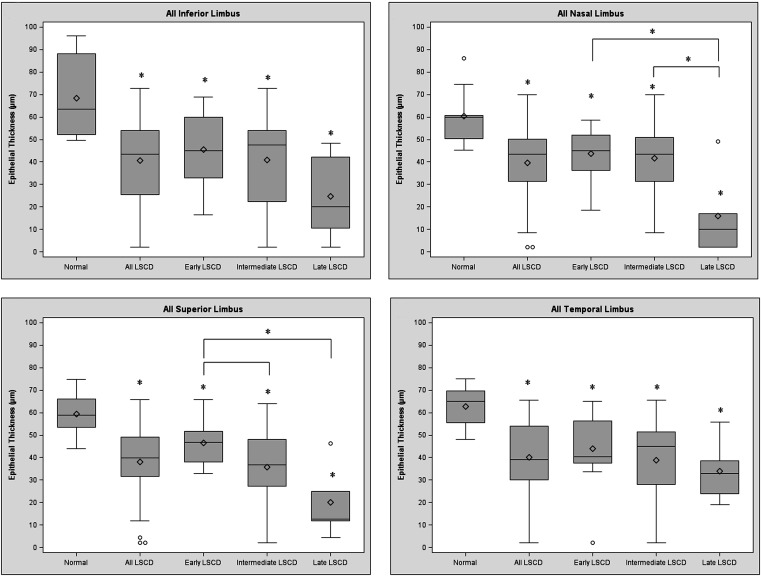
The mean epithelium thickness of the central cornea and all limbal regions became progressively thinner in the more advanced stages of LSCD ( Figure 2 , Top). The mean corneal epithelium thickness in patients with LSCD reduced 7.6%, 20.8%, and 61.3% in the early, intermediate, and late stage, respectively, compared to the control ( Figure 2 , Bottom left). In the limbus, the overall mean epithelium thickness decreased 30.0%, 39.7%, and 62.8% in the early, intermediate, and late stage of LSCD, respectively, compared to the control (all P < .05; Figure 2 , Bottom right). Linear regression models analysis also demonstrated the increased thinning of epithelium thickness in more severe LSCD. Because of the variation of epithelium thickness in different regions of the limbus, epithelium thickness in each limbal region was further analyzed. A similar trend of epithelial thinning was observed in all 4 limbal regions of patients with LSCD compared with those of corresponding regions in the normal control group ( Figure 3 ).
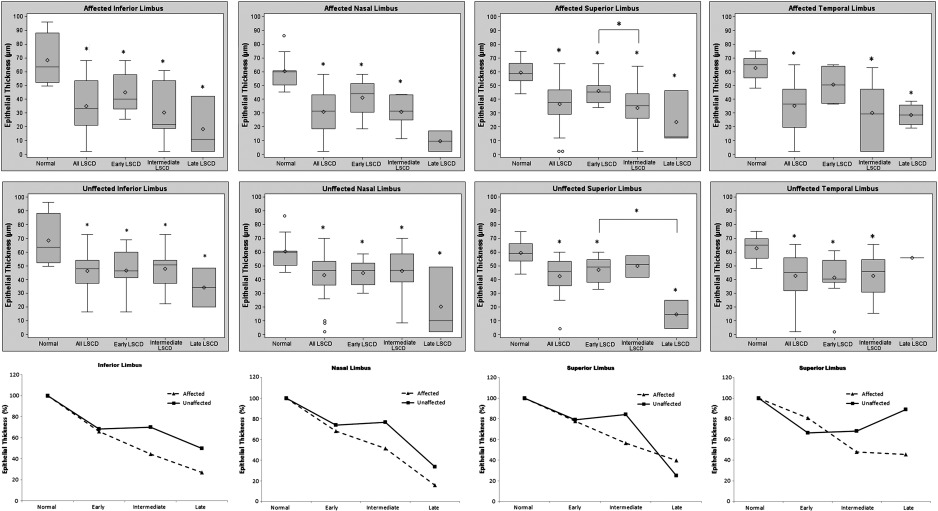
Most eyes in our study (87.5%) had clinical signs of sectoral LSCD at the time of presentation; that is, only a region(s) of the limbus was affected and other limbal regions appeared clinically unaffected. Therefore, we next compared the differences in the epithelium thickness of the affected and unaffected limbal regions in patients with LSCD with corresponding limbal regions of the normal subjects. As expected, the affected limbal region had significantly thinner epithelium thickness in all stages of LSCD than the corresponding region in normal subjects ( Figure 4 , Top, and Supplemental Table 3 , available at AJO.com ). Interestingly, the epithelium thickness in the unaffected limbal regions also was significantly thinner than that of the control in all 3 stages of LSCD ( Figure 4 , Middle). There was no significant difference in epithelium thickness between the affected and unaffected limbal regions ( Figure 4 , Bottom, all P > .05).
Receiver operating characteristic curve analysis of the corneal and limbal epithelium thickness in the control and in patients with LSCD revealed that the cutoff value for the corneal epithelium thickness was 45.5 μm and the resulting sensitivity and specificity was 67% and100%, respectively. The lower cutoff value for limbal epithelium thickness was <51 μm and the resulting sensitivity and specificity was 81% and 90%, respectively. On the basis of these results, a decrease in the corneal epithelium thickness of more than 6.2% and in the limbal epithelium thickness of more than 20% might signify limbal stem cell dysfunction.
Results
Patient Demographics
A total of 48 eyes of 35 patients with LSCD were studied, with 13 patients having bilateral involvement at the time of presentation. Representative slit-lamp photographs and confocal images of the cornea and limbal epithelium are shown in Figure 1 . The Table summarizes patients’ demographic features. The mean age of the study population was 60 years (range, 24–94 years). The mean age of the control group was 46.3 years (range, 27–88 years). There was no significant difference in age ( P = .11) or sex ( P = .51) between the control and LSCD groups. Diagnosis of LSCD was confirmed in 12 eyes by impression cytology. The leading etiology was contact lens wear (31.3%), followed by multiple surgeries (29.2%). In 42 eyes with sectoral LSCD, the superior limbus was the most commonly affected region in 23 eyes (54.8%), followed by the inferior limbus (17 of 42 eyes; 40.5%) and the temporal limbus (9 of 42 eyes; 21.4%). Each patient’s age, causative etiology, and stage of LSCD are listed in Supplemental Table 1 (available at AJO.com ).
| N (%) | |
|---|---|
| Sex (n = 35 patients; mean age 60 years) | |
| Male | 16 (45.7) |
| Female | 19 (54.3) |
| LSCD presentation (n = 48 eyes) | |
| Sectoral LSCD | 42 (87.5) |
| Total LSCD | 6 (12.5) |
| LSCD stage (n = 48 eyes) | |
| Early | 18 (37.5) |
| Intermediate | 25 (52.1) |
| Late | 5 (10.4) |
| Etiologies (n = 48 eyes) a | |
| Stevens-Johnson syndrome | 4 (8.3) |
| Multiple surgeries | 14 (29.2) |
| Contact lens | 15 (31.3) |
| Dry eye syndrome | 9 (18.75) |
| Chemical injury | 3 (6.3) |
| Drug toxicity | 6 (12.5) |
| Chronic keratoconjunctivitis | 5 (10.4) |
| Infectious keratitis | 3 (6.3) |
Epithelium thickness measurements were performed by 2 independent observers in a masked fashion. The intraclass correlation coefficient between the 2 observers (0.977; Supplemental Figure , available at AJO.com ) indicated a high consistency of the measurements. The mean epithelial thickness in all 5 regions of the ocular surface in the normal control group and in the LSCD groups are summarized in Supplemental Table 2 (available at AJO.com ). In the control group, the mean epithelium thickness (± SD) was 48.6 ± 2.3 μm in the central cornea and 63.7 ± 11.3 μm in the limbus. Epithelium thickness varied in different limbal regions: the mean epithelium thickness was thickest in the inferior limbus (68.3 ± 17.5 μm) and was thinner in the temporal limbus (62.7 ± 10.0 μm), nasal limbus (60.3 ± 12.1 μm), and superior limbus (59.4 ± 9.6 μm).
There was a significant decrease in the overall mean epithelium thickness in the cornea (38.8 ± 14.8 μm, 20.2%, P = .016) and limbus (39.2 ± 14.4 μm, 38.5%, P < .001) in the LSCD group compared to that in the normal control group. Because contact lens wear was the leading etiology of LSCD, to determine whether the decrease in epithelium thickness was unique to this group of patients, epithelium thickness was analyzed in the contact lens and the non–contact lens subjects. There was more cornea epithelial thinning in the non–contact lens subjects (35.8 ± 15.3 μm) than in the contact lens group (45.5 ± 11.5 μm, P = .01). There was no difference in the limbal epithelial thickness between contact lens (40.6 ± 12.8 μm) and non–contact lens subjects (38.5 ± 15.2 μm, P = .9). Therefore, epithelial thinning was detected in all LSCD subjects regardless of the etiology.
The mean epithelium thickness of the central cornea and all limbal regions became progressively thinner in the more advanced stages of LSCD ( Figure 2 , Top). The mean corneal epithelium thickness in patients with LSCD reduced 7.6%, 20.8%, and 61.3% in the early, intermediate, and late stage, respectively, compared to the control ( Figure 2 , Bottom left). In the limbus, the overall mean epithelium thickness decreased 30.0%, 39.7%, and 62.8% in the early, intermediate, and late stage of LSCD, respectively, compared to the control (all P < .05; Figure 2 , Bottom right). Linear regression models analysis also demonstrated the increased thinning of epithelium thickness in more severe LSCD. Because of the variation of epithelium thickness in different regions of the limbus, epithelium thickness in each limbal region was further analyzed. A similar trend of epithelial thinning was observed in all 4 limbal regions of patients with LSCD compared with those of corresponding regions in the normal control group ( Figure 3 ).


