Purpose
To determine the intravisit and interobserver reproducibility of subfoveal choroidal thickness (SFCT) measurements in patients with noninfectious uveitis.
Design
Reliability analysis.
Methods
Two consecutive enhanced depth imaging optical coherence tomography (EDI-OCT) scans were obtained at a single clinic visit for 97 uveitic eyes from patients ≥16 years of age with noninfectious anterior (n = 10), intermediate (n = 11), posterior (n = 26), and panuveitis (n = 13) at the National Eye Institute. SFCT was manually measured by 2 ophthalmologists using manufacturer’s software. Intravisit and interobserver reproducibility of SFCT measurements were assessed by using the Bland-Altman method to determine the estimate of bias (mean difference in SFCT measurements), 95% limits of agreement, and coefficients of repeatability. The reproducibility of these measurements was also compared between groups by anatomic location and clinical activity.
Results
Of 97 eyes, 65 (67.0%) were clinically quiet, 18 (18.6%) were minimally active, and 14 (14.4%) were active at the time the scans were obtained. Manual SFCT measurements were reproducible within 32.4 ± 3.8 μm between sessions for the same observer and 51.4 ± 8.5 μm between observers for the same session. Coefficients of repeatability did not differ significantly by anatomic location or disease activity.
Conclusions
Manual SFCT measurements obtained by EDI-OCT are reproducible in uveitis patients, with coefficients of repeatability that are nearly comparable to those published for normal eyes. This study provides guidance for using manual SFCT measurements in clinical practice, but further studies are still needed to determine their utility in clinical trials.
Uveitis constitutes a group of inflammatory eye diseases that can cause permanent damage to intraocular structures and lead to significant visual impairment. In order to better visualize and monitor posterior segment disease, various imaging modalities have been developed, including spectral-domain optical coherence tomography (SD-OCT). This noninvasive imaging technique simultaneously measures multiple wavelengths of reflected light and acquires up to 40 000 axial scans (A-scans) per second, allowing for enhanced resolution and reduced motion artifact. However, the focus of the resultant images is generally limited to the level of the retina, or the zero-delay point. Adequate visualization posterior to the retina is constrained by the presence of pigmented cells, the scattering of light along the image path, and decreasing sensitivity with increasing distance from the zero-delay point. Thus, standard SD-OCT is not well suited for visualizing pathology involving deeper structures, such as the choroid.
Spaide and associates have described a different technique called enhanced depth imaging OCT (EDI-OCT). In this method, the instrument’s objective is placed close to the eye, obtaining an inverted image while localizing the zero-delay point closer to the choroid. EDI-OCT thereby enhances visualization of choroidal vascular structures and better defines the sclerochoroidal border, allowing for measurements of choroidal thickness. Several studies have examined the repeatability of manual subfoveal choroidal thickness (SFCT) measurements in healthy eyes using the Bland-Altman method. Collectively, these studies have shown that SFCT measurements are reproducible between observers, with an interobserver variability of approximately 30 μm.
Clinically significant changes in choroidal thickness have been reported in Vogt-Koyanagi-Harada (VKH) syndrome, Behçet disease, sarcoidosis, birdshot chorioretinopathy, idiopathic panuveitis, sympathetic ophthalmia, and posterior scleritis. Although prior studies have assessed the reproducibility of manual choroidal thickness measurements in normal eyes, no such studies have been conducted in uveitic eyes. Yet, dramatic changes in retinal architecture and significant increases in choroidal thickness can adversely affect the reliability of these measurements in uveitic eyes. Thus, it is important to validate the use of EDI-OCT in uveitis patients, especially in the context of a multi-provider practice and for its potential utilization in clinical trials. The aims of this study are to determine the intravisit and interobserver reproducibility of manual SFCT measurements and to compare the reproducibility of these measurements between groups by anatomic location and disease activity in patients with noninfectious uveitis.
Methods
A reliability analysis was conducted using 97 uveitic eyes of 60 participants with noninfectious anterior (n = 10), intermediate (n = 11), posterior (n = 26), and panuveitis (n = 13), who were seen at the National Eye Institute (NEI) from June 2012 to March 2015. This reproducibility study was conducted under a clinical research protocol registered in the National Clinical Trials database ( http://www.clinicaltrials.gov ; NCT00708955 ), which was prospectively approved by the National Institutes of Health (NIH) Institutional Review Board, was in compliance with the Health Insurance Portability and Accountability Act, and was in adherence to the tenets of the Declaration of Helsinski. All participants provided informed consent. At the time of participation, no uveitic eyes included in the study had evidence of end-stage disease with extensive chorioretinal atrophy on examination. Axial lengths were also obtained to ensure that SFCT measurements in this study would not be affected by extreme myopia or hyperopia.
Scan Acquisition and Analysis
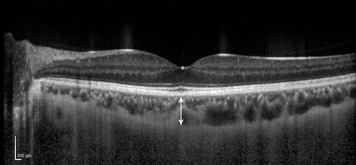
Two separate but consecutive EDI-OCT sessions were conducted on the Heidelberg Spectralis ophthalmic imaging system (Heidelberg Engineering, Heidelberg, Germany) by experienced ophthalmic photographers at a single clinic visit for all patients, except for 7 patients who were scanned only once and therefore only had measurements to compare between observers. Each EDI-OCT session consisted of a 30 × 5-degree volume scan composed of 13 sections, each comprising 25 averaged B-scans centered on the fovea, obtained using the device’s automatic averaging and eye tracking features. The second EDI-OCT session was performed in reference to the first EDI-OCT session using the device’s AutoRescan feature. The horizontal section running directly through the center of the fovea was selected for manual measurements. Two ophthalmologists experienced with reading EDI-OCT images used the manufacturer’s proprietary software to place calipers directly beneath the fovea to measure SFCT. SFCT was defined as the vertical distance from just outside the hyperreflective line corresponding to the outer border of the retinal pigment epithelium to the hyporeflective line corresponding to the inner scleral border ( Figure 1 ). Each observer was masked to the other observer’s readings. Only gradable images were included in the analysis; those with an indistinguishable scleral border (n = 4) or extremely poor image quality (n = 18) were excluded.
To assess intraobserver reproducibility, 1 observer remeasured SFCT using the first EDI-OCT session for a random sample of 20 right eyes (5 anterior, 5 intermediate, 5 posterior, and 5 panuveitis, all with varying levels of activity) approximately 1 month after all sets of measurements were completed, while remaining masked to the original measurements.
Statistical Analysis
Intraobserver, intravisit, and interobserver reproducibility of manual SFCT measurements was assessed by the Bland-Altman method. Scatterplots were generated using MedCalc for Windows, version 15.4 (MedCalc Software, Ostend, Belgium), where the difference in SFCT measurements was plotted against the mean value. Intraobserver reproducibility was defined as the reproducibility of SFCT measurements made by a single observer for 1 EDI-OCT session at 2 different time points. Intravisit reproducibility was defined as the reproducibility of SFCT measurements made by a single observer for same-day EDI-OCT sessions. Interobserver reproducibility was defined as the reproducibility of SFCT measurements made by observers 1 and 2 for the same EDI-OCT session. The average agreement, or bias, was estimated for each comparison by calculating the mean difference in SFCT measurements. This was reported with 95% confidence intervals (CIs), which were computed as ±1.96 times the standard error (SE) of the differences. The coefficient of repeatability (CR) was also calculated for each comparison by multiplying the standard deviation (SD) of the differences by 1.96. The upper and lower 95% limits of agreement for each Bland-Altman plot were computed by adding or subtracting the CR value to or from the mean difference in SFCT, respectively. Specifically, the difference in SFCT measurements between sessions or observers was expected to be less than the respective CR for 95% of the corresponding observation pairs. The 95% CIs of the upper and lower limits of agreement, a measurement of the precision of the limits of agreement themselves, were computed as ±1.96 times the SE of the respective limit, which was approximated as √[(3s 2 )/n], where s was the SD of the differences in SFCT and n the sample size.
Mean SFCT was compared between groups by anatomic location and clinical activity using 1-way analysis of variance on SPSS 20 (IBM Corp, Armonk, New York, USA), where a 2-tailed P value of less than .05 was considered statistically significant. Anatomic location of uveitis and activity were determined according to Standardization of Uveitis Nomenclature criteria. For the purposes of this study, eyes were categorized as active if the anterior chamber (AC) cell score was 1+, if the vitreous haze score was ≥0.5+, or if there was any activity on fluorescein angiography (FA) or other imaging modality warranting escalation of treatment. Eyes were considered minimally active if the AC cell score was 0.5+ in the absence of vitreous haze or if there was minimal activity on FA or other imaging modality that did not require changes in treatment. Otherwise, eyes were considered clinically quiet. The reproducibility of these measurements was also assessed by anatomic location and disease activity using the Bland-Altman method, as described above.
Results
A total of 97 uveitic eyes from 60 participants, with a mean age of 43.6 years (range, 16–72 years), was included in the study. Thirty-eight participants were female. Twenty-six participants were non-Hispanic white, 16 were non-Hispanic black, 13 were Hispanic/Latino, and 5 were Asian. Ten participants had noninfectious anterior uveitis, 11 had noninfectious intermediate uveitis, 26 had noninfectious posterior uveitis, and 13 had noninfectious panuveitis. Fifty-one participants (76.7%) had bilateral disease, but some of these patients had eyes that were excluded from our analysis owing to extremely poor image quality, an indistinguishable scleral border, or end-stage disease, including phthisis. At the time that EDI-OCT scans were obtained, 27 participants were on systemic corticosteroid therapy, 31 were on steroid-sparing immunosuppressive therapy, and 10 were on biologic therapy. Of 49 right uveitic eyes, 34 (69.4%) were clinically quiet, 9 (18.4%) were minimally active, and 6 (12.2%) were active. Of 48 left uveitic eyes, 31 (64.6%) were clinically quiet, 9 (18.8%) were minimally active, and 8 (16.7%) were active. Mean axial length was 24.16 ± 1.54 mm and 24.17 ± 1.51 mm for the right and left eyes, respectively. Mean SFCT was 278 ± 81 μm and 287 ± 118 μm for the right and left eyes, respectively.
Mean differences in intraobserver, intravisit, and interobserver SFCT measurements were close to zero, with the exception of 2 sets of interobserver measurements ( Table 1 ). The estimates of bias between observers for the first and second EDI-OCT sessions for the right eye were statistically significant at −8.92 μm ( P = .007) and −10.3 μm ( P = .011), respectively. All others were nonsignificant.
| Type of Comparison | N | Mean (SD) Difference (μm) | P Value |
|---|---|---|---|
| Intraobserver a | |||
| OBS 2, SESS 1, OD – OBS 2, SESS 1′, OD | 20 | −1.5 (19.0) | .728 |
| Intravisit | |||
| OBS 1, SESS 1, OD – OBS 1, SESS 2, OD | 42 | +1.0 (15.2) | .673 |
| OBS 1, SESS 1, OS – OBS 1, SESS 2, OS | 41 | +2.7 (16.0) | .293 |
| OBS 2, SESS 1, OD – OBS 2, SESS 2, OD | 42 | −0.7 (15.6) | .768 |
| OBS 2, SESS 1, OS – OBS 2, SESS 2, OS | 41 | −1.3 (19.4) | .672 |
| Interobserver | |||
| OBS 1, SESS 1, OD – OBS 2, SESS 1, OD | 49 | −8.9 (22.0) | .007 |
| OBS 1, SESS 1, OS – OBS 2, SESS 1, OS | 48 | −4.0 (32.3) | .390 |
| OBS 1, SESS 2, OD – OBS 2, SESS 2, OD | 42 | −10.3 (25.2) | .011 |
| OBS 1, SESS 2, OS – OBS 2, SESS 2, OS | 41 | −6.1 (25.5) | .135 |
a Intraobserver measurements were performed on a random selection of 20 eyes (40 measurements), whereas interobserver measurements were made using almost 50 eyes (nearly 100 measurements in total).
Because the 95% limits of agreement depend on certain assumptions of the data, scatterplots of the difference against the average of SFCT measurements were generated ( Figure 2 ). In all plots, the mean and SD of SFCT measurements appeared relatively constant throughout the range of measurements. The 95% limits of agreement along with their 95% CIs are summarized in Table 2 . Overall, intravisit CR was 32.4 ± 3.8 μm, and interobserver CR was 51.4 ± 8.5 μm. Intraobserver CR for 1 observer using a random sample of 20 right eyes was 37.3 μm.
| Type of Comparison | N | Estimate of Bias (μm) | 95% CI (μm) | Lower Limit of Agreement (μm) | 95% CI (μm) | Upper Limit of Agreement (μm) | 95% CI (μm) | Coefficient of Repeatability (μm) |
|---|---|---|---|---|---|---|---|---|
| Intraobserver a | ||||||||
| OBS 2, SESS 1, OD – OBS 2, SESS 1′, OD | 20 | −1.5 | −10.4 to 7.4 | −38.8 | −54.2 to −23.3 | +35.8 | +20.3 to +51.2 | 37.3 |
| Intravisit | ||||||||
| OBS 1, SESS 1, OD – OBS 1, SESS 2, OD | 42 | +1.0 | −3.8 to +5.8 | −28.8 | −37.0 to −20.7 | +30.8 | +22.7 to +39.0 | 29.8 |
| OBS 1, SESS 1, OS – OBS 1, SESS 2, OS | 41 | +2.7 | −2.4 to +7.7 | −28.7 | −37.3 to −20.0 | +34.0 | +25.3 to +42.7 | 31.3 |
| OBS 2, SESS 1, OD – OBS 2, SESS 2, OD | 42 | −0.7 | −5.6 to +4.1 | −31.2 | −39.6 to −22.9 | +29.8 | +21.4 to +38.2 | 30.5 |
| OBS 2, SESS 1, OS – OBS 2, SESS 2, OS | 41 | −1.3 | −7.4 to +4.8 | −39.4 | −49.9 to −28.8 | +36.8 | +26.2 to +47.3 | 38.1 |
| Interobserver | ||||||||
| OBS 1, SESS 1, OD – OBS 2, SESS 1, OD | 49 | −8.9 | −15.2 to −2.6 | −52.0 | −62.9 to −41.1 | +34.2 | +23.3 to +45.0 | 43.1 |
| OBS 1, SESS 1, OS – OBS 2, SESS 1, OS | 48 | −4.0 | −13.4 to +5.3 | −67.4 | −83.5 to −51.2 | +59.3 | +43.1 to +75.4 | 63.3 |
| OBS 1, SESS 2, OD – OBS 2, SESS 2, OD | 42 | −10.3 | −18.1 to −2.5 | −59.6 | −73.1 to −46.1 | +39.0 | +25.5 to +52.5 | 49.3 |
| OBS 1, SESS 2, OS – OBS 2, SESS 2, OS | 41 | −6.1 | −14.1 to +2.0 | −56.0 | −69.9 to −42.2 | +43.9 | +30.0 to +57.8 | 50.0 |
Stay updated, free articles. Join our Telegram channel

Full access? Get Clinical Tree


