Purpose
To evaluate the cost effectiveness of deep anterior lamellar keratoplasty (DALK) versus penetrating keratoplasty (PK) in The Netherlands.
Design
Cost-effectiveness analysis alongside a randomized, multicenter clinical trial.
Methods
Fifty-three patients with corneal stromal pathologic features not affecting the endothelium were included with 28 patients in the DALK group and 25 in the PK group. Quality of life was measured before surgery and 3, 6, and 12 months after surgery. The main outcome measures were incremental cost-effectiveness ratios per clinically improved patient on the 25-item National Eye Institute Visual Functioning Questionnaire and per patient with endothelial cell loss of maximally 20% within the first year.
Results
Mean total bootstrapped costs per patient were €7607 (US$10 498) in the DALK group and €6552 (US$9042) in the PK group. The incremental cost-effectiveness ratios were €9977 (US$13 768) per clinically improved patient on the 25-item National Eye Institute Visual Functioning Questionnaire and €6900 (US$9522) per patient with cell loss of maximally 20%. In patients without perforation of the Descemet membrane, the incremental cost-effectiveness ratio was €5250 (US$7245) per patient.
Conclusions
This study shows that DALK is more costly and more effective as compared with PK. Results on the 25-item National Eye Institute Visual Functioning Questionnaire were in favor of DALK, and endothelial cell loss in DALK patients remained stable after 6 months, whereas cell loss in PK patients continued. Furthermore, DALK procedures performed without perforation of the Descemet membrane were more effective. However, because it is unknown what society is willing to pay for an additional improved patient, cost effectiveness of DALK within a limited follow-up period of 12 months is unclear. Cost effectiveness of DALK may improve over time because of lower graft failure.
For many years, penetrating keratoplasty (PK) has been the standard treatment for diseases of corneal stroma with unaffected endothelium such as keratoconus, infectious keratitis, and stromal dystrophies. Although it has been proven to be a safe and effective technique that achieves good visual outcomes, graft failure is reported in 18% to 34% of the patients. Graft failure is caused mainly by endothelial rejection and endothelial failure, which account for more than 50% of graft failures. After PK, endothelial cell counts have been shown to drop by approximately 70% at 5 to 10 years, having a major impact on long-term graft survival.
In the last decade, interest has grown in lamellar transplantation techniques in which only the anterior side of the cornea is transplanted. The main clinical aim to develop lamellar techniques was to preserve the endothelial layer, assuming that this will reduce the risk of endothelial rejection and will prevent endothelial cell loss of the corneal graft. Postoperative visual function should be comparable with PK to justify lamellar techniques.
In deep anterior lamellar keratoplasty (DALK), the corneal stroma tissue is removed down to the Descemet membrane or a thin layer of stroma is left on top of the Descemet membrane. The corneal stroma is replaced by donor tissue. The healthy Descemet membrane and endothelium of the recipient is not grafted, which reduces the risk of graft failure. Furthermore, long-term endothelial cell loss is lower after DALK as compared with PK. However, the procedure is technically challenging and may result in perforation of the Descemet membrane in a significant number of cases (range, 4% to 39%).
Although several studies evaluated the efficacy and visual outcomes of DALK versus PK, the efficiency of the techniques has not yet been established. An economic evaluation is a method to compare outcomes and costs of interventions with the aim to improve resource allocation decisions by policy makers and insurers. One type of economic evaluation is the cost-effectiveness analysis, in which the costs of an intervention are related to a single outcome measure, for example clinical success. In this study, a cost-effectiveness analysis was performed, comparing DALK with PK.
Methods
Study Population
The trial-based economic evaluation was conducted alongside the Dutch Lamellar Corneal Transplantation Study, a randomized multicenter clinical trial that evaluated the efficacy and safety of DALK versus PK. Patients were included between July 2005 and February 2008 at 5 clinical centers in The Netherlands. Informed consent was obtained from all patients.
Inclusion criteria were patients with keratoconus intolerant of contact lens wear (without prior hydrops or Descemet rupture) and stromal opacifications not reaching the Descemet membrane and without concomitant endothelial disease. Exclusion criteria were best-corrected visual acuity more of 20/50 or worse, keratoconus with previous hydrops or Descemet rupture, or corneal stromal opacification reaching the Descemet membrane.
In each medical center, consecutive cases were assigned randomly to treatment by DALK or by PK. A permuted block size of 2 was used to generate the randomization code. All patients underwent a comprehensive ophthalmic examination and completed a vision-related quality-of-life questionnaire. Data were obtained at randomization and at 3, 6, and 12 months after the transplantation, which is 4.5, 7.5, and 13.5 months after baseline measurement, respectively.
In the Dutch Lamellar Corneal Transplantation Study, the sample size was calculated based on an endothelial cell loss of 8% after DALK and 45% after PK in 1 year, based on our preliminary experiences and reported amounts of endothelial cell loss in previous studies. Assuming an α of 0.05, a power of 90%, and 10% loss to follow-up, 28 patients were needed in each treatment group.
Surgical Procedures
In the DALK group, the surgical procedure was performed using the big-bubble technique described previously. Partial thickness trephination of approximately 60% depth was performed, followed by a partial-thickness anterior keratectomy. An air bubble was inserted into the remaining stroma using a 30-gauge needle. An incision was made in the anterior wall of the bubble and a blunt spatula was used to form 4 sections in the anterior stromal layers that then were excised with blunt-tipped microscissors. A donor button subsequently was sutured into the bed using 8 interrupted 10-0 nylon sutures and a continuous 11-0 nylon suture.
In the PK group, the recipient cornea was trephined using a 7.75- or 8.0-mm Hessburg-Barron vacuum trephine ( Jed Med , St Louis, Missouri), and the donor cornea was trephined with an 8.0- or 8.25-mm Hessburg-Barron trephine. In all patients, a combined suturing technique of 8 interrupted 10-0 nylon sutures with a continuous 11-0 nylon suture was used. Selective suture removal was based on the topographic astigmatism pattern.
Economic Evaluation
The economic evaluation was performed from a health care perspective with a time horizon of 13.5 months, from randomization (approximately 1.5 months before surgery) up to 12 months after surgery. All relevant resources consumed within the health care sector were taken into account.
Effectiveness was expressed in 2 ways. First, the 25-item National Eye Institute Visual Functioning Questionnaire (NEI VFQ-25) was used, which is specified for vision-related quality-of-life. Second, because preservation of the host endothelium is the main advantage of DALK, the amount of endothelial cell loss was used as an outcome measure. Incremental cost-effectiveness ratios (ICERs) were calculated by dividing the difference in costs (DALK minus PK) by the difference in effectiveness (DALK minus PK) between the 2 treatments.
Twenty-five–item National Eye Institute Visual Functioning Questionnaire
The NEI VFQ-25 measures generic health dimensions and task-oriented domains related to daily visual functioning that are most important for patients with a chronic eye disease. The NEI VFQ-25 consists of 25 questions that can be expanded with 13 additional items. The questions comprise 12 subscales, of which 11 eventually can be converted into a single score. The remaining subscale (general health) is included in the questionnaire to provide robust information about an individual’s general health status. After recoding, all scores range from 0 (worst possible value) to 100 (best possible value).
Several studies have suggested that a 10-point change in the composite score is clinically important. Therefore, a patient with a minimum gain of 10 points in the composite score at 12 months after surgery was considered to be clinically improved. An ICER was calculated that expressed the incremental costs per clinically improved patient.
Endothelial cell loss
Endothelial cell densities were measured at randomization and at 3, 6, and 12 months after surgery using the specular microscopy Noncon Robo SP 8000 (Konan, Hyogo, Japan). To reduce the sampling error, 3 specular photographs were obtained at each measurement and each image was analyzed by selecting 50 cells in the center of the image. Studies show an endothelial cell loss in the first year ranging from 6% to 20% after DALK surgery and from 20% to 43% after PK surgery. In this study, an ICER was calculated that expressed the incremental costs per patient with an endothelial cell loss of maximally 20% within the first year after surgery.
Cost Analysis
All direct medical costs of the 2 interventions were assessed according to the Dutch guidelines for cost calculations. Because direct nonmedical costs and indirect costs were assumed to be equal in both intervention groups, these costs were excluded from analyses. Costs were calculated by multiplying the volumes of resource use by the cost price per resource unit. All costs were converted to 2008 Euros, and costs occurring after 12 months were discounted at an annual rate of 4%. All costs are reported in Euros (€) and United States dollars (US$) (€1 = US$1.38).
Resources included preparation, preservation, allocation, and transportation of the donor corneas, which were provided by the Bio Implant Services Foundation; outpatient visits; diagnostic procedures; surgical procedures; hospitalization; and postoperative drugs use. Data for outpatient visits, surgical and diagnostic procedures, and hospitalization were obtained from the registries of the participating hospitals.
The services of the Bio Implant Services Foundation were valued using Dutch reimbursement rates, because no unit prices were available. Costs of outpatient visits, surgical procedures, hospitalization, and diagnostic procedures were valued using standardized integral unit prices (consisting of personnel, material, capacity, and overhead costs) as calculated by Maastricht University Medical Centre in which 68% of the patients were included. Integral costs prices of surgical procedures depended on the operation time per patient and were allocated to 2 cost drivers, namely general operating room costs and specific ophthalmology costs. Costs of postoperative drugs were obtained from the Dutch Pharmacotherapeutic Compass.
Statistical Analysis
Outcomes were analyzed according to the intention-to-treat principle. Incomplete data of the NEI VFQ-25 (5%), incomplete cost data (3%), and incomplete data considering the endothelial cell density (22%) and visual acuity (0.4%) were imputed using SPSS Multiple Imputation software version 17.0 for Windows (SPSS, Inc, Chicago, Illinois, USA), under the assumption that the data were missing at random. Patients who had not completed the baseline NEI VFQ-25 were not included in the economic evaluation. A linear regression model was used with a total run length of 100 iterations. Covariates included in the imputation model were manifest refraction, refractive astigmatism, and topographic astigmatism, which were obtained in the Dutch Lamellar Corneal Transplantation Study at randomization and at 3, 6, and 12 months after surgery. Furthermore, age, sex, randomization group, and results on additional questions to measure patient satisfaction after a corneal transplantation were included in the model. Five imputed data sets were obtained. All analyses were performed with each of these data sets and the results were pooled.
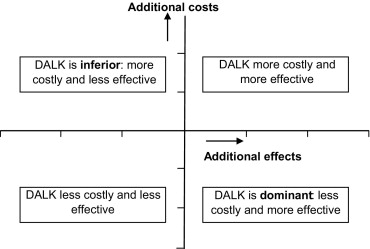
Because cost data generally are highly skewed, traditional parametric and nonparametric statistical methods are not appropriate to analyze the difference in mean costs between groups. Therefore, to estimate the uncertainty in costs and effects, nonparametric bootstrapping with 1000 replications was performed on the incremental costs and effects, using Microsoft Excel for Windows (Microsoft Corp, Redmond, Washington, USA). The bootstrapped incremental cost-effectiveness ratios were plotted in a cost-effectiveness plane in which the horizontal axis represents the difference in effects between the 2 treatment groups and the vertical axis represents the difference in costs between the 2 treatment groups ( Figure 1 ). Cost-effectiveness pairs can be located in 1 of 4 areas: (1) in the southeast area, DALK is dominant over PK (less costly and more effective); (2) in the northwest area, DALK is inferior over PK (more costly and less effective); (3) in the southwest area, DALK is less costly and less effective as compared with PK; (4) in the northeast area, DALK is more costly and more effective as compared with PK. In addition, cost-effectiveness acceptability curves were created, showing the probability that DALK is cost-effective using a range of ceiling ratios, which represents the maximum amount of money that the decision maker is willing to pay for an additional health effect (ie, a clinically improved patient).
Secondary Analyses
To test the robustness of the results, secondary analyses were performed. First, an additional analysis was performed in which we excluded the patients with perforation of the Descemet membrane. Second, we replaced the cost prices as determined in the Maastricht University Medical Centre by standardized Dutch unit prices—if available—determined by Oostenbrink and associates. Third, several studies stated that a 5-point change in the composite score of the NEI VFQ-25 is clinically relevant. Therefore, we considered a patient with a gain of 5 points in the composite score at 12 months after surgery to be clinically improved. Finally, 5 patients who were randomized to DALK required conversion to PK. Therefore, instead of an intention-to-treat analysis, an as-treated analysis was conducted in our secondary analysis, in which the converted patients were analyzed in the PK group.
Results
A total of 56 patients were eligible for inclusion in the study. In 3 patients (5.4%), baseline data on the NEI VFQ-25 were missing. Consequently, a total of 53 eyes in 53 patients were included in the economic evaluation, with 28 patients in the DALK group and 25 in the PK group. Because of perforations of the Descemet membrane, 5 patients in the DALK group did not receive the allocated treatment and were converted to PK. However, according to the intention-to-treat principle, these patients were analyzed in the DALK group. In the PK group, all patients received the allocated treatment.
In Table 1 , the baseline characteristics of the patients included in the study are shown. The mean age was 43.4 ± 15.9 years and 42.9 ± 14.1 years in the DALK group and the PK group, respectively ( P = .9). Twenty-seven patients in the DALK group and 22 patients in the PK group were phakic, which is not significantly different ( P = .26). In both treatment groups, the main reason for keratoplasty was keratoconus and corneal scarring caused by herpes simplex virus keratitis. The mean baseline composite score on the NEI VFQ-25 was 63.5 and 68.3 in the DALK and PK groups, respectively ( P = .33).
| DALK | PK | P Value | |
|---|---|---|---|
| Eyes (n) | 28 | 25 | |
| Age in yrs (mean ± SD) | 43.4 ± 15.9 | 42.9 ± 14.1 | .9 |
| Women (n, %) | 13 (46%) | 11 (44%) | .86 |
| Recipient lens status | |||
| Phakic | 27 (96%) | 22 (88%) | .26 |
| Pseudophakic | 1 (4%) | 3 (12%) | |
| Diagnosis | |||
| Keratoconus | 15 (54%) | 14 (56%) | |
| Herpes simplex virus keratitis | 7 (25%) | 7 (28%) | |
| Corneal ulcer | 6 (21%) | 1 (4%) | |
| Pre-Descemet dystrophy | 0 | 2 (8%) | |
| Groenouw stromal dystrophy | 0 | 1 (4%) | |
| Composite score NEI VFQ-25 (mean ± SD) | 63.5 ± 20.1 | 68.3 ± 15.2 | .33 |
In Table 2 , visual outcomes are displayed, showing comparable preoperative UCVA and BSCVA in the DALK and PK group. At 12 months after surgery, UCVA, BSCVA, and BSCVA gain were not significantly different between both groups. Further details of this population have been described elsewhere.
| DALK (Mean ± SE) | PK (Mean ± SE) | P Value a | |
|---|---|---|---|
| UCVA (logMAR) | |||
| Preoperative | 1.13 ± 0.07 (20/270) | 1.20 ± 0.07 (20/315) | 0.49 |
| 3 months | 0.95 ± 0.07 (20/180) | 0.72 ± 0.07 (20/105) b | 0.02 |
| 6 months | 0.89 ± 0.08 (20/160) b | 0.78 ± 0.08 (20/120) b | 0.32 |
| 12 months | 0.74 ± 0.08 (20/110) b | 0.71 ± 0.08 (20/100) b | 0.79 |
| BSCVA (logMAR) | |||
| Preoperative | 0.90 ± 0.08 (20/160) | 0.81 ± 0.08 (20/130) | 0.4 |
| 3 months | 0.59 ± 0.08 (20/80) b | 0.32 ± 0.04 (20/40) b | 0.01 |
| 6 months | 0.52 ± 0.07 (20/65) b | 0.30 ± 0.05 (20/40) b | 0.02 |
| 12 months | 0.39 ± 0.06 (20/50) b | 0.31 ± 0.07 (20/40) b | 0.37 |
| BSCVA gain (logMAR) | |||
| 3 months | 0.32 ± 0.1 | 0.49 ± 0.09 | 0.19 |
| 6 months | 0.39 ± 0.09 | 0.51 ± 0.1 | 0.34 |
| 12 months | 0.52 ± 0.08 | 0.50 ± 0.11 | 0.92 |
a P value between DALK and PK ( t test).
b P < .05 between one of the postoperative visits and the preoperative visit (linear regression model).
Effectiveness
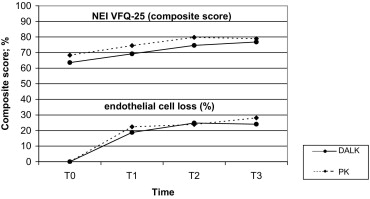
In Figure 2 , mean outcomes on the NEI VFQ-25 composite scale and mean endothelial cell losses are displayed for the 2 treatment groups at the four measurements. At 12 months after surgery, pooled data showed that 59% of the patients were clinically improved (minimum gain of 10 points in the NEI VFQ-25 composite score) in the DALK group and 48% in the PK group. An endothelial cell loss of maximally 20% within the first year was found in 39% of the patients in the DALK group and 24% of the patients in the PK group. In Table 3 , the outcomes on the NEI VFQ-25 questionnaire are shown. In both groups, scores on all subscales increased at 12 months after surgery as compared with randomization.
| T0 | T1 | T2 | T3 | Change scores T3 – T0 | ||||||
|---|---|---|---|---|---|---|---|---|---|---|
| DALK | PK | DALK | PK | DALK | PK | DALK | PK | DALK | PK | |
| NEI VFQ-25 subscales | ||||||||||
| General vision | 50.4 | 51.4 | 53.2 | 56.2 | 59.7 | 61.4 | 58.1 | 60.2 | 7.8 | 8.8 |
| Ocular pain | 51.8 | 59.5 | 59.2 | 70.0 | 70.3 | 75.5 | 69.9 | 76.5 | 18.1 | 17.0 |
| Near activities | 64.3 | 67.8 | 70.8 | 79.7 | 76.2 | 81.8 | 79.2 | 82.0 | 14.9 | 14.2 |
| Distance activities | 61.9 | 67.0 | 69.1 | 73.5 | 75.7 | 79.7 | 77.3 | 80.5 | 15.4 | 13.5 |
| Social functioning | 81.8 | 89.3 | 85.1 | 91.0 | 88.2 | 92.3 | 90.7 | 92.7 | 8.8 | 3.3 |
| Mental health | 60.2 | 63.4 | 68.7 | 72.2 | 73.3 | 77.8 | 74.6 | 72.4 | 14.4 | 9.0 |
| Role difficulties | 55.1 | 56.8 | 60.8 | 66.8 | 67.7 | 73.3 | 71.3 | 68.3 | 16.2 | 11.5 |
| Dependency | 77.9 | 83.5 | 84.1 | 87.5 | 85.7 | 89.8 | 89.4 | 89.0 | 11.5 | 5.5 |
| Driving | 50.1 | 56.9 | 53.7 | 54.8 | 55.6 | 71.7 | 65.5 | 70.9 | 15.4 | 14.0 |
| Color vision | 88.9 | 89.0 | 90.0 | 92.0 | 93.4 | 95.0 | 91.6 | 96.0 | 2.7 | 7.0 |
| Peripheral vision | 58.9 | 67.0 | 66.3 | 76.0 | 74.6 | 79.0 | 77.0 | 79.0 | 18.0 | 12.0 |
| Composite score | 63.6 | 68.3 | 69.2 | 74.5 | 74.6 | 79.8 | 76.8 | 78.9 | 13.2 | 10.5 |
| General health | 62.9 | 61.4 | 65.3 | 63.4 | 64.8 | 65.8 | 64.1 | 60.5 | 1.2 | −0.9 |
Costs
Table 4 shows the mean resource use and pooled costs per patient. Mean total costs per patient were €7607 (US$10 498) in the DALK group compared with €6552 (US$9042) in the PK group. Differences in costs were caused mainly by the costs in the surgical procedures. Preoperative costs accounted for the highest costs in both groups, but were comparable.
| Costs per unit (€) | Resources | Costs (€; Standard Error of Mean) | |||
|---|---|---|---|---|---|
| DALK (n = 28) | PK (n = 25) | DALK (n = 28) | PK (n = 25) | ||
| Preoperative costs | |||||
| BIS foundation services | 3599/cornea | 1 | 1 | 3599 | 3599 |
| Outpatient visits | 27/visit | 1 | 0.6 | 28 (4) | 16 (3) |
| Diagnostic procedures | Variable | 1 | 0.9 | 18 (4) | 17 (4) |
| Subtotal | 3645 | 3632 | |||
| Surgical procedures | |||||
| Transplantation | |||||
| Operating room costs | 9.50/min | 148 | 115 | 1407 (51) | 1096 (68) |
| Ophthalmology costs | 6.20/min | 117 | 85 | 725 (29) | 529 (39) |
| Additional procedures | |||||
| Operating room costs | 9.50/min | 20 | 4 | 193 (63) | 39 (23) |
| Ophthalmology costs | 6.20/min | 17 | 2 | 107 (31) | 13 (7) |
| Subtotal | 2432 | 1677 | |||
| Hospitalization | |||||
| Day care | 229/day | 0.3 | 0.2 | 71 (20) | 49 (19) |
| Admission | 248/day | 3.4 | 2.7 | 848 (113) | 679 (55) |
| Laboratory tests | variable | 0.9 | 0.9 | 48 (7) | 32 (5) |
| Subtotal | 967 | 760 | |||
| Follow-up visits | |||||
| Outpatient visits | 27/visit | 11.5 | 10.2 | 311 (18) | 276 (18) |
| Diagnostic procedures | variable | 9.6 | 6.8 | 212 (24) | 167 (22) |
| Subtotal | 523 | 443 | |||
| Postoperative drugs | 10/bottle | 4 | 4 | 40 | 40 |
| Total costs (€) | 7607 (232) | 6552 (128) | |||
Stay updated, free articles. Join our Telegram channel

Full access? Get Clinical Tree


