Purpose
To evaluate the performance of corneal hysteresis (CH), corneal resistance factor (CRF), 37 Ocular Response Analyzer (ORA) waveform parameters, and 15 investigator-derived ORA variables in differentiating forme fruste keratoconus (KC) from normal corneas.
Design
Case-control study.
Methods
Seventy-eight eyes of 78 unaffected patients and 21 topographically normal eyes of 21 forme fruste KC patients with topographically manifest KC in the contralateral eye were matched for age, the thinnest point of the cornea, central corneal thickness, and maximum keratometry. Fifteen candidate variables were derived from exported ORA signals to characterize putative indicators of biomechanical behavior, and 37 waveform parameters were tested. Differences between groups were assessed by the Mann-Whitney test. The area under the receiver operating characteristic curve (AUROC) was used to compare the diagnostic performance.
Results
Ten of 54 parameters reached significant differences between the groups (Mann-Whitney test, P < .05). Neither CRF nor CH differed significantly between the groups. Among the ORA waveform measurements, the best parameters were those related to the area under the first peak, p1area, and p1area1 (AUROC, 0.714 ± 0.064 and 0.721 ± 0.065, respectively). Among the investigator ORA variables, a measure incorporating the pressure-deformation relationship of the entire response cycle performed best (hysteresis loop area, AUROC, 0.694 ± 0.067).
Conclusion
Waveform-derived ORA parameters, including a custom measure incorporating the pressure-deformation relationship of the entire response cycle, performed better than traditional CH and CRF parameters in differentiating forme fruste KC from normal corneas.
Ectasia is an important complication after refractive surgery, and there is interest in the preoperative identification of patients at risk for developing this condition. A topographic keratoconus pattern is the most important risk factor. A major goal of preoperative evaluation is the detection of corneas with subclinical or early-stage keratoconus. Although clinical examination and computed corneal topography can be used to diagnose keratoconus in its clinical form, the detection of subclinical forms remains a challenge. Various terms, including keratoconus suspect and forme fruste keratoconus, have been used to describe the subclinical condition.
The term “keratoconus suspect” was initially used to describe eyes at risk for developing keratoconus based on subjective impressions of topographic patterns. Videokeratography can be used to quantify the pattern of keratoconus and simplify the disease classification. Using this approach, the progression of disease in keratoconus suspect eyes can be described using quantitative indices, and eyes with keratoconus can be confirmed. Thus, the term keratoconus suspect can be reserved for corneas that display a topographic pattern characterized by specific quantitative indices. The term “forme fruste keratoconus” refers to topographic patterns that are insufficient to reach the threshold of keratoconus or keratoconus suspect based on computerized quantitative indices.
Published studies have indicated that the corneal hysteresis (CH) value and corneal resistance factor (CRF) are lower in corneas with keratoconus and in corneas that have undergone laser in situ keratomileusis than in normal corneas. In addition, new indices derived from the waveform signals obtained with an Ocular Response Analyzer (ORA; Reichert Ophthalmic Instruments, Depew, New York, USA) demonstrate the ability to distinguish keratoconus from normal corneas more accurately than the original pressure-derived parameters (CH, CRF). A panel of candidate diagnostic variables using exported ORA data to characterize the temporal applanation signal intensity and the pressure features of the corneal response was also recently developed.
Patients with topographically normal unilateral keratoconus provide a unique opportunity to evaluate methods for detecting the features of the disease at a very early stage. In the present study, we compared the original ORA pressure-derived parameters (CH, CRF, Goldman-correlated intraocular pressure [IOPg], corneal compensated intraocular pressure [IOPcc]), 37 waveform signal parameters, and 15 candidate variables from exported ORA signals to characterize putative indicators of biomechanical behavior between a group of fellow eyes of patients with unilateral keratoconus and a group of normal eyes. The groups were matched with regard to the central corneal thickness, the thinnest point of the cornea, and maximum keratometry (Kmax) in order to reduce the possibility of influencing the morphologic characteristics. The groups were also matched for age, which is known to affect the biomechanical results.
Methods
Subjects
This study was a case-control study. The study protocol was approved by the Ethics and Research Committee of São Paulo Federal University (Protocol 2012/10), and a waiver of informed consent was granted because of the low risk of this research. The principles of the Declaration of Helsinki were followed for all study procedures.
Patients were examined at the Instituto de Olhos Renato Ambrósio (Rio de Janeiro, Brazil). We studied 99 eyes of 99 patients, who were divided into 2 groups: the case group, which comprised 21 eyes of 21 patients with normal Placido-disc corneal topographies, in which the fellow eye had keratoconus (forme fruste keratoconus cases); and the control group, which comprised 78 eyes of 78 patients with bilateral normal corneas. The control group was formed by randomly choosing a single eye of each patient with bilaterally normal eyes according to topographic criteria.
The criteria for normality and disease were based on the Rabinowitz indices and were evaluated by a corneal topographer using Placido disks (Humphrey Atlas). A KISA index greater than 100% was considered early keratoconus, a value less than 60% was considered normal, and values between 60% and 100% were considered suspect keratoconus. The fellow eye was considered for analysis when the KISA index on corneal topography was less than 60% without a suspect pattern.
The control group included patients without corneal topographic irregularities, high refractive error, or collagen vascular disease. Excluded from both groups were patients with severe ocular allergy, a history of ocular surgery or any eye disease, or any systemic disease or syndrome.
A comprehensive eye examination was conducted for all patients. In addition to the topographic data, the following information was obtained for each patient: age, thinnest point of the cornea, central pachymetry, topographic astigmatism, Kmax, and biomechanical data obtained with an ORA, including IOPg, IOPcc, CH, CRF, 37 parameters derived from analyses of the waveform signal, and 15 candidate variables using exported ORA data to characterize the temporal, applanation signal intensity, and pressure features of the corneal response. To avoid bias, patients allocated to each group were matched with regard to the thinnest point, maximum keratometry, age, and central pachymetry values, as these parameters influence the results obtained with an ORA.
Procedures
To determine the ocular biomechanical properties, the ORA applies pressure to the cornea by focusing a pulsed jet of air on the eye, causing the cornea to pass through applanation and develop a slight concavity. Milliseconds after the initial applanation, the air pump that generated the pulse is turned off, and the pressure applied to the eye symmetrically decreases. As the pressure decreases, the cornea passes through a second applanated state while returning to its normal convexity.
Energy absorption during deformation of the cornea produces a difference in the signal peaks representing the first and second applanation events, indicating the difference between the pressures required for inward (loaded) and outward (unloaded) deformation of the cornea. This difference in applanation pressure is defined as CH, which indicates the viscous damping in the cornea and reflects the capacity of the corneal tissue to absorb and dissipate energy. CRF, a measure that was empirically derived as an indicator of the central corneal thickness, reflects the total corneal resistance, weighted towards elasticity. In our study, only high-quality ORA readings were accepted for analysis.
With the introduction of new software (version 2.0), the ORA computes 37 new parameters that describe the waveform of the ORA response curve. The first set of these additional parameters describes the upper 75% of the peak height in the response curve with respect to the area under the curve (p1area, p2area); the upward slope (uslope1, uslope2), downward slope (dslope1, dslope2), width (w1, w2), height (h1, h2), and aspect ratio of the peaks (aspect1, aspect2); the path length around the peaks (path1, path2); the roughness of the peaks (aindex, bindex); and the roughness of the region between the peaks (aplhf), as well as 6 additional parameters (dive1, dive2, mslew1, mselw2, slew1, and slew2). A second set of parameters has the same description as the first set but considers only the upper 50% of the peak height (p1area1, p2area1, aspect11, aspect21, uslope11, uslope21, dslope11, dslope21, w11, w21, h11, h21, path11, path21). The p1area and p2area are influenced by the height of the infrared applanation signal peaks and the width (time course) of the corneal deformation response. The irregularity of the infrared signal peaks (aindex, bindex) and the roughness of the region between the peaks (aplhf) are related to the high-frequency components of the corneal deformation. Higher values indicate a more pronounced high-frequency/oscillatory corneal response.
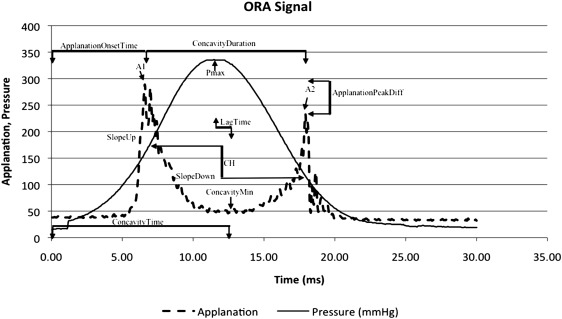
ORA infrared intensity and pressure time series data were exported using ORA software and analyzed using custom Matlab routines (version 7.0; Math Works, Natick, Massachusetts, USA) as described previously. Briefly, 15 variables were derived from the ORA signal and grouped according to waveform features as follows: applanation signal intensity (Group 1); applied pressure (Group 2); time (Group 3); applanation signal intensity as a function of the response time (Group 4); relationship between the applied pressure and the applanation signal response (Group 5); and relationship between the pressure and time (Group 6). All variables and their classifications are described in Table 1 . Previously described investigator-derived variables defined using features of the ORA signal hypothesized to be biomechanically relevant were also calculated and are introduced in Figure 1 .
| Variable | Operation Definition | Interpretation |
|---|---|---|
| Group 1 | ||
| A 1 | Peak intensity of first applanation event | Maximum surface area achieving planarity during inward deformation |
| A 2 | Peak intensity of second applanation event | Maximum surface area achieving planarity during recovery |
| Applanation peak difference | A 2 − A 1 | Difference in maximum planarity between inward and recovery phases |
| Concavity min | Minimum applanation intensity between A1 and A2 | Depth and irregularity (nonplanarity) of deformation |
| Concavity mean | Mean applanation intensity between A 1 and A 2 | Depth and irregularity of deformation average |
| Group 2 | ||
| Average P1P2 | (P1 + P2)/2 | Average of the pressures at the 2 applanation events |
| Pmax | Peak value of pressure signal | Force and time required to reach fisrt applanation event |
| Group 3 | ||
| Concavity duration | Time lapse between A 1 and A 2 | Temporal delay of deformation recovery between applanation events |
| Concavity time | Time from onset of applied pressure to A 1 | Time required to achieve maximum deformation from onset of impulse |
| Lag time | Time between P max and concavity min | Delay between peak applied pressure and maximum deformation |
| Applanation onset time | Time from onset of applied pressure to A 1 | Time required to achieve first applanation from onset of impulse |
| Group 4 | ||
| Slope up | Positive slope of the first applanation peak, from inflection point to peak | Rate of achieving peak planarity |
| Slope down | Negative slope of the first applanation peak, from inflection point to peak | Rate of loss of peak planarity |
| Group 5 | ||
| Hysteresis loop area | Area enclosure by pressure versus applanation function | Hysteresis aggregated over entire deformation cycle except concavity |
| Group 6 | ||
| Impulse | Area under pressure versus time curve | Air pressure intensity |
The ORA calculates a waveform score that is used to select the best measurement value of each parameter out of the 4 measured. We used the examination with the best waveform score after 4 consecutive measurements.
Statistical Analysis
Statistical analyses were performed using BioEstat 5.0 (Mamirauá Institute, Amazonas, Brazil) and MedCalc 11.1 (MedCalc Software, Mariakerke, Belgium). The nonparametric Mann-Whitney U test (Wilcoxon rank-sum) was used to evaluate the distribution of variables between the 2 groups. The significance criterion was submitted to Bonferroni correction. The receiver operating characteristic (ROC) curve and the area under the ROC curve (AUROC) were calculated for each parameter to examine the differences between the groups and determine the overall predictive accuracy of each test. The standard error of the AUROC was evaluated using the method of DeLong and associates. The exact binomial method was used to calculate confidence intervals for AUROCs, with 0.700 indicating the cutoff point for poor parameter performance. Values of P < .025 were considered to indicate statistical significance.
Results
Table 2 summarizes the demographic features, intraocular pressure, and topographic and tomographic characteristics of each group. The mean central pachymetry, thinnest point of the cornea, age, IOPg, IOPcc, astigmatism, and Kmax were not significantly different between the groups ( P > .05). The mean KISA index was 17.86% (95% confidence interval [CI], 10.33%–25.39%) in the forme frusta keratoconus (FFKC) group and 11.77% (95% CI, 8.57%–14.96%) in the control group. Although the difference between the 2 groups was statistically significant ( P = .049), the KISA index values were far below the 60% threshold for classification as keratoconus suspect based on the anterior topography features alone.
| FFKC Group | Control Group | P Value | |
|---|---|---|---|
| Patients | 21 | 78 | – |
| Eyes | 21 | 78 | – |
| Age (y) | 25.5 ± 7.2 | 26.6 ± 7.9 | .2 |
| Central pachymetry (μm) | 527.3 ± 16.7 | 527.9 ± 23.4 | .2 |
| Thinnest point (μm) | 526 ± 16.9 | 525.3 ± 23 | .08 |
| Astigmatism (D) | 1.2 ± 0.8 | 1.4 ± 1.1 | .1 |
| Kmax (D) | 44.9 ± 1.8 | 44.4 ± 1.4 | .3 |
| IOPg (mm Hg) | 12.5 ± 2.8 | 13.9 ± 2.9 | .08 |
| IOPcc (mm Hg) | 14.3 ± 3.4 | 14.8 ± 2.7 | .3 |
Biomechanical Data
Table 3 compares the biomechanical parameters between the groups. Ten parameters differed significantly between the groups: Pmax; Hysteresis Loop Area; Impulse; p1area; dive1; h1; p1area1; h11; uslope2; and mslew2 . Neither CH nor CRF achieved statistically significant differences.
| Parameter | Normal Mean ± SD | FFKC Mean ± SD | P Value |
|---|---|---|---|
| CRF | 9.76 ± 1.76 | 9.10 ± 1.99 | .0815 |
| CH | 10.14 ± 1.61 | 9.27 ± 2.16 | .1375 |
| AvgP1P2 | 176.38 ± 22.12 | 179.43 ± 55.85 | .2099 |
| Pmax | 424.31 ± 35.23 | 408.43 ± 45.09 | .0327 |
| Concavity duration | 10.90 ± 0.45 | 10.69 ± 1.14 | .942 |
| Concavity time | 12.95 ± 0.88 | 12.83 ± 0.87 | .5692 |
| Lag time | 0.81 ± 0.56 | 0.74 ± 0.50 | .6409 |
| Applanation onset time | 7.69 ± 0.43 | 7.66 ± 0.77 | .186 |
| A1 | 585.42 ± 151.68 | 519.00 ± 160.57 | .0926 |
| A2 | 483.38 ± 136.40 | 418.38 ± 174.69 | .1298 |
| Applanation peak difference | −102.04 ± 126.51 | −100.62 ± 169.75 | .8877 |
| Concavity min | 48.89 ± 9.89 | 51.87 ± 12.44 | .2427 |
| Concavity mean | 120.32 ± 21.66 | 117.94 ± 44.04 | .2964 |
| Slope down | −105.12 ± 36.30 | −93.03 ± 38.26 | .1504 |
| Slope up | 79.04 ± 30.07 | 66.57 ± 30.08 | .2083 |
| HLA | 55570.78 ± 15835.89 | 43614.55 ± 18597.56 | .0067* a |
| Impulse | 4541.11 ± 320.55 | 4402.86 ± 418.84 | .031 |
| p1area | 3351.49 ± 907.78 | 2644.83 ± 746.93 | .0027* a |
| aspect1 | 18.06 ± 6.18 | 15.34 ± 6.19 | .0985 |
| uslope1 | 63.31 ± 31.53 | 49.71 ± 25.17 | .075 |
| dslope1 | 26.19 ± 8.87 | 23.25 ± 9.42 | .1504 |
| w1 | 21.59 ± 2.68 | 21.71 ± 3.51 | .6439 |
| dive1 | 324.06 ± 119.49 | 266.39 ± 115.82 | .0395 |
| h1 | 379.39 ± 104.01 | 319.06 ± 102.74 | .019* a |
| path1 | 22.43 ± 3.94 | 24.96 ± 6.05 | .1193 |
| mslew1 | 106.45 ± 39.14 | 89.58 ± 30.31 | .0779 |
| slew1 | 64.77 ± 31.04 | 56.41 ± 25.13 | .4161 |
| p1area1 | 1416.89 ± 442.61 | 1085.19 ± 363.43 | .0019 a |
| Aindex | 9.24 ± 1.04 | 8.59 ± 1.52 | .0909 |
| aspect11 | 24.52 ± 9.82 | 25.29 ± 16.21 | .5491 |
| uslope11 | 62.03 ± 31.47 | 56.78 ± 31.67 | .4113 |
| dslope11 | 41.04 ± 17.51 | 44.78 ± 27.95 | .9532 |
| w11 | 11.01 ± 2.43 | 10.05 ± 3.25 | .2275 |
| h11 | 252.93 ± 69.34 | 212.70 ± 68.49 | .019* a |
| path11 | 32.61 ± 7.16 | 36.11 ± 9.16 | .0736 |
| Aplhf | 1.31 ± 0.31 | 1.55 ±0.84 | .1933 |
| p2area | 2193.56 ± 593.84 | 1928.98 ± 597.38 | .179 |
| aspect2 | 18.16 ± 8.99 | 14.54 ± 11.03 | .067 |
| uslope2 | 85.64 ± 43.11 | 62.14 ± 45.55 | .048 |
| dslope2 | 23.63 ± 12.91 | 19.51 ± 14.99 | .0869 |
| w2 | 18.59 ± 4.52 | 22.67 ± 9.02 | .1153 |
| h2 | 305.88 ± 94.65 | 252.13 ± 120.12 | .0689 |
| dive2 | 236.13 ± 88.24 | 209.27 ± 111.58 | .4386 |
| path2 | 25.53 ± 6.57 | 25.33 ± 6.05 | .9863 |
| mslew2 | 127.26 ± 56.25 | 97.08 ± 51.35 | .0452 |
| slew2 | 86.04 ± 42.52 | 63.70 ± 44.10 | .05 |
| p2area1 | 930.90 ± 282.29 | 831.18 ± 277.80 | .3464 |
| aspect21 | 26.30 ± 14.23 | 20.85 ± 15.21 | .1012 |
| uslope21 | 68.73 ± 31.87 | 54.66 ± 42.13 | .0869 |
| dslope21 | 41.18 ± 26.53 | 32.25 ± 24.35 | .1433 |
| w21 | 9.00 ± 3.02 | 10.67 ± 5.31 | .4088 |
| h21 | 203.92 ± 63.10 | 168.09 ± 80.08 | .0689 |
| path21 | 36.07 ± 9.27 | 34.00 ± 8.43 | .3553 |
| Bindex | 9.35 ± 1.07 | 8.42 ± 2.32 | .2194 |
Stay updated, free articles. Join our Telegram channel

Full access? Get Clinical Tree


