The standard for the diagnosis of obstructive sleep apnea (OSA) is polysomnography (PSG). Although PSG helps identify individuals who have OSA and guides medical management, it does not identify the obstruction site or predict surgical results. Radiologic and diagnostic studies have been used to direct surgical intervention and predict outcomes of sleep apnea surgery. These studies include lateral cephalometric radiographs, CT, MRI, asleep fluoroscopy, asleep and awake endoscopy, upper airway manometry, and acoustic reflection techniques. The ideal diagnostic study would identify individuals who have OSA, be cost-effective and readily accessible, and guide therapeutic, site-specific intervention with predictable results. In this article, the various modalities are reviewed in terms of their capability to effectively diagnose and guide treatment of OSA.
The standard for the diagnosis of obstructive sleep apnea (OSA) is polysomnography (PSG). Although PSG helps to identify individuals who have OSA and guides medical management, it does not identify the site of obstruction or predict surgical results. Radiologic and diagnostic studies have been used to direct surgical intervention and predict outcomes of sleep apnea surgery. These studies include lateral cephalometric radiographs, CT, MRI, asleep fluoroscopy, asleep and awake endoscopy, upper airway manometry, and acoustic reflection techniques. The ideal diagnostic study would identify individuals who have OSA, be cost-effective and readily accessible, and guide therapeutic, site-specific intervention with predictable results. In the following sections, the various modalities are reviewed in terms of their capability to effectively diagnose and guide treatment of OSA.
Lateral cephalometric radiographs
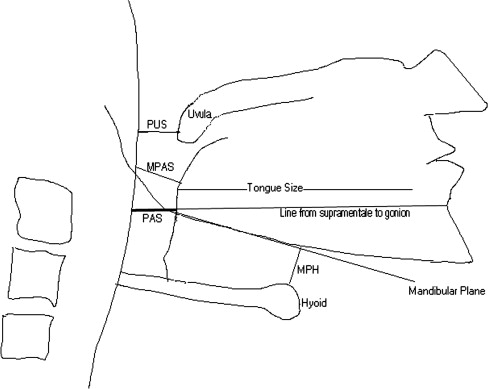
Lateral cephalometric radiographs provide an inexpensive method to evaluate skeletal and soft tissue abnormalities contributing to obstruction, and have been the most widely used imaging modality to study patients who have OSA. Limitations of the study involve studying a three-dimensional object with a two-dimensional picture. Additionally, lateral cephalometric radiographs are done awake, and examination while awake only provides limited characterization of obstruction during sleep. Most commonly used soft tissue cephalometric measurements include tongue size, soft palate length, and posterior airway space (PAS) Fig. 1 . The PAS has been defined as the distance from the base of the tongue to the posterior pharyngeal wall on the line between the supramentale and gonion. Some authors have added the minimal posterior airway space (MPAS) as the narrowest point between the base of the tongue and the posterior pharyngeal wall. Skeletal cephalometric measurements most commonly involve measurement of the position of the hyoid bone in relation to the mandible, and the position of the maxilla and mandible relative to the skull base. The mandibular plane-hyoid distance (MPH) is measured as the distance between the plane parallel to the inferior mandibular border and the hyoid. It is hypothesized that the inferior displacement of the hyoid leads to an increased degree of tongue base projection into the hypopharynx, as well as lengthening of the airway, contributing to collapse. The relationships of the cranium to the maxilla and the mandible are assessed by measuring angles between the sella, nasion, and anterior nasal spine (SNA) for the maxilla; and the sella, nasion, and supramentale (SNB) for the mandible Fig. 2 . Normative data from various studies are summarized in Table 1 . These measurements have been evaluated to help identify OSA patients and predict successful surgical candidates.
| Measure | Men–mean (SD) | Women–mean (SD) |
|---|---|---|
| Soft palate length | 41.0 mm (3.3) | 37.3 mm (3.8) |
| MPH | 19.5 mm (7.1) | 15.8 mm (4.1) |
| PAS | 14.5 mm (3.5) | 13.7 mm (3.3) |
| SNA | 81.7 degrees (4.6) | 80.7 degrees (4.8) |
| SNB | 79.1 degrees (4.9) | 79.2 degrees (4.4) |
Many studies have correlated cephalometric measurements with PSG data to identify skeletal abnormalities that contribute to OSA. In differentiating normal from OSA patients, deBerrry and colleagues identified several differentiating features. OSA patients had maxillary deficiency as measured by a smaller SNA angle, as well as an inferiorly displaced hyoid (increased MPH), contributing to a smaller PAS. Also, the mandible was more inferiorly displaced, leading to elongated faces. In comparing OSA patients with their siblings who did not have OSA, Riha and colleagues determined that there is a lower set hyoid in OSA individuals. Multiple studies have confirmed findings of inferiorly displaced hyoid (increased MPH), smaller PAS, and soft palate enlargement being associated with OSA . Jamieson and colleagues found that 150 of 155 OSA patients had at least two abnormalities on lateral cephalometrics that were two deviations from the norm. Based on the cephalometric analyses, multiple studies have confirmed that differences in anatomic structure exist between normal and OSA patients.
Multiple studies have distinguished two patient groups who have OSA. One group comprises patients who are obese as measured by body mass index (BMI) or neck circumference (NC), and who have abnormal soft tissue measurements on cephalometric radiographs. The second group are patients who are not obese by these measures, but instead have skeletal abnormalities identified on cephalometric radiographs as a cause of their sleep apnea . Tsuchiya and colleagues showed that individuals who have high apnea index (AI) and low BMI have a skeletal mismatch. Individuals who have low AI and high BMI have abnormal soft tissue structures. Similarly, Ferguson and colleagues evaluated neck circumference (NC) and found that individuals who had a normal NC (less than 42 cm) and who had OSA had craniofacial anomalies on imaging. Individuals who had larger NC and OSA had larger tongues, longer MPH, and elongated soft palate.
Many investigators have attempted to use regression analysis to identify the appropriate “formula” for combining measurements from lateral cephalometric radiographs to calculate the degree of sleep apnea. The initial studies took data from lateral cephalometric radiographs and tried to match them to PSG data. Bacon and colleagues determined that there are significant differences between the anterior cranial base length, dimension of the bony pharynx, and maxillary length of normal and OSA individuals. Based on anatomic differences, 80% of individuals were classified correctly into sleep apnea and normal groups. Hoekema and colleagues evaluated 31 patients who had OSA and 37 controls, and found a significant difference between the position of the hyoid and SNA between the groups. Multiple regression allowed for prediction of individuals into OSA and non-OSA with 94% accuracy, based on hyoid relationships and SNA. Dempsey and colleagues found that individual patients who had maxillary deficiency, based on measurement from maxillary spine to porion (uppermost/outermost portion of bony external auditory canal), were five to seven times more likely to have moderate or severe sleep apnea if they were non-obese, and three times more likely if they were obese patients. In a study of Japanese males, non-obese individuals where found to have smaller SNA and SNB angles, correlating with severity of OSA .
These retrospective analyses help to identify trends in data and tendencies for patients who have and do not have OSA; however, prospective studies are needed to evaluate these regression formulas for their effectiveness as diagnostic studies. Unfortunately, the prospective studies evaluating cephalometric measurements to date have not correlated well with PSG data. A prospective study by Bates and McDonald evaluated 121 radiographs involving 48 angular and linear measurements, and did not find any factors that significantly correlated with the severity of OSA. DeBerry-Borowiecki and colleagues also confirmed that in comparison to PSG, deviations of anatomic measurements from normal subjects did not help predict the severity of OSA. Based on these data, we know that a mild difference in lateral cephalometric radiographs measurements exists between normal and OSA patients, but at this point, the differences noted are not significant enough to allow use of lateral cephalometric radiographs as a sole diagnostic procedure.
Predicting successful uvulopalatopharyngoplasty
The surgical success rate for uvulopalatopharyngoplasty (UPPP) alone is less than 50%. Cephalometric measurements have been used in an attempt to improve surgical success. Simmons and colleagues were not able to reliably predict success or failure of UPPP based on the anatomic appearance of the palate and lateral pharyngeal walls. In a review of cephalometric data of patients who underwent unsuccessful UPPP, Riley and colleagues reported significantly smaller PAS, and increased MPH. Those patients who showed significant improvement following UPPP had PAS and MPH measurements similar to those of the controls. Riley and colleagues concluded that UPPP alone was not a successful treatment for OSA when hypopharyngeal obstruction exists as shown by abnormal PAS and MPH measurements. Millman and colleagues performed a retrospective review of 46 patients, and concluded that an MPH greater than 20 mm is statistically significant in predicting UPPP to be unsuccessful.
In a large retrospective review of nine papers containing raw data on 168 patients, OSA patients who had narrowing of only the retropalatal region had a 52.3% response rate to UPPP, whereas those patients who had some retrolingual narrowing had a 5.3% response rate ( P < .0001) .
The prospective studies in the literature do not support the findings of these retrospective studies. In the first study, 34 consecutive OSA patients were evaluated, and no significant difference in the PAS and MPH between the responder and nonresponder groups was found . In the second study, 60 consecutive OSA patients were evaluated, and a significantly smaller PAS in responders versus nonresponders was noted . A smaller PAS in responders to UPPP was completely opposite to the findings of Riley and colleagues . In the third study, 30 consecutive OSA patients were evaluated and no significant difference in PAS between groups was noted ; however, lowered hyoid position (longer MPH), increased cranio-cervical angle, and shortening of the maxilla were significantly associated with poor UPPP outcome. A predictive model containing these three cephalometric measurements and hypersomnia correctly classified 83% of the patients in the study.
Thus the data about the predictive value of lateral cephalometric radiographs for success of UPPP are contradictory. The bulk of the data predict that patients who have narrowing of the retrolingual region will have a poor outcome following UPPP ; however, the more statistically sound prospective studies all indicate that this has no effect on success . A number of different explanations for this discrepancy in the predictive value of the PAS exist. First, the retrospective studies may be skewed because of bias. The prospective studies are less likely to suffer from this error. Second, the parameters from the lateral cephalometric radiographs may not provide adequate information for predicting outcome of UPPP, and only a portion of the variability in outcome is because of the change in cephalometric parameters. This last explanation is unlikely because of the strong statistical significance of the prospective study by Ryan ( P <.0005). Third, each of the studies uses a different method of distinguishing responders from nonresponders. Fourth, differences in the extent of resection with UPPP would vary the results; however, the descriptions of surgical techniques are all very similar.
Predicting successful multilevel pharyngeal surgery
Because of the low rate of success for UPPP alone for treatment of OSA, many surgeons have adopted techniques to treat the area of the tongue base, in addition to the palate. Lateral cephalometric radiographs have been used to try to evaluate these OSA patients before multilevel pharyngeal surgery. A couple of parameters on lateral cephalometric radiographs have been identified to help predict outcomes for multilevel pharyngeal surgery, but these do not apply to the majority of patients who have sleep apnea. In a review of 55 OSA patients treated with inferior sagittal mandibular osteotomy with hyoid myotomy and suspension, responders had a significantly less retruded mandible than nonresponders (SNB 81.0° ± 2.0° versus 75.5° ± 1.5°) . The decreased SNB represented a retruded mandible causing a narrowed hypopharyngeal airway. Riley and colleagues concluded that OSA patients who have these severe mandibular deficiencies (SNB<74°) and who fail this surgical procedure, need further surgical correction of their bony abnormalities to alleviate their OSA. Both of these studies agree that severe mandibular retrusion is not well-addressed with the various genioglossus advancement procedures, and probably requires more aggressive treatment with maxillo-mandibular advancement.
Liu and colleagues performed a prospective study of UPPP an d genioglossus advancement (GA) in 44 patients. They were unable to show any changes to PAS, MPH, or length of the hard/soft palate that predicted cure of OSA. Similarly, Kuhnel and colleagues used the repose system for tongue advancement in 28 males, and there was no correlation between improvement of airway dimensions and respiratory disturbance index (RDI). Overall, patients who have severe mandibular deficiencies can be identified, and require correction of their skeletal abnormalities to correct their OSA; however, the majority of OSA patients do not have severe skeletal abnormalities, and those who can be cured with multilevel pharyngeal surgery cannot be distinguished from those who cannot by using lateral cephalometric radiographs.
Assessing surgical results
Studies have used lateral cephalometric radiographs to assess outcome following multilevel OSA surgery. All of the studies show changes in the PAS and MPH following OSA surgery; however, none of the studies found a correlation between the change in cephalometric parameters and PSG data . The first study reviewed 40 OSA patients who had failed treatment with limited mandibular osteotomy with hyoid advancement, and were subsequently treated with advancement of the maxilla by Le Fort I osteotomy, with rigid fixation and advancement of the mandible by bilateral sagittal ramus split . Significant changes were seen in the SNA, SNB, PAS, and MPH measurements, but no direct relationship was found between the changes in the PAS and the changes in PSG data . The second study reviewed 12 OSA patients following inferior sagittal osteotomy with sliding mandibular osteotomy and hyoid bone suspension, and found a significant increase in the PAS and a decrease in MPH that was not statistically significant . No pre- or postoperative cephalometric measurements or changes in these measurements were correlated with the amount of reduction in the RDI or the change in the lowest nocturnal oxygen saturation . The third study reviewed 19 OSA patients following UPPP, mandibular osteotomy with genioglossus advancement, and hyoid myotomy with advancement . Changes in the PAS and MPH approached statistical significance, and once again, these changes could not be correlated with changes in PSG data . Eggensperger and colleagues performed a long-term evaluation of 15 patients after mandible advancement who had enlargement of the airway postoperatively. At 12 years, there was relapse of skeletal advancement, possibly because of stretch of suprahyoid musculature, with subsequent narrowing of airway size in comparison to preoperative levels. Based on the results, the authors conclude that changes are noted following multilevel pharyngeal surgery; however, the changes on lateral cephalometric radiograph do not accurately reflect the impact that surgery has on the severity of sleep apnea.
Computed tomography
When evaluating the upper airway for obstruction, CT scans offer greater anatomic detail than lateral cephalometric radiographs. If anatomic abnormalities are the cause of OSA, CT scans should better delineate these abnormalities, and better direct surgical interventions toward the abnormal anatomic sites than plain radiographs. As the studies below show, however, the anatomy of the upper airway while awake only represents the static dimensions of the awake airway, and does not have a high predictive value for diagnosing OSA.
Further efforts have been made to control variables during CT scanning. Respiratory efforts have been shown to change upper airway dimensions. Using fast-CT scans to evaluate changes in upper airway anatomy during different stages of the respiratory cycle has controlled variations because of the respiratory cycle. Asleep upper airway anatomy varies from awake anatomy, and efforts have been made to perform CT scans while asleep to assess the sleep anatomy, but little work has been done to evaluate the ability of asleep CT scans to direct surgical intervention. Despite the low sensitivity of CT scans for the diagnosis of OSA, studies using CT scanning have been able to show correlations between anatomic changes and improvement of OSA parameters, in contrast to the studies done with lateral cephalometric radiographs.
Distinguishing apnea from control patients
Several awake CT studies have shown statistically significant narrowing of the oropharynx, especially in the retropalatal region, in OSA patients compared with controls ( P <.001 for all three studies) . These studies differed in their findings of nasopharyngeal and hypopharyngeal cross-sectional areas, with two showing significant differences between OSA patients and controls ( P <.05) , and one showing no difference . A fourth study showed supported narrowing in the oropharynx in OSA patients compared with controls ( P = .052 in inspiration and no significant difference in expiration), but contradicted the previous studies by showing significant widening of the hypopharynx on expiration in OSA patients compared with controls ( P = .009) .
Shepard and colleagues reported that 70% of their patients were correctly classified as either normal subjects or OSA patients, based on a minimal upper airway cross section area (Amin) of 1 cm 2 or less for OSA patients. This 70% sensitivity for distinguishing OSA patients from normal controls is not high enough to make CT scanning a useful diagnostic test. Data from two of these studies showed that no normal controls were noted to have complete obstruction at the level of the oropharynx , and 6 of 20 and 5 of 10 OSA patients were noted to have complete obstruction at this level. Thus complete obstruction at the level of the oropharynx on CT scan had 100% specificity for OSA, but poor sensitivity.
These studies compared OSA with normal patients, but did not address the more clinically relevant question of distinguishing OSA from snoring patients. One study addressed this problem and found significantly wider tongue widths and wider genioglossus muscles in OSA patients compared with snoring and normal patients ( P <.001), although considerable overlap was present between the three groups .
Data showing narrowing of the oropharynx on CT scan in OSA patients support the data from lateral cephalometric radiographs . Furthermore, in a study of 16 men who had OSA comparing lateral cephalometric radiograph to CT scan measurements, a statistically significant correlation (r = 0.92, P <.005) was found between the PAS and the smallest volume measured behind the base of the tongue . With this high degree of correlation, the added anatomic accuracy of CT scans did not appear to significantly increase the sensitivity of the radiological diagnosis of OSA. CT scans and lateral cephalometric radiographs represent static soft tissue and bony dimensions, which are only indirectly related to the dynamic changes responsible for obstructions during sleep.
To more accurately define the site of obstruction during sleep, one group performed CT scans both awake and asleep in OSA patients . Five of eight of the patients required temazepam 10 mg to aid the onset of sleep. Horner and colleagues showed that the narrowest segment of the upper airway was the segment posterior to the soft palate in the majority of the patients, and that the Amin was significantly narrowed in OSA patients as compared with control patients ( P <.05). While asleep, all patients showed obstruction of the segment of the airway posterior to the soft palate, and approximately half had obstruction extend below the level of the soft palate. It was hypothesized that those patients who have obstruction below the level of the soft palate would have low likelihood of cure with UPPP, but this hypothesis remains untested .
Predicting successful uvulopalatopharyngoplasty
A few studies have used CT scans to predict surgical efficacy of UPPP. Two studies have found differences in surgical efficacy of UPPP between groups distinguished based on CT scan results. The first study showed significantly poorer success with patients who had widened tongue and genioglossus muscles ( P < .05) . The second study showed greater surgical efficacy of UPPP patients who had Amin less than 1 cm 2 , and with obstruction at a level 20 mm below the hard palate. Overall, these studies show hope that CT scans can distinguish responders from nonresponders to UPPP, and allow for selection of more appropriate surgical interventions for those deemed as nonresponders. Further studies will need to be performed to evaluate the utility of CT scans in this setting.
Assessing surgical results
Changes in airway dimension on axial CT scans following UPPP correlate well with cure of sleep apnea. Two studies showed significant widening of Amin to greater than 100 mm 2 in patients cured by UPPP, and Amin less than 100 mm 2 in patients not cured by UPPP . Similarly, a third study showed greater widening of the oropharynx following UPPP in good responders as compared with nonresponders . The ability for CT scans to correctly identify cured OSA patients following UPPP is in contrast to the lack of change seen on lateral cephalometric radiographs following multilevel pharyngeal surgery . The CT changes seen following UPPP may either reveal inadequately performed UPPP surgeries or other causes of retropalatal narrowing not addressed by UPPP. These issues will require further study.
Three-dimensional computed tomography scans
Three-dimensional reconstructed CT scans provide an easier way to assess the caliber of the upper airway than unreconstructed CT scans. An initial study using this modality showed significant correlation between AI and the ratio of tongue volume to airway volume in OSA patients . A larger follow-up study, including the previous cohort of patients, showed no correlation between polysomnographic data and upper airway volume measurements . A second prospective study evaluating three-dimensional airway CT supported the previous study by showing no statistically significant differences in airway dimensions between OSA patients and control patients. Overall, the studies with three-dimensional CT show no statistical differences in airway dimensions between OSA patient and control patients. These findings suggest that results from any modality used to make awake measurements of upper airway dimensions are not likely to correlate with the severity of OSA.
Three-dimensional reconstructed CT scans showed a difference in airway volumes for OSA patients who responded to UPPP compared with nonresponders. Smaller upper airway volumes ( P < .05), smaller upper airway to tongue volume ratios ( P < .01), and smaller oropharynx to soft palate volumes ( P < .05) were found in OSA patients who responded to UPPP compared with nonresponders . These prospective results with three-dimensional, reconstructed CT scans corroborate the previous findings, which showed that CT scans and lateral cephalometric radiographs show postoperative changes that correlate to success of the surgical procedure.
Dynamic computed tomography imaging
Static imaging may show areas of narrowing that predispose individuals to obstruction, but dynamic imaging can actually show episodes of obstruction. Cine CT or ultrafast CT scans allow for acquisition of eight contiguous slices every 0.7 seconds. This rapid scan time allows for dynamic assessment of the upper airway, as with fluoroscopy, with the added superior anatomic localization of CT imaging. This technology allows for observation of dynamic obstructions of the upper airway. Use of cine technology has shown that airway compliance can play a significant role in contributing to airway obstruction. Compliance is defined as a percentage change in the area of the airway during the respiratory cycle. Using ultrafast CT, smaller oropharyngeal airways ( P <.001) and nasopharyngeal airways ( P <.001) were found in OSA patients versus normal controls .
To precisely correlate cine CT slice acquisition with the respiratory cycle, cine CT scans were acquired during simultaneous monitoring of the respiratory cycle using a pneumotachograph . Comparison of snorers to OSA patients was performed to find distinguishing characteristics between these clinically similar groups . The findings from this study agreed with the previous study showing smaller low retropalatal and retroglossal cross-sectional areas in awake OSA patients compared with snorers ( P <.05) and normal controls ( P <.001) . The greater compliance of the OSA airway was also confirmed with significantly greater changes in upper airway size in OSA patients compared with snorers ( P = .03) and with normal controls ( P = .007) . Significant correlations were found between the minimal airway caliber and the RDI (r = 0.59, P <.0001) and lowest O 2 saturation (r = 0.56, P <.0001). This high degree of correlation suggests that the awake minimal airway caliber is related to the asleep obstructive episodes. With this ability to localize the likely anatomic obstruction, it should be possible to better direct surgical intervention and assess postoperative results in OSA patients. This last hypothesis remains to be proven by a study that uses cine CT with correlation to the respiratory cycle to identify the site of the obstruction and properly direct intervention in a manner to maximize success.
Overall, the CT modalities show that OSA patients possess smaller retropalatal and retroglossal cross-sectional areas, and that OSA patients who have smaller upper airway volumes have a greater response to UPPP. Unfortunately, CT scans provide a poor diagnostic test for distinguishing patients who have OSA from those who have simple snoring caused by the significant overlap in the degree of narrowing of the upper airway. Cine CT findings suggest that greater compliance of the airways contributes to OSA, but further study of this technique is needed to determine its value. In contrast to lateral cephalometric radiographs, the greater anatomic detail of CT scans allows responders to be distinguished from nonresponders to UPPP surgery.
Stay updated, free articles. Join our Telegram channel

Full access? Get Clinical Tree


