Purpose
To evaluate the diagnostic accuracies of swept-source optical coherence tomography (OCT) wide-angle and peripapillary retinal nerve fiber layer (RNFL) thickness measurements for glaucoma detection.
Design
Cross-sectional case-control study.
Methods
In this study we enrolled 144 glaucomatous eyes of 106 subjects and 66 eyes of 42 healthy subjects from the Diagnostic Innovations in Glaucoma Study. Glaucoma was defined by the presence of repeatable abnormal standard automated perimetry results and/or progressive glaucomatous optic disc change on masked grading of stereophotographs. Wide-angle and peripapillary RNFL thicknesses were assessed using swept-source OCT. Peripapillary RNFL thickness was also evaluated using spectral-domain OCT. Areas under the receiver operating characteristic (ROC) curves were calculated to evaluate the ability of the different swept-source OCT and spectral-domain OCT parameters to discriminate between glaucomatous and healthy eyes.
Results
Mean (±standard deviation) average spectral-domain OCT wide-angle RNFL thicknesses were 50.5 ± 5.8 μm and 35.0 ± 9.6 μm in healthy and glaucomatous eyes, respectively ( P < 0.001). Corresponding values for swept-source OCT peripapillary RNFL thicknesses were 103.5 ± 12.3 μm and 72.9 ± 16.5 μm, respectively ( P < 0.001). Areas under the ROC curves of swept-source OCT wide-angle and peripapillary RNFL thickness were 0.88 and 0.89, respectively. Swept-source OCT performed similar to average peripapillary RNFL thickness obtained by spectral-domain OCT (area under the ROC curve of 0.90).
Conclusion
Swept-source OCT wide-angle and peripapillary RNFL thickness measurements performed well for detecting glaucomatous damage. The diagnostic accuracies of the swept-source OCT and spectral-domain OCT RNFL imaging protocols evaluated in this study were similar.
Glaucoma is characterized by progressive loss of retinal ganglion cells with associated structural changes at the level of the optic nerve head (ONH) and retinal nerve fiber layer (RNFL). Considerable evidence has accumulated with regard to the role of structural measurements for diagnosing glaucoma and detecting progression. Structural changes in the ONH and RNFL often are visible before the appearance of detectable loss by means of standard functional testing. Therefore, technologies that can evaluate these structures objectively have become important tools for early diagnosis and for follow-up of the disease.
Optical coherence tomography (OCT) provides objective and reliable structural evaluation of the ONH, RNFL and macula. Compared with earlier time-domain OCT, spectral-domain OCT has improved the ability to detect and monitor glaucoma. More recently, a new generation of OCT, swept-source OCT, has been introduced. These devices use a short cavity swept laser with a tunable wavelength of operation instead of the superluminescent diode laser used in spectral-domain OCT. Deep-range imaging OCT (DRI-OCT-1 Atlantis; Topcon, Tokyo, Japan) is a recently introduced swept-source OCT with a center wavelength of 1050 nm and a sweeping range of approximately 100 nm, compared to the fixed 850 nm wavelength typical of spectral-domain OCT. The instrument also uses 2 parallel photodetectors to achieve a scan rate of 100 000 A-scans per second compared to the 40 000 A-scans per second scanning rate that is typical of spectral-domain OCT devices.
Early studies have demonstrated the ability of swept-source OCT to image deep ocular structures, such as the choroid and lamina cribrosa, as well as the RNFL thickness. In addition, the faster scan speed of swept-source OCT facilitates acquisition of a high-quality wide-angle scan image containing a large area of the posterior pole, including both the optic disc and the macula.
The aim of the present study was to evaluate the ability of average and sectoral RNFL thickness measurements obtained using the swept-source OCT wide-angle and optic disc scans to differentiate glaucomatous eyes from healthy eyes. Diagnostic ability was compared to that of peripapillary RNFL measurements obtained using spectral-domain OCT in the same eyes.
Methods
This was a cross-sectional observational study of participants in the Diagnostic Innovations in Glaucoma Study (clinical trial.gov identifier: NCT00221897 , National Eye Institute) at the University of California, San Diego (UCSD). Diagnostic Innovations in Glaucoma Study is a prospective longitudinal study designed to evaluate optic nerve structure and visual function in glaucoma. Informed consent was obtained from all participants, and the institutional review board (IRB #140276) and human subjects committee at UCSD approved all methods. All study methods adhered to the tenets of the Declaration of Helsinki for research involving human subjects, and the study was conducted in accordance with the regulations of the Health Insurance Portability and Accountability Act.
Methodologic details of the Diagnostic Innovations in Glaucoma Study have been described in detail previously. In brief, at each visit during follow-up, subjects underwent a comprehensive ophthalmologic examination, including review of medical history, best-corrected visual acuity, slit-lamp biomicroscopy, intraocular pressure (IOP) measurement, gonioscopy, dilated fundoscopic examination, stereoscopic optic disc photography, and standard automated perimetry (SAP) using the Humphrey Field Analyzer II (Carl Zeiss Meditec, Dublin, California, USA) and the Swedish Interactive Threshold Algorithm (SITA Standard 24-2). The study included only subjects with open angles on gonioscopy. Subjects were excluded if they presented with best-corrected visual acuities less than 20/40, spherical refraction outside ± 5.0 diopters, cylinder correction outside 3.0 diopters, or any other ocular or systemic disease that could affect the optic nerve or visual field.
All SAPs were evaluated by the UCSD Visual Field Assessment Center. Visual fields with more than 33% fixation losses or false-negative errors, or more than 15% false-positive errors, were excluded, with the exception of visual fields that had more than 33% false-negative errors in advanced disease. SAP tests were defined as normal if the mean deviation (MD) and pattern standard deviation were within 95% normal confidence limits, and the glaucoma hemifield test was also within normal limits. An abnormal SAP test was defined as a visual field with a pattern standard deviation of P < 0.05 and/or a glaucoma hemifield test outside normal limits. Digitized film and digital stereoscopic images were acquired by stereoscopic optic disc photography (Kowa Nonmyd WX3D, v. VK27E, Kowa, Tokyo Japan) and were reviewed for progressive changes by 2 or more experienced graders who were masked to the subjects’ identities and to other test results at the UCSD Optic Disc Reading Center.
Eyes were classified as glaucomatous if they had repeatable (≥2 consecutive) abnormal SAP test results. Eyes were also classified as glaucomatous if they had documented evidence of progressive optic disc changes on masked grading of stereophotographs, with or without abnormal SAP results. Healthy subjects were recruited from the general population through advertisements or from the staff and employees at the UCSD. Healthy subjects had IOPs less than 22 mm Hg with no history of increased IOP and normal SAP in both eyes.
Optical Coherence Tomography
RNFL thickness was assessed from images acquired using the swept-source Deep Range Imaging-OCT (DRI-OCT-1, Topcon). The Deep Range Imaging-OCT is a swept-source OCT device that uses a wavelength-sweeping laser with a center wavelength of 1050 nm and a tuning range of approximately 100 nm; 100 000 A-scans are acquired per second with an 8 μm axial resolution in tissue. For the present study, all eyes were imaged using 2 Deep Range Imaging-OCT scan modes, a wide-angle scan and a 3-dimensional horizontal disc circle grid scan. The Deep Range Imaging-OCT wide-angle 12 × 9 mm used a faster scan setting, with the scan centered on the posterior pole. It was therefore possible to obtain images of the macular and ONH region in a single scan. The 12 × 9 mm scan comprises 256 B-scans, each comprising 512 A-scans for a total of 131 072 axial scans per volume. The total acquisition time was 1.3 seconds per 12 × 9 mm scan.
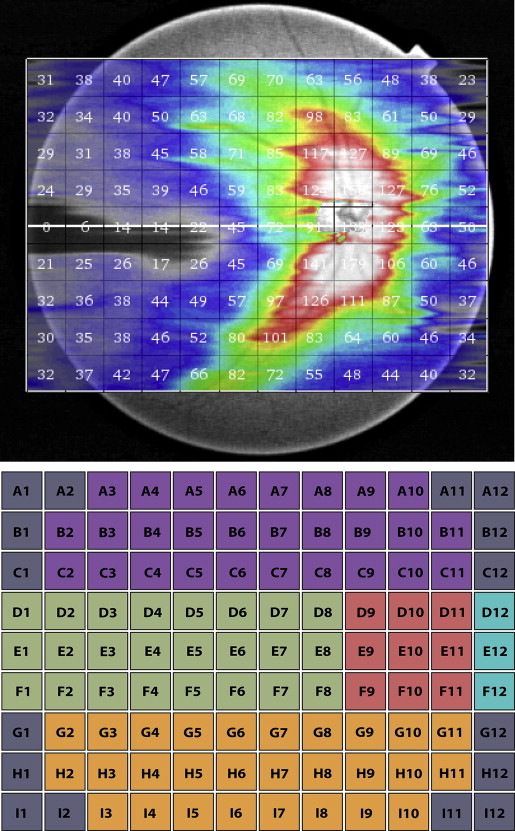
Deep Range Imaging-OCT segmentation software (v 9.12) was used to identify the limits of the RNFL as the area expanding from internal limiting membrane to the inner boundary of the retinal ganglion cell layer, and then the RNFL thickness was determined throughout the scan. Data were exported using the manufacturer’s OCT-Batch (v 4.3.0.118) utility. The quality of each scan and the accuracy of the segmentation algorithm were reviewed independently by masked reviewers (Z.Y. and C.Z.). We excluded 3 eyes from subsequent analyses because their image-quality scores were less than 50. In addition, 41 eyes were excluded due to clipped or poorly focused images or images with segmentation failure and motion artifacts. In a wide-angle scan, the Deep Range Imaging-OCT software calculates the average RNFL for each 1 mm 2 grid square of the 12 × 9 mm scan and allows these data to be displayed and exported. Figure 1 is an example of the graphic output provided by the Deep Range Imaging-OCT, which shows the average RNFL thicknesses in all 108 of the 1 × 1 mm squares of the 12 × 9 mm scan ( Figure 1 , top). For the purposes of this report, the mean RNFL thickness over the entire 12 × 9 mm scan was calculated for each eye (global RNFL thickness). The mean RNFL thicknesses in differing regions of the 12 × 9 mm scans were also analyzed to determine whether a particular quadrant offered better diagnostic ability. After a review of all Deep Range Imaging-OCT wide-angle images in this study, we found that the location of the optic disc varied over an area consisting of the central 9-square area ( Figure 1 , Bottom, red). Thus we removed RNFL measurements from this area. In addition, areas at the 4 corners of the wide-angle scan ( Figure 1 , Bottom, gray: A1, A2, A11, A12, B1, B12, C1, C12, G1, G12, H1, H12, I1, I2, I11, and I12) often fell outside the fundus area from which the image was taken, so RNFL measurements from these 16 squares were removed as well. Results for left eyes were transposed to right eyes. For sectoral analysis, we performed an analysis by quadrants, which were defined as shown in Figure 1 , Bottom. Average RNFL thickness at the periphery of 12 × 9 mm wide-angle scan ( Figure 1 , Bottom, A3–A10, D1, E1, F1, and I3–I10) was also analyzed.
To measure peripapillary RNFL thickness, the Deep Range Imaging-OCT 3D (horizontal) disc circle grid scan utilized the same 131 072 axial scans (512 A-scans for each of 256 B-scans) to acquire images from an area of 6 × 6 mm that is focused on the optic disc. Peripapillary RNFL thickness was then measured by automated placement of a circle 3.4 mm in diameter, centered on the disc. Manual adjustment of circle placement was performed if necessary. This is equivalent to sampling 1024 A-scans along the circle. Average thicknesses of global peripapillary RNFL and superior, inferior, nasal, and temporal quadrants were determined using the same segmentation software (v 9.12).
A Spectralis spectral-domain OCT (software v 5.3.0.7, Heidelberg Engineering, Heidelberg, Germany) RNFL circle scan was also obtained. It consisted of 1536 A-scans with RNFL thickness measurements obtained on a 3.4 mm diameter circle centered on the optic disc. Global and sectoral peripapillary RNFL thickness measurements were calculated. All Spectralis images were reviewed by the UCSD Imaging Data Evaluation and Analysis Center to ensure that the scan was centered, that the signal strength was >15 dB, and that there were no artifacts. Scans that were inverted or clipped and those that had coexistent retinal pathologic abnormalities were excluded. The RNFL segmentation algorithm was also manually adjusted to correct for segmentation errors.
Statistical Analysis
Normality assumption was assessed by inspection of histograms and by using Shapiro-Wilk tests. Student t tests were used for group comparison for normally distributed variables, and Wilcoxon tests were used for non-normally distributed variables. Receiver operating characteristic (ROC) curves were constructed to assess the ability of each parameter to distinguish subjects with glaucoma from healthy controls. A ROC curve is a plot of the true-positive rate vs the false-positive rate for all possible cut-points. The area under the ROC curve was used to summarize the diagnostic accuracy of each parameter. An area under the ROC curve of 1.0 represents perfect discrimination, whereas an area of 0.5 represents chance discrimination. ROC curves were adjusted for age differences between healthy and glaucomatous eyes using an ROC regression model. This method has been described in detail previously. In the following linear regression model, ROCx,x D (q) is the sensitivity at the specificity of 1 − q. X represents the common covariates for healthy and glaucomatous eyes, such as age, and X D represents disease-specific covariates such as disease severity. Φ is the normal cumulative distribution function. Coefficients α1 and α2 are the intercept and slope of the ROC curve.
Stay updated, free articles. Join our Telegram channel

Full access? Get Clinical Tree


