Purpose
To analyze the experience of a large developing country tertiary ophthalmology system to identify generalizable information relevant for those planning similar centers elsewhere.
Design
Retrospective utilization analysis.
Methods
A historical review of the development of the Aravind Eye Care system was undertaken to evaluate the services provided by various tertiary services of the system. Demand for services is inferred based on the utilization statistics described below and distance traveled by patients to obtain services.
Results
Utilization of subspecialty services increased logarithmically for 17 years in all specialties. At all centers except one historically focused on glaucoma, retina services had the highest demand among subspecialty surgical services. The proportion of tertiary care patients among all new outpatients (39% in 2009 and 45% in 2013) and the proportion of specialty surgical and treatment procedures among all procedures (30% in 1997 and 49% 2013) increased over time. More patients traveled long distances (>100 kilometers) to receive specialty services than to receive cataract services (30% vs 23%).
Conclusions
These observations suggest that in regions where tertiary services are not widely available, (1) patients demand (travel further for) tertiary care more than general ophthalmology services; (2) demand for services can expand rapidly for many years; (3) tertiary care services tend to grow over time as a proportion of all services provided; and (4) retina services are the most highly demanded subspecialty surgical services. In such settings, it is likely that considerable latent demand exists; planned tertiary eye centers should anticipate sustained growth of tertiary services.
Eye diseases and visual impairment are very common in developing and less developed countries, affecting up to 20%–25% of the population at any given time. While not all eye conditions require the most advanced treatment facilities, neither can all eye care be addressed by facilities lacking tertiary care expertise and equipment. The concept of primary, secondary, and tertiary levels of care was born out of this observation. Primary eye care would include a basket of services or activities carried out at community level. This could cover 1 or more of the activities such as promoting eye health in the community, screening, case finding and referral, emergency treatment, identifying and referring for rehabilitation those who are already blind, and providing commonly required services like refractive error correction. Depending on the services rendered, the provider of primary eye care could range from a general primary health worker to a well-trained ophthalmic technician. Secondary-level eye care is provided by ophthalmologists and covers comprehensive ocular examination, cataract surgery, simple glaucoma surgery, minor procedures, nonsurgical management of other conditions, and referral to tertiary care for cases that require the attention of subspecialists in ophthalmology and more advanced facilities. Tertiary eye care centers are staffed by subspecialists and have the capability to provide the complete spectrum of eye care services. Tertiary-level centers also offer training and carry out research. When designed and executed properly, this hierarchy in services can ensure both timely and cost-effective treatment, and provides a paradigm intended to ensure that the investments in infrastructure, equipment, and eye care personnel are utilized optimally at all levels. This hierarchical approach has been widely advocated over the last decade since the launch of the global initiative VISION 2020 the Right to Sight, as a valuable design for eye care infrastructure. While the secondary-level centers have been common and primary eye care centers are being set up to reach the unreached, setting up tertiary care centers has been less aggressively pursued, as it requires more investment and trained staff, and there have been uncertainties about the potential demand for such services.
In order to inform future efforts to develop tertiary eye care centers, herein we analyze 17 years’ experience of the tertiary eye care centers of the Aravind Eye Care System, assessing growth of utilization in the various subspecialties over time and demand for services, as indicated by the surrogate of distance traveled to receive care.
Methods
This is a retrospective review of patient data of tertiary eye care centers of the Aravind Eye Care System. Permission has been granted to conduct this retrospective review by the Institutional Ethics Committee of Aravind Medical Research Foundation.
The Aravind Eye Care System operates a network of eye care facilities located in rural villages and towns in the state of Tamilnadu. This network today has 68 care-giving units. Their distribution is across 4 distinct levels: primary eye care centers equipped with low-cost telemedicine technology (n = 51), community outpatient clinics (n = 6), secondary centers (n = 6), and tertiary care centers (n = 5). Primary eye care centers are attached to a secondary or tertiary center, depending on proximity, for tele-consultation and management of referred patients. In addition to fixed centers, extensive outreach programs are organized by each facility in their respective service area.
Aravind hospitals have separate facilities for “paying” and “free” services. Patients choose voluntarily which of these to enter, taking into account their ability to pay. During the study period, paying patients paid INR 40-50 in order to be seen, and higher fees to undergo surgery, ranging from INR 1500 to INR 40 000 (in 2015 the conversion rate to US dollars [$] is roughly INR 61 to 1 US dollar). Free hospital patients are treated without charges except for a $10–$12 fee for all intraocular and postoperative medications. Also, patients are transported from outreach programs for cataract surgery but not tertiary procedures. Most patients coming into the Aravind system through outreach programs elect to receive “free” services, while less than 20% of those referred from primary eye care centers choose to enter the paying hospital. Because services that are paid for reflect demand more comprehensively than highly subsidized “free” services, this report is based only on services received by paying patients.
Data Collection
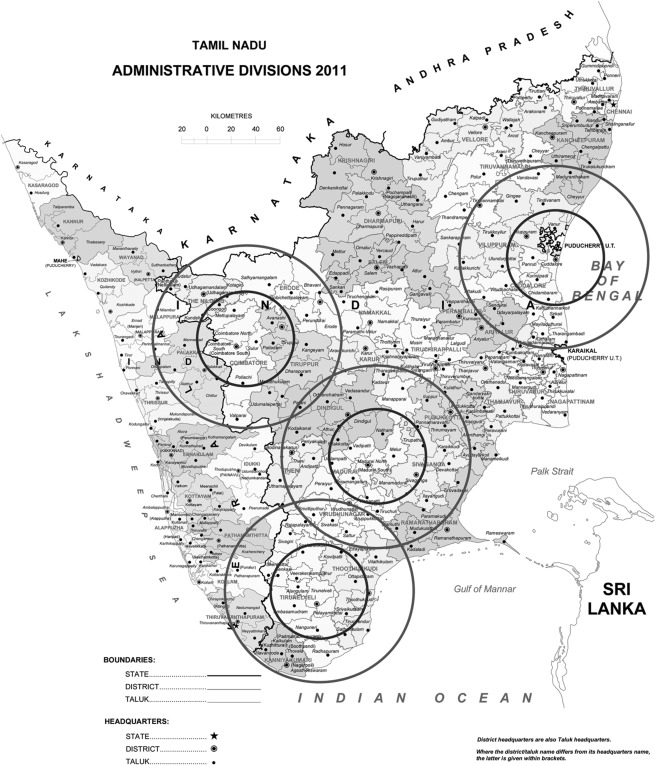
As of 2013, excluding smaller centers and tertiary centers in development, the Aravind Eye Care system had 4 full-scale tertiary eye centers ( Figure 1 ): Madurai, Tamilnadu, South India (founded in 1976); Tirunelveli, Tamilnadu, South India (founded in 1987); Coimbatore, Tamilnadu, South India (founded in 1997); and Pondicherry, Tamilnadu, South India (founded in 2003).
Data were obtained from the Aravind Eye Care System hospital management system database. The Aravind Eye Care System introduced an integrated hospital management system in all its eye care facilities as of 1991 to manage the patient care areas as well as capture key details on medical notes for summarizing patient statistics for management purposes. The system has been improved and was sufficiently robust to capture the information needed for this analysis regarding procedural services from 1997 onward. The system was developed using Microsoft Visual Basic 6 (Microsoft Corporation, Redmond, Washington, USA) with a MS SQL Server 2000 (Microsoft Corporation) at the back end for data storage. This system has been undergoing continuous improvements in order to enhance the utilization and ensure better quality of the data captured. Data regarding inpatient surgical procedures have been robust for over a decade, as these were directly linked to billing databases and included diagnosis-specific information in the form of ICD-9 codes. Robust, system-wide data regarding outpatient services by diagnosis are more recently available. Since 2009, outpatient diagnosis data have been entered immediately after the examination, to improve the quality of the diagnosis data. To ensure quality of this process, at the end of each day a review is conducted to identify missing, wrong, and inconsistent data and corrections are applied.
We analyzed the data of these centers’ paying patient population. Data regarding all the paying patients who received incisional or laser surgical treatment between 1997 and 2013 were extracted from the database and evaluated. Similarly, all paying patients who registered as new patients from 2009 to 2013 (the period for which more accurate diagnosis-specific data were available) were selected and all their diagnoses were included in the database for the analysis. The analysis did not include services performed as a result of outreach and free hospitals, so the results reflect patients presenting for care at their own initiative.
Data Management
The parent administrative database is a comprehensive hospital management system containing data regarding demographics, financials, services offered, diagnosis, and investigations undertaken; treatment details of all the visits are recorded. After the complete review of data and the validation process, specific data required for the study were extracted and exported into a Microsoft Access study database (Microsoft Corporation) and verified for analysis. The dataset was transferred into Stata 11.1 (StataCorp, College Station, Texas, USA) dataset format using Stat/Transfer 7.0 (Circle Systems, Seattle, Washington, USA).
Data Analysis
The analysis is of the actual number of procedural (1997–2013) and outpatient visits (new or follow-up visits, 2009–2013). To bring out the impact of chronic conditions such as glaucoma and diabetic retinopathy on hospital visits, a comparison between new and follow-up visits has been done by each subspecialty including the multiple postoperative visits. The analysis was carried out to evaluate and understand the demand based on (1) the trajectory of utilization/growth of tertiary services over time; (2) the proportion of all cases receiving and paying for tertiary services; and (3) the distance patients traveled to obtain services according to the subspecialty type, as a surrogate for demand for services.
Patients treated for only 1 problem were counted within the subspecialty category into which the problem belonged (eg, procedures for diabetic retinopathy were counted in the retina category). For patients treated for more than 1 problem, if the problems covered more than 1 subspecialty area (eg, procedures for diabetic retinopathy and neovascular glaucoma) they were included in each respective problem’s subspecialty category. However, for patients having more than 1 problem within the same specialty area (eg, procedures for proliferative diabetic retinopathy and retinal detachment), they would only be counted within the 1 subspecialty area. This approach was taken to mimic the number of procedures or visits a patient would require to have the problem(s) treated. Analyses of diagnoses were done with the patient as the unit of analysis. Analysis of treatment was done with the procedure as the unit of analysis (eg, for cataract surgery a procedure is done on an eye, but for strabismus the procedure could be done on 1 or both eyes). Pediatric procedures and diagnoses were defined based on the age of the patient rather than the type of disease category (eg, pediatric glaucoma was counted in the pediatric category rather than the glaucoma category).
In order to analyze the distance traveled for obtaining eye care, we grouped the patients based on the distance between the centers and their residence. The “Near” group lives within a radius of 50 kilometers, “Medium” encompasses a radius between 50 and 100 kilometers, and “Far” covers those who come from beyond 100 kilometers. For 2 of the centers, proximity to the ocean limited the distance that a patient could have traveled to reach the hospital in some directions ( Figure 1 ).
Summary statistics were generated using Stata 11 (StataCorp) to provide necessary results for the study. Statistical significance was not evaluated in this descriptive retrospective study. All the required analyses were done using percentages, proportions, and averages; graphical analyses were done using a log-linear scale for better visibility of comparisons.
Results
Overall about 1.6 million treatment procedures from 4 centers were analyzed ( Table ). These included 722 409 subspecialty procedures by retina, glaucoma, cornea, pediatric, and oculoplasty specialists and 898 269 cataract procedures.
| Center | Retina | Glaucoma | Cornea | Pediatric | Orbit | Cataract |
|---|---|---|---|---|---|---|
| Madurai | 160 078 | 47 073 | 33 268 | 39 060 | 47 058 | 427 971 |
| Tirunelveli | 39 694 | 58 399 | 7575 | 9670 | 13 218 | 156 603 |
| Coimbatore | 107 738 | 28 874 | 22 091 | 17 193 | 15 698 | 220 554 |
| Pondicherry | 39 813 | 10 420 | 10 052 | 6720 | 8357 | 93 141 |
| Total | 347 323 | 144 766 | 72 986 | 72 643 | 84 331 | 898 269 |
General Ophthalmology and Tertiary Eye Care Procedural Services
The analysis of overall volume of surgical and treatment procedures ( Figure 2 ) indicates that the surgical load for all tertiary services experienced continuous growth across all specialties and across all centers. The growth was approximately logarithmic over time. While the cataract surgery volume increased 3-fold from 27 727 to 84 259 at an average growth rate of 7% during this study period, subspecialty procedures generally grew at a faster rate. The volume of retina procedures increased 6-fold from 6295 to 39 879 at an average growth rate of 12%, glaucoma procedures increased 11-fold at an average growth rate of 17%, cornea procedures increased 9-fold at an average growth rate of 16%, oculoplastic procedures increased 4-fold at an average growth rate of 10%, and pediatric procedures increased 4-fold at an average growth rate of 9%, per year. The analysis of procedures done on pediatric cases shows that they quadrupled from 1646 in 1997 to 6437 in 2013. While cataract surgeries grew by 150%, the other subspecialties had a much higher growth rate. In terms of procedure mix, the retina accounted for 18%, glaucoma 5%, cornea 13%, strabismus and others 12%, and orbit 28% of the pediatric procedures in 2013 ( Supplemental Figure , available at AJO.com ).


