Purpose
To correlate partial outer retinal thickness with scotopic and mesopic fundus-controlled perimetry in patients with reticular drusen (RDR).
Design
Observational case series with controls of similar age.
Methods
Twenty eyes from 18 patients with RDR (mean age 75.8 years) and 20 eyes from 20 healthy controls (mean age 75.5 years) were included. Scotopic and mesopic fundus-controlled perimetry was performed in patients. The localized partial outer retinal thickness at the site of test stimuli was determined as the distance between the outer border of the outer plexiform layer and the inner border of the ellipsoid zone and topographically corrected according to measurements in controls.
Results
The mean partial outer retinal thickness in patients was 65.8 μm over areas with RDR and 76.4 μm ( P < .0001) over nonaffected retinal areas. Mesopic and scotopic sensitivity were reduced corresponding to areas with RDR (mean scotopic 12.8 dB and mean mesopic 17.2 dB) as compared to nonaffected retinal areas (18.2 dB and 18.4 dB) ( P < .001, P = .001). On average, a reduction of partial outer retinal thickness by 1 μm was associated with a decrease of scotopic function of 0.96 dB.
Conclusions
The extent of outer retinal thinning in the presence of RDR is spatially associated with the extent of impairment in scotopic retinal function, indicating a direct structural-functional correlation of structural changes to loss of rod function. High-resolution retinal imaging in combination with scotopic fundus-controlled perimetry allows for a more refined structure-function correlation in diseases with a presumed higher vulnerability of rod compared with cone function.
Age-related macular degeneration (AMD) is the most common cause of legal blindness in industrialized countries [reviewed by ]. Visual impairment under dark-adapted conditions and decreased vision in dim light conditions (eg, when reading) represent 2 of the first symptoms of the disease. Impaired dark adaptation in subjects with AMD was already reported in the 1980s and has been later correlated to the presence of typical AMD features such as large drusen and focal abnormalities of fundus autofluorescence intensities. However, only a poor topographic correspondence between morphologic changes and levels of scotopic dysfunction has been reported.
“Pseudodrusen visible en lumière bleu” have been initially described by Mimoun and associates as a phenotypic feature in eyes with AMD. The authors distinguished these drusen from soft, hard, calcified, and cuticular drusen. Various terms have been introduced since then, including “reticular pattern,” “reticular pseudodrusen,” “reticular macular disease,” and “subretinal drusenoid deposits” [reviewed by ]. With the use of en face imaging, reticular drusen (RDR) are characterized by a network of oval or roundish lesions with a diameter of approximately 125–250 μm, whereas SDOCT imaging shows irregular, focal elevations anterior to the retinal pigment epithelium up to the level of the ellipsoid zone, occasionally also penetrating as spikes through the external limiting membrane (ELM) toward the more inner retina. Using confocal scanning laser ophthalmoscopy (cSLO) imaging, RDR can be frequently observed in patients with AMD (up to 62%). In addition, RDR represent a risk factor for AMD progression and the development of late AMD.
Using electrophysiology and fundus-controlled perimetry, retinal dysfunction has been spatially correlated to the RDR presence. Flamendorf and associates have recently reported that dark adaptation is severely impaired in patients with RDR, measuring the rod intercept time with a dark adaptometer. We have shown that not only mesopic but also particularly scotopic retinal sensitivity loss is observed at the site of RDR areas, suggesting that particularly rod function is severely affected in the presence of RDR. In this latter publication, we used the term “photopic” for testing under light-adapted conditions by using a background luminance of 1.27 cd/m 2 . As we have now learned, this setting generates a mixed cone and rod response and should rather be called “mesopic” testing. Therefore, we have adjusted the terminology in the current publication to “mesopic” testing.
Although the exact morphologic correlate of RDR lesions by histopathology and the pathophysiological pathways that lead to the development of RDR lesions are still unknown, it appears conceivable that the observed localized loss of retinal sensitivity is spatially confined to photoreceptor cell loss. In the current study, we hypothesized not only that the visualization of RDR lesions by en face cSLO imaging is spatially correlated to localized loss of retinal sensitivity, but also that functional loss in these areas would also be associated with thinning of the outer retina and particularly that the extent of functional loss is correlated to the extent of reduction of partial outer retinal thickness. This hypothesis was based on 3 aspects. First, a decrease in the thickness of the outer nuclear layer (ONL) or the number of photoreceptor cell nuclei is a well-established model for retinal damage that goes along with functional impairment, as measured by electrophysiology in the animal model. Second, Spaide introduced the term “outer retinal atrophy” in the context of RDR occurrence. He reported a reduced outer retinal thickness at the site of RDR areas. Furthermore, he supposed that RDR lesions may become confluent and regress over time, associated with thinning of the outer retina with loss of function. Third, in vivo SDOCT and adaptive optics imaging of patients with retinitis pigmentosa showed a correlation of ONL thickness and cone density.
The aim of this study was a refined structure-function analysis of RDR areas by correlating partial outer retinal thickness with both mesopic and scotopic function as measured by fundus-controlled perimetry.
Methods
Participants
Subjects with reticular drusen in the presence of AMD (“patients”) and participants of similar age without ocular diseases (“controls”) were recruited for this observational case series from the outpatient clinic at the Department of Ophthalmology, University of Bonn. The study protocol complied with the Declaration of Helsinki and was approved by the local ethics committee (Ethik-Kommission, Medizinische Fakultät, Rheinische Friedrich-Wilhelms-Universität; Lfd. Nr. 125/14) prior to enrollment of subjects. Informed written consent was obtained from each subject after explanation of the study’s nature and possible consequences of participation.
For inclusion, patients had to be diagnosed with early or intermediate AMD, according to the classification system proposed by Ferris and associates. Only participants with stable fixation and clear media in at least 1 eye to allow central visual function testing and retinal imaging were enrolled in the study.
RDR were characterized as a group of hyporeflective dots, targets, or a ribbon pattern in cSLO infrared reflectance (IR) images and as hyperreflective mounds above the RPE in SDOCT images.
For inclusion in the current study, a clearly distinguishable area with RDR encompassing the size of at least 2 disc areas had to be present. This RDR area had to be at least partly surrounded by retinal areas that did not show any pathologic alterations (“nonaffected retina”). Any other early or intermediate AMD-related pathologic characteristics such as drusen or pigmentary changes could be adjacent to the RDR area and present within the central 20 × 20-degree field. If suitable, both eyes of a patient were included.
Exclusion criteria were any signs of late AMD, such as geographic atrophy or choroidal neovascularization. Patients with vascular or inflammatory retinal pathologies, glaucoma, or history of retinal or refractive surgery or laser treatment were excluded. For controls, no signs of any ocular diseases, including retinal pathologies or dense cataract, could be present. In accordance with the classification by Ferris and associates, controls had “no apparent aging changes”—that is, no AMD pigmentary abnormalities and no drusen, including small drusen (“druplets”). Exclusion criteria for both patients and controls were refractive errors > ±3 diopters (D) spherical equivalent (SE). All subjects underwent a complete ophthalmologic examination, including visual acuity assessment, slit-lamp examination, and fundus biomicroscopy.
Retinal Imaging
Retinal imaging was performed according to standardized operating procedures. After dilation of the pupils with 1.0% tropicamide and 2.5% phenylephrine, high-speed combined and simultaneous confocal scanning laser ophthalmoscopy (SLO) and SDOCT imaging (768 × 768 pixel) was performed with the Spectralis HRA+OCT (Heidelberg Engineering, Heidelberg, Germany) device. The imaging protocol included single horizontal and vertical combined IR cSLO + SDOCT scans through the fovea (30 degrees, automated real time mode at least 15 scans) and a dense raster scan (30 × 25 degrees centered on the fovea, automated real time mode at least 4 frames, 61 B-scans, distance 120 μm) ( Figure 1 , Upper left).
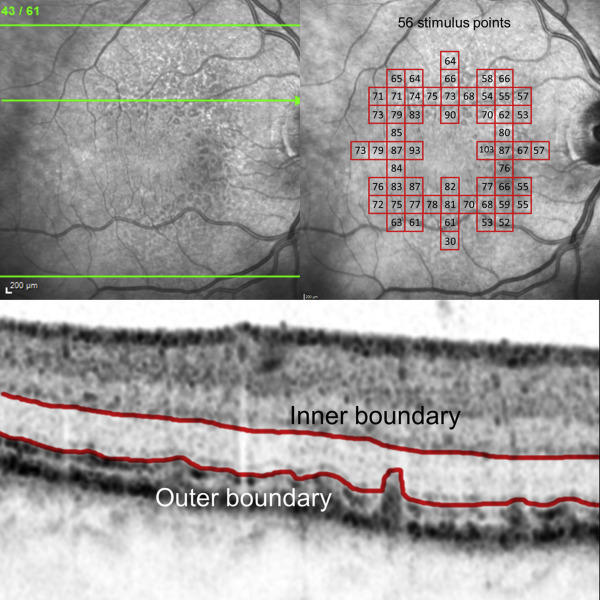
Analysis of Partial Outer Retinal Thickness
The thickness of the outer retina was defined as the hyporeflective zone in between the hyperreflective outer border of the outer plexiform layer (OPL; inner boundary) and the hyperreflective inner border of the ellipsoid zone (outer boundary). If the ellipsoid zone was not clearly distinguishable or if individual RDR focally penetrated the ELM, the outer boundary was defined by the inner edge of the accumulated hyperreflective RDR material ( Figure 1 , Bottom). Using this definition, we aimed to determine the vertical extension of photoreceptors in the presence of RDR lesions as closely and accurately as possible using current SDOCT imaging technology. Of note, the inner part would not be represented by the photoreceptor cell nuclei alone but also by the Henle fiber layer, which cannot be clearly distinguished from the ONL (at least in a standardized manner over large areas within 1 dense raster scan). We also avoided selecting the band of the ELM or any band below the ellipsoid zone, such as the band of the RPE/Bruch membrane, as the outer boundary, because RDR lesions may typically penetrate to the former and the latter bands are usually hardly visible in the presence of RDR lesions, making it also challenging to distinguish between accumulation of abnormal material and photoreceptor segments.
For measurements, the automated segmentation of the Heidelberg Eye Explorer (Heidelberg Engineering, Heidelberg, Germany) in each of the 61 B-scans for each study eye was carefully reviewed. In case of incorrect automated segmentation, the OPL segmentation was manually corrected (= inner boundary). For the outer boundary, the segmentation of the ELM was manually shifted toward the hyperreflective inner border of the ellipsoid zone or toward the inner edge of the RDR pattern.
Fundus-Controlled Perimetry
Fundus-controlled perimetry was performed in patients as previously described, using the Nidek MP-1S (Nidek Technologies, Padova, Italy). Briefly, mesopic testing was conducted under light-adapted conditions using a pattern of 56 stimuli centered on the fovea (Goldmann size III, 200 ms, 4-2 strategy, background luminance 1.27 cd/m 2 , ring with a 3-degree radius and 1-pixel thickness as fixation target). For scotopic testing, all subjects—following dark adaptation for 30 minutes—underwent a filter selection examination for establishment of the individual appropriate neutral density filter. Then, at least 2 main examinations of the central retina using the same pattern with 56 stimuli points as used for mesopic testing (Goldmann size V, 200 ms, 4-2 strategy, background luminance 0.0032 cd/m 2 ) were carried out. For the current analysis, only subjects with the 1.0 log unit neutral-density filter and with a mean difference of all stimuli points ≤3 dB between 2 examinations were included ( Figure 1 , Upper right).
Spatial Structural-Functional Correlation of Fundus-Controlled Perimetry Test Stimuli to the Localized Thickness of Parts of the Outer Retina
The currently available version of the Heidelberg Eye Explorer software allows the generation of thickness maps encompassing an area of 2 × 2 degrees using a grid with a total size of 20 × 4 degrees (ie, this grid is subdivided into 20 individual fields). According to an estimation, we assumed that the square area of 2 × 2 degrees would correspond to the circle of the Goldmann V stimulus (diameter 1.7 degrees). Using the fovea as orientation, the 20 × 4-degree grid was manually shifted several times in order to measure the localized thickness of the outer retina at the position of each of the 56 stimuli as placed by the fundus-controlled perimetry examinations.
Statistical Analysis
Using the measurements in controls, normal topographic variations in partial outer retinal thickness were determined. These results were used for the analysis of any localized outer retinal thickness changes in patients. Thereby, the topographically corrected partial outer retinal thickness at the site of each of the 56 measurement points was compared between the area with RDR and the nonaffected retinal areas within the same eye.
Structural-functional correlations of the partial outer retinal thickness and the scotopic and mesopic sensitivity values were performed. Statistical analysis was conducted using mixed linear model analysis to account for multiple measurements, but did not control for dependencies of the paired eyes of the 2 included patients. Since the thickness of the outer retina was variable over the measured region and RDR were mainly located in the superior part of the eye, we were not able to estimate the effect of RDR on the outer retina directly from the patient’s data. Therefore, we first fitted a spatial model (with linear and quadratic terms in horizontal and vertical directions) to the partial outer retinal thickness in the control eyes to be able to correct for the spatial variations in the patient’s eyes. Scotopic and mesopic sensitivities were correlated with partial outer retinal thickness, spatial location, and the presence of RDR using mixed linear models.
Results
Demographics
Twenty eyes of 18 patients (mean age: 75.8 years; interquartile range [IQR] [70.6; 81.5]; range, 62–87 years; 11 female, 8 pseudophakic) and 20 eyes of 20 controls (75.5 years; IQR [69.8; 79.1]; range, 68–89 years; 12 female, 2 pseudophakic) were included. The median visual acuity was 20/25 Snellen (range, 20/40 to 20/20) for patients and 20/20 (range, 20/25 to 20/20) for controls. Within the group of patients, 8 eyes were classified as early AMD and 12 eyes as intermediate AMD.
Partial Outer Retinal Thickness
A mean number of 34.1 measurement points (95% confidence interval [CI] [25.50; 45]; range, 7–49) were spatially confined to areas with RDR as seen by SDOCT imaging, while a mean number of 19.8 measurement points (95% CI [11.0–29.5]; range, 3–37) were restricted to nonaffected retinal areas. Other measurement points were associated with other AMD-related pathologic alterations, such as soft drusen or pigmentary changes. These latter areas were not included in the following analysis.
In patients with RDR, there was a trend toward an overall thinner partial outer retinal thickness (mean 69.7 μm [95% CI, 67.1–72.3]) as compared to controls (mean 73.0 μm [95% CI, 57.3–88.7], P = .167). Within affected eyes, partial outer retinal thickness (uncorrected) was decreased over areas with RDR (mean 67.4 μm [95%C I, 65.0–69.8]) as compared to nonaffected retinal areas (mean 74.5 μm [95% CI, 72.0–77.1], P < .0001).
In controls, measurements of partial outer retinal thickness revealed a topographic association with a relative increase toward the center of the retina, in accordance with previous reports (eg, ) ( Figure 2 ). In patients, following spatial correction of the normal topographic variations, the relative reduction of partial outer retinal thickness (corrected) over RDR areas (mean 65.8 μm [95% CI, 63.0–68.6]) was even more pronounced as compared to nonaffected retinal areas (mean 76.4 μm [95% CI, 74.2–78.5], P < .0001, Figure 3 ).
Further statistical analysis revealed a mean relative reduction of partial outer retinal thickness of 10.1 μm owing to the presence of RDR ([95% CI, 9.1–11.1], P < .0001). These effects were more pronounced toward superior areas and less pronounced in other eccentric areas.
Structure-Function Correlation
In patients, scotopic sensitivity in retinal areas with RDR (mean 12.8 ± 3.3 dB [range, 7–18]) was reduced as compared to nonaffected areas (18.2 ± 2.2 dB [range, 13–20]) ( P < .001). Analysis of the mesopic sensitivity also revealed a reduction in sensitivity in areas with RDR (17.2 ± 2.5 dB [range, 9–20]) as compared to nonaffected areas (18.4 ± 2.5 dB [range, 10–20]) ( P = .001). Statistical modeling of the influence of partial outer retinal thickness in patients’ eyes, corrected for the spatial location and the presence of RDR, showed a correlation between thinning of partial outer retinal thickness and scotopic dysfunction. Hereby, a decrease of 1 μm led to a decrease of scotopic function of 0.96 dB. For mesopic testing the statistical model revealed no evidence ( P = .364) for a direct correlation (ie, there was no additional impact of partial outer retinal thickness on function, beyond the correlation of the thickness to spatial location and RDR).
With increasing age, scotopic function was decreased by 0.035 dB/year. No differences were observed by sex. Two representative eyes are shown in Figures 4 and 5 .


