Purpose
To compare corneal sensitivity in tear dysfunction due to a variety of causes using contact and noncontact esthesiometers and to evaluate correlations between corneal sensitivity, blink rate, and clinical parameters.
Design
Comparative observational case series.
Methods
Ten normal and 33 subjects with tear dysfunction (meibomian gland disease [n = 11], aqueous tear deficiency [n = 10]—without (n = 7) and with (n = 3) Sjögren syndrome (SS)—and conjunctivochalasis [n = 12]) were evaluated. Corneal sensitivity was measured with Cochet-Bonnet and air jet esthesiometers and blink rate by electromyography. Eye irritation symptoms, tear meniscus height, tear break-up time (TBUT), and corneal and conjunctival dye staining were measured. Between-group means were compared and correlations calculated.
Results
Compared with control (Cochet-Bonnet 5.45 mm, air esthesiometer 3.62 mg), mean sensory thresholds were significantly higher in aqueous tear deficiency using either Cochet-Bonnet (3.6 mm; P = .003) or air (11.7 mg; P = .046) esthesiometers, but were not significantly different in the other groups. Reduced corneal sensitivity significantly correlated with more rapid TBUT and blink rate and greater irritation and ocular surface dye staining with 1 or both esthesiometers. Mean blink rates were significantly higher in both aqueous tear deficiency and conjunctivochalasis compared with control. Among all subjects, blink rate positively correlated with ocular surface staining and irritation and inversely correlated with TBUT.
Conclusion
Among conditions causing tear dysfunction, reduced corneal sensitivity is associated with greater irritation, tear instability, ocular surface disease, and blink rate. Rapid blinking is associated with worse ocular surface disease and tear stability.
Tear dysfunction is a prevalent disorder caused by decreased tear production, excessive evaporation, or an altered distribution. Patients with tear dysfunction often experience irritation symptoms such as dryness, foreign body sensation, and burning ; however, paradoxically, certain patients with moderate to severe ocular surface disease have a paucity of irritation symptoms. Patients with tear dysfunction may also complain of blurred and fluctuating vision, photophobia, and frequent blinking. Increased frequency of blinking has been previously noted in patients with tear dysfunction ; however, the factors contributing to the increased blink rate have not been established and may be influenced by the source of tear dysfunction. Studies evaluating tear dysfunction following laser in situ keratomileusis (LASIK) have reported a decrease in blink rate. Although LASIK is known to cause corneal hyposensitivity that is often transient, no reduction in corneal sensitivity was found in 1 study, while hyperesthesia was measured in subjects with concurrent dry eye disease after LASIK.
Tear instability and epithelial disease can disrupt corneal epithelial barrier function, which can affect corneal sensitivity and nerve morphology. Studies measuring corneal sensitivity in dry eye by contact and noncontact methods have reported conflicting results, with either increased, decreased, or no change in sensitivity. However, none of these previously reported studies stratified dry eye subjects by cause of tear dysfunction. Because corneal epithelial disease is more severe in aqueous tear deficiency than in meibomian gland disease and conjunctivochalasis, we hypothesized there may be differences in corneal sensitivity and blink rate between these subsets of tear dysfunction that may be related to severity of ocular surface epithelial disease. To our knowledge, corneal sensitivity and blink rate have not been compared between these distinct subsets of tear dysfunction. Evaluating corneal sensitivities among different subsets of tear dysfunction may prove to be important for stratifying patients for clinical trials, for determining the cause for ocular irritation/pain symptoms, and perhaps for making treatment recommendations. Furthermore, the relationship between sensitivities and blink rate may provide insight into the mechanisms for increased blinking in dry eye. Testing corneal sensitivity in defined subsets of tear dysfunction may help to explain the conflicting results of previous studies that have reported both corneal hyposensitivity and hypersensitivity findings.
The objective of this study was to compare corneal sensitivity using contact and noncontact methods in 3 common subtypes of tear dysfunction (aqueous tear deficiency, meibomian gland disease, and conjunctivochalasis). The relationship between corneal sensitivity and irritation symptoms, blink rate, and clinical parameters was also assessed.
Methods
Study Oversight
The institutional review board (IRB) at Baylor College of Medicine approved the study protocol to conduct clinical assessments in a prospective manner in which normal, non–dry eye subjects and those with tear dysfunction were enrolled for research participation after written informed consent. No retrospective IRB approval was necessary. Our study complies with the Health Insurance Portability and Accountability Act.
Study Design
Data for this comparative observational case series were collected from April 1, 2012 to June 1, 2014 at the Alkek Eye Center at Baylor College of Medicine, Houston, Texas. Subjects underwent a standardized tear and ocular surface evaluation, in the following order, that included anterior segment optical coherence tomography (OCT) as a measure of tear production and volume, respectively; fluorescein tear break-up time (TBUT) as a measure of tear stability; and corneal fluorescein and conjunctival lissamine green dye staining as measures of ocular surface epithelial cell health. Corneal and conjunctival dye staining with fluorescein and lissamine green, respectively, were performed and graded as previously reported. Severity of eye irritation symptoms was measured using validated questionnaires, including the Ocular Surface Disease Index (OSDI) and a 5-question visual analog scale (VAS). After standard clinical tests were performed, corneal sensitivity was measured by both Cochet-Bonnet and air jet esthesiometers, and blink rate was measured using electromyography (EMG) with signals detected by the NeuroSky MindBand Bluetooth device (NeuroSky, Silicon Valley, California, USA). Data from only 1 eye (with the worst corneal fluorescein staining) for each subject, and the right eye for normal control subjects, were included in the data analysis.
Subjects
Thirty-three subjects with tear dysfunction were classified into the following groups: aqueous tear deficiency, meibomian gland disease, and conjunctivochalasis (according to criteria listed in Table 1 ). The classifications were based on an OSDI score >20, TBUT <7 seconds, tear meniscus height measured by OCT, and the presence (or absence) of meibomian gland disease and conjunctivochalasis.
| Group | OSDI | TBUT ≤7 Seconds | Meibomian Gland Disease | TMH (μm) |
|---|---|---|---|---|
| Meibomian gland disease | >20 | + | + | >220 |
| Aqueous tear deficiency | >20 | + | − | <220 |
| Conjunctivochalasis | >20 | + | − | CC |
| Normal | ≤20 | − | − | >220 |
Normal control subjects had an OSDI score ≤20, no history of contact lens or eye drop use, or prior ocular surgery. They also had a TBUT ≥8 seconds and absence of fluorescein and lissamine green staining, meibomian gland disease, and conjunctivochalasis on biomicroscopic examination.
Subjects were excluded if they had prior LASIK or corneal transplantation surgery, cataract surgery in the past year, punctal occlusion with plugs or cautery, a history of contact lens wear, use of topical medications other than preservative-free artificial tears, or chronic use of systemic medications known to reduce tear production. In addition, subjects were excluded if they had active ocular surface or corneal inflammation, infection, or eyelid disorders causing exposure of the ocular surface. Seventy-one patients were excluded owing to these criteria.
Subjects were recruited from patients presenting to the corneal service at the Alkek Eye Center and employees of Baylor College of Medicine.
Optical Coherence Tomography
OCT measurement of the height of the lower tear meniscus was performed as described previously. All subjects underwent cross-sectional imaging of the lower tear meniscus prior to the instillation of drops or measurement of clinical parameters.
Fluorescein Tear Break-up Time and Corneal Fluorescein Staining
TBUT was measured by instilling fluorescein into the lower fornix with a fluorescein strip (BioGlo; HUB Pharmaceuticals, Rancho Cucamonga, California, USA) wetted with preservative-free saline (Unisol; Alcon, Fort Worth, Texas, USA). The patient was allowed to blink at a spontaneous rate, and the elapsed time from the last blink to the appearance of the first break in the continuous layer of fluorescein, as observed under cobalt blue light through a yellow filter, was measured in seconds. Three separate measurements were taken, as previously described. Corneal fluorescein staining was graded 0–6 in each of 5 zones (inferior, nasal, temporal, central, and superior) 1 minute after fluorescein instillation, as previously reported.
Conjunctival Lissamine Staining
The ocular surface was examined under white light illumination 1 minute after touching the inferior tarsal conjunctiva with a lissamine green strip (Green Glo 1.5 mg lissamine green; HUB Pharmaceuticals) wetted with preservative-free saline. Staining was graded on a scale of 0–3 in the exposed nasal and temporal bulbar conjunctiva with a total maximum score of 6, as previously reported.
Corneal Sensitivity
Corneal sensitivity was measured by both Cochet-Bonnet and air esthesiometer. A Cochet-Bonnet esthesiometer with a 0.12 mm nylon monofilament touched the center of the corneal surface at a perpendicular angle under illumination. Both eyes of each patient were tested. Patients were asked to indicate when they perceived touch. The longest length of 6.0 cm was used first, which corresponds to greater sensitivity. The thread length was decreased by 1.0-cm increments and the measurement repeated until sensation was felt. Once the patient indicated sensation, the thread was then increased by 0.5 mm to obtain a final reading to the closest 0.5 mm.
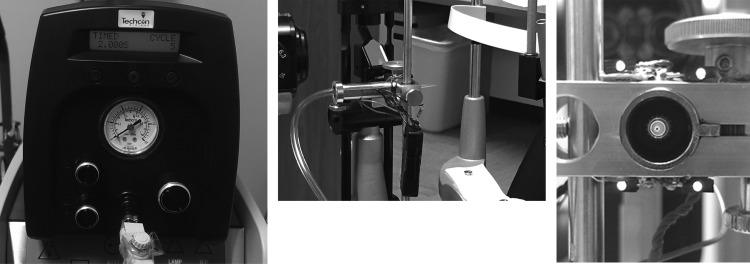
An air esthesiometer was used to evaluate corneal sensation with a noncontact method. Briefly, the prototype esthesiometer ( Figure 1 ) is composed of a cylinder of medical-grade compressed air that is connected via a unidirectional pressure regulator adjusted to 3 psi and inline filter to the OK International DX-255 Basic Digital Fluid Dispenser (OK International, Garden Grove, California, USA), which outputs the air stimulus at a given pressure over a period of 2 seconds when its foot pedal is depressed. The air then travels through a hose line, in which the final flow of gas is adjusted with a flow meter and supplied to a 200 μL pipette tip with an internal diameter of 0.457 mm. The pipette tip is attached to the end of the hose and secured on a calibrated movable mount. The apparatus is attached to a stand that can be directly mounted on a Haag-Streit slit lamp (Haag-Streit, Köniz, Switzerland). The mount housing has 4 red light-emitting diodes (LEDs) centered around the pipette tip to aid in aligning the outflow stream with the center of the subject’s cornea. During stimulation, the air stimulus was triggered by a foot pedal pressed by the investigator. The average temperature of the air released by the tip was 28 C.
To measure corneal sensitivity, subjects were seated in front of the esthesiometer tip that was positioned 5 mm away from the center of the cornea using a knob on the movable mount. The air stimulus was applied by tapping the foot pedal that triggered an audible click by the air valve, indicating the onset of the 2-second pulse stimulus. Subjects were informed that the air stimulus might be perceived as a “breeze-like” sensation beforehand. The force of the air stimulus was controlled by a second knob calibrated in 45-degree increments that was turned each time the stimulus was not detected. Subjects were asked to report the presence or absence of sensation and to describe the sensation immediately after hearing the audible click. Subjects were instructed to blink between clicks, and the lowest detectable stimulus that elicited a response was recorded as the mechanical threshold. When a response was detected, the experimenter dialed back the knob by 45 degrees to lower the stimulus intensity and confirm the number of turns necessary to elicit the threshold stimulus. The force of the air stimulus was measured in mass (grams).
Blink Rate Measurement
Blink rate was measured using EMG signals detected by the NeuroSky MindBand Bluetooth device (NeuroSky). The MindBand was placed on the subject’s forehead and the dry electrodes on the MindBand measured the changing electrical potential of the orbicularis muscles during blinks.
The threshold for detecting a blink was set prior to recording the patient’s average blink rate per minute and was adjusted for each individual. Subjects were asked to look straight ahead, in a relaxed manner, without any additional activity for 5 minutes. Patients were asked to avoid speaking, moving extremities, or making facial expressions. Excessive movements during the measurement period were excluded from the data analysis, and only blink rates from minutes 2–4 were used for calculations. Blinks were measured and recorded as blinks/minute. The blink count readings were verified by manual blink counting for each patient.
Testing was performed in the following order: measurement of tear meniscus height by OCT, blink rate measurement, corneal sensitivity by air esthesiometer, TBUT, corneal fluorescein and conjunctival lissamine green staining, and corneal sensitivity by Cochet-Bonnet.
Data Analysis
The data were analyzed using GraphPad Prism 6.0 (GraphPad Software, La Jolla, California, USA). Normality distribution of data sets was determined using the D’Agostino-Pearson normality omnibus test. Many, but not all, of our parameters were normally distributed; thus both parametric (Pearson correlation coefficient and analysis of variance [ANOVA]) and nonparametric tests (Spearman rank correlation coefficient, Mann-Whitney, and Kruskal-Wallis test) were performed. Because the results of parametric and nonparametric tests were similar, the mean values of corneal sensitivity, blink rate, and clinical parameters were compared between tear dysfunction subtypes and control group using ANOVA. All data sets included measurements from interval scales, so the Pearson correlation coefficient (R) was calculated to assess the relationship between corneal sensitivity and irritation symptoms, blink rate, and clinical parameters within the entire tear dysfunction group and within each subtype. A P value of ≤.05 was considered to be statistically significant.
Results
Study Population
The demographic features for control and tear dysfunction subjects are presented in Table 2 . Age ranged from 30 to 85 years (61.82 ± 12.77 [mean ± standard deviation]) in the 33 tear dysfunction subjects and from 25 to 79 years (47.4 ± 21.69 [mean ± standard deviation]) in the 10 control subjects. There was a statistically significant difference in age between all tear dysfunction (61.82 years) and control (47.4 years) subjects ( P = .006), and between conjunctivochalasis (66.92 years) and controls (47.4 years) ( P = .004). There was no difference in age between either meibomian gland disease or aqueous tear deficiency and the control group and there was no statistically significant difference in mean age between the tear dysfunction groups.
| Groups | N (Subjects) | Age (y), Mean ± SD | Age Range |
|---|---|---|---|
| Normal | 10 | 47.40 ± 21.69 | 25–79 |
| All tear dysfunction | 33 | 61.82 ± 12.77 | 30–85 |
| Meibomian gland disease | 11 | 60.09 ± 11.73 | 45–85 |
| Aqueous tear deficiency | 10 | 57.60 ± 17.56 | 30–80 |
| Conjunctivochalasis | 12 | 66.92 ± 6.65 | 54–77 |
Mean Value Comparisons for Corneal Sensitivity
For each group, the mean and standard deviation values for corneal sensitivity measured with both methods, clinical parameters of tear function, ocular surface disease, and blink rate are shown in Table 3 . When compared with the mean corneal sensitivity threshold in the control group using the Cochet-Bonnet (5.450 mm; 95% confidence interval [CI] = 4.86–6.04 mm), there was a significantly higher threshold in the aqueous tear deficiency group (3.6 mm; CI = 2.42–4.78 mm; P < .003). When compared with the mean threshold in the control subjects using the air esthesiometer (3.62 mg), there was also a significantly higher threshold in the aqueous tear deficiency group (11.7 mg; CI = 2.18–21.2 mg; P = .046).
| Group | Cochet-Bonnet | AJE (g) | TBUT (s) | K FL | C LG | OCT TMH (mm) | OSDI | Blink Rate (Blinks/Min) |
|---|---|---|---|---|---|---|---|---|
| Normal | 5.45 ± 0.832 | 0.004 ± 0.004 | 9.8 ± 0.633 | 0 | 0 | 330.2 ± 161.7 | 14.25 ± 4.713 | 14 ± 6.481 |
| All tear dysfunction | 4.906 ± 1.45 | 0.008 ± 0.009 | 3.632 ± 2.06 a | 3.303 ± 4.405 | 2.455 ± 2.209 a | 309.3 ± 323.4 | 34.53 ± 10.65 a | 28.37 ± 16.88 |
| Meibomian gland disease | 5.7 ± 0.538 d | 0.006 ± 0.008 | 3.455 ± 1.214 a | 3.636 ± 5.065 | 1.455 ± 1.695 d | 289.5 ± 57.56 | 34.0 ± 11.09 a | 18 ± 15.61 |
| Aqueous tear deficiency | 3.6 ± 1.647 a , b , c , e | 0.012 ± 0.013 a | 3.044 ± 1.676 a | 6 ± 4.714 a , e | 4.3 ± 1.889 a , b , c , e | 171.5 ± 40.98 a | 30.20 ± 6.779 a | 37.18 ± 17.58 a |
| Conjunctivochalasis | 5.333 ± 1.073 d | 0.007 ± 0.006 | 4.286 ± 2.809 a | 0.75 ± 1.055 d | 1.833 ± 2.038 d | 486.8 ± 559.7 | 39.0 ± 12.08 a | 27.44 ± 14.19 a |
a Statistically significant difference ( P ≤ .05) compared to normal.
b Statistical significance compared to all subjects.
c Statistical significance compared to meibomian gland disease.
d Statistical significance compared to aqueous tear deficiency.
Correlation Between Cochet-Bonnet and Air Jet Esthesiometers
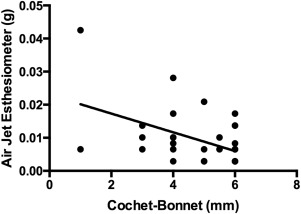
A significant correlation between our prototype air esthesiometer and the Cochet-Bonnet was found for dry eye subjects (r = −0.512; CI = −0.730 mm to −0.199 mm; P < .001). In addition, there was significant correlation between our air esthesiometer and the Cochet-Bonnet for all subjects (r = −0.545; CI = −0.721 mm to −0.275 mm; P < .001) ( Figure 2 ).
Mean Values Comparison for Blink Rate
When compared with mean blink rate in the control group (14 blinks/min; CI = 9.02–19.0 blinks/min), significantly higher mean blink rates were measured in both the aqueous tear deficiency group (37.18 blinks/min; CI = 22.5–51.9 blinks/min; P = .001) and conjunctivochalasis group (27.44 blinks/min; CI = 16.5–38.3 blinks/min; P = .01). There was no significant difference in blink rate between meibomian gland disease (18 blinks/min; CI = 1.52–34.4 blinks/min; P = .250) and control.
Correlations Between Corneal Sensitivity, Blink Rate, and Clinical Parameters
The correlations between corneal sensitivity, blink rate, and clinical parameters are presented in Tables 4 and 5 . Reduced corneal sensitivity with the Cochet-Bonnet esthesiometer was significantly correlated with more rapid TBUT, ocular surface dye staining, and blink rate, while reduced sensitivity with the air esthesiometer correlated with more rapid TBUT, irritation symptoms measured by the OSDI, and blink rate. In addition, there was a significant correlation between the air jet esthesiometer and TBUT, OSDI, and blink rate in all subjects. Moreover, there was a significant positive correlation ( P = .043) between the air jet esthesiometer and OSDI in the meibomian gland disease subset.
| All Subjects | All Tear Dysfunction | Meibomian Gland Disease | Aqueous Tear Deficiency | Conjunctivochalasis | |
|---|---|---|---|---|---|
| R value | R value | R value | R value | R value | |
| Cochet-Bonnet vs TBUT | 0.279 a | 0.248 | 0.695 a | 0.508 | −0.052 |
| Cochet-Bonnet vs K Fl | −0.466 c | −0.460 b | −0.364 | −0.429 | −0.642 a |
| Cochet-Bonnet vs C LG | −0.437 b | −0.427 b | −0.384 | 0.007 | −0.180 |
| Cochet-Bonnet vs OCT TMH | 0.135 | 0.213 | 0.271 | −0.491 | 0.156 |
| Cochet-Bonnet vs OSDI | −0.133 | −0.049 | −0.402 | 0.197 | −0.711 b |
| Cochet-Bonnet vs blink rate | −0.424 b | −0.346 | −0.583 | −0.272 | 0.236 |
| Cochet-Bonnet vs age | −0.207 | −0.019 | −0.244 | −0.238 | −0.059 |
Stay updated, free articles. Join our Telegram channel

Full access? Get Clinical Tree


