Purpose
To evaluate 6-year results of standardized epithelium-off corneal collagen cross-linking (CXL) for treatment of progressive corneal ectasia.
Design
Prospective, consecutive, interventional case series.
Methods
Thirty-six eyes of 25 consecutive patients with documented progressive primary or iatrogenic corneal ectasia underwent CXL following the Siena protocol. The main outcome measures included uncorrected (UDVA) and corrected (CDVA) distance visual acuities, biomicroscopy and fundus appearance, topography-derived steep and flat keratometry (Kmax, Kmin), central corneal thickness (CCT), intraocular pressure with Goldmann applanation tonometer (GAT-IOP), and endothelial cell density (ECD), recorded at baseline and months 1, 3, 6, 12, 24, 36, and 72. Bilateral macular optical coherence tomography was performed at the endpoint visit. The mean follow-up was 66 ± 6 months (range, 60–78 months).
Results
At 6 years, CXL stabilized primary and iatrogenic corneal ectasia in 89% of the patients. In bilateral CXL, the progression of the first eye was highly predictive of the fellow eye’s outcome. At the endpoint follow-up, the mean outcome variations were: UDVA: −0.08 ± 0.36 logMAR ( P = .2); CDVA: −0.14 ± 0.28 logMAR ( P = .004); Kmax: +0.11 ± 1.70 diopters (D) ( P = .7); Kmin: −0.25 ± 1.25 D ( P = .2); CCT: −16.38 ± 37 μm ( P = .01); GAT-IOP: +1.0 ± 2.3 mm Hg ( P = .01); ECD: +31 ± 400 cells/mm 2 ( P = .6); no cases of macular toxicity or severe adverse events were reported.
Conclusions
At 6 years, CXL maintains long-term results in halting the progression of corneal ectasia, with significant improvement in CDVA and long-term stability of keratometry. Further clinical studies with longer follow-up and larger series would be necessary to definitely confirm these results.
Corneal ectatic disorders, whether primary (keratoconus, pellucid marginal degeneration) or iatrogenic (post-LASIK corneal ectasia) are a group of noninflammatory progressive diseases in the course of which reduction of mechanical strength of the cornea leads to a progressive decrease in visual acuity by development of an irregular astigmatism, thinning, and opacification of the cornea.
Corneal collagen cross-linking (CXL) with ultraviolet A (UVA) and riboflavin, a conservative treatment of corneal ectasia, was developed in the late 1990s at Dresden University with the aim of halting the progression of the disease to reduce the need for keratoplasty. Stiffening of the corneal collagenous matrix is induced by both an intra- and interfibrillar reticulation of stromal collagen and an increase in corneal collagen resistance against enzymatic degradation. Since the first large clinical applications began in the early 2000s, few prospective studies of the long-term results of the procedure have been published with a follow-up period longer than 5 years postoperatively. Supported by histologic, clinical, topographic, and wavefront modifications induced by the treatment, all of these suggest that CXL would be an effective and safe treatment in halting the progression of primary and iatrogenic corneal ectasia, with conflicting results depending on whether or not CXL flattens keratectasia and improves visual acuity.
The aim of this study was to evaluate the long-term results of standard CXL for the conservative treatment of corneal ectasia.
Methods
Study Design
This prospective, consecutive, interventional case series study was conducted between March 2008 and December 2014 at Edouard Herriot Hospital, Lyon, France. Mean follow-up was 66 ± 6 months (range, 60–78).
All the clinical applications introduced in this study as well as the entire prospective protocol were approved by the Institutional Review Board and Ethics Committee of the Hospices Civils de Lyon and prior informed consent was obtained from all patients in accordance with the tenets of the Declaration of Helsinki. The authors declare no conflict of interest.
Patients
The study included 36 eyes from 25 patients diagnosed with progressive corneal ectasia who underwent standard (epithelium-off) corneal CXL. Twenty-nine of the 36 eyes had keratoconus (KC) or pellucid marginal corneal degeneration (PMD) (stage 1 in 4 eyes, stage 2 in 14 eyes, stage 3 in 11 eyes) and 7 had post-LASIK corneal ectasia (PLE). The sex ratio was 1.4 (21 male and 15 female patients). The mean age was 25 ± 6.4 years old (range, 15–45). Of the 18 patients treated bilaterally, 11 had both eyes included in the study. The most severe eye was treated first.
The eligibility criteria were existence of progressive stage 1, 2, or 3 KC in the Amsler-Krumeich classification, PMD, or PLE. Diagnosis was based on history of refraction (progressive asymmetrical irregular myopic astigmatism), clinical diagnostic signs such as a Fleischer ring, corneal tilting or Vogt striae, and corneal topographic data. Progression was documented on the basis of deterioration of uncorrected (UDVA) and/or corrected (CDVA) distance visual acuities ≥1 Snellen line, spherical equivalent refraction ≥0.75 diopters (D), cone apex keratometry ≥0.75 D, and/or reduction in corneal thickness (thinnest point) ≥10 μm lasting more than 6 months.
The exclusion criteria were ultrasound central corneal thickness (CCT) under 400 μm, previous corneal surgery, opacity, active infection or reduced endothelial cell density under 2000 cells/mm 2 , macular abnormality, glaucoma, pregnancy, lactation, or the inability to understand the study or provide informed consent.
Clinical Evaluation and Main Outcome Measures
Preoperative and postoperative evaluation included ocular and general past medical history assessment, measurement of UDVA and CDVA, slit-lamp and dilated fundus examination, measurement of intraocular pressure using Goldmann applanation tonometry (GAT-IOP), contact ultrasound pachymetry of the cone apex (OcuScan RpX; Alcon, Fort Worth, Texas, USA), corneal topography of the central 3 mm with a tangential algorithm (Keratron Combi Wavefront Analyser; Schwind Eye-Tech Solutions, KG, Kleinostheim, Germany), and endothelial cell density count (ECD) using noncontact specular microscopy (Specular Microscope SP2000P; Topcon, Tokyo, Japan). The use of contact lenses was avoided for at least 2 weeks before each evaluation.
All of the examinations were repeated at months 1, 3, 6, 12, 24, 36, and 72.
A complementary visit at day 3 assessed corneal status (corneal epithelial healing, absence of burning or infection) and postoperative pain intensity using the visual analog scale (VAS) (0: no pain – 10: most severe pain ever experienced).
At the end of the follow-up, bilateral spectral-domain optical coherence tomography (SD OCT) (Cirrus OCT; Zeiss, Jena, Germany) was performed.
Patients were considered as stabilized when both UDVA and CDVA were not modified by more than 0.1 logMAR and both mean steep and flat keratometric values by more than 0.75 D. CCT, possibly influenced by CXL, was not considered to document the progression of the disease.
Overall improvement was considered when there was additional corneal flattening and/or vision improvement (decrease in logMAR UDVA ± CDVA by more than 0.1 and/or decrease in steep ± flat keratometric values by more than 0.75 D).
Overall worsening was considered if at least 1 of these parameters worsened (increase in logMAR UDVA ± CDVA by more than 0.1 and/or increase in steep ± flat keratometric values by more than 0.75 D) even though 1 of them improved.
CXL tolerance was assessed on postoperative pain, corneal wound healing and transparency, GAT-IOP, ECD, and screening for photic maculopathy (lamellar defect with irregular contours affecting the foveolar region on fundus examination and/or outer retinal hole[s] bordered by a hyperreflective ring without inner retinal cystic changes by SD OCT ).
Intervention
The surgical procedure of corneal cross-linking induced by riboflavin and UVA was performed in all patients according to the Siena protocol, as described in our previous report. Briefly, the surgical procedure included premedication with topical 2% pilocarpine 30 min before treatment, mechanical debridement of corneal epithelium over an 8-mm diameter under topical anesthesia, corneal impregnation with a photosensitizing solution of 0.1% riboflavin–20% dextran T500 (Ricrolin; SOOFT, Montegiorgio, Italy) by corneal instillation at a rate of 1 drop per minute for 20 min and polymerization of corneal collagen for 30 min (CBM X Linker Vega, CSO, Firenze, Italy; LED-UVA single 370-nm beam, 3 mW/cm 2 ± 10%, 5.4 J/cm 2 ) after verification of the UVA laser source unit’s calibration using a UVA power meter. Riboflavin was instilled regularly during the procedure so as to maintain its stromal concentration rate.
According to French recommendations, postoperative treatment included per os analgesics (paracetamol/codeine 500 mg/30 mg, 4 times daily for 3 days), 7 days of local antibiotic treatment (ofloxacin), and local nonsteroidal anti-inflammatory drugs (flurbiprofen) followed by 15 days of local corticoid treatment (dexamethasone), which could be prolonged to 30 days in case of residual haze.
Statistical Analysis
All data are presented as mean ± standard deviation (range). Differences in respective parameters were assessed using the paired 2-tailed Student t test. Statistical analysis was performed using SPSS software (SPSS 16.0 for Windows; SPSS Inc, Chicago, Illinois, USA). A P value of .05 was considered as statistically significant.
Results
Uncorrected and Corrected Distance Visual Acuity
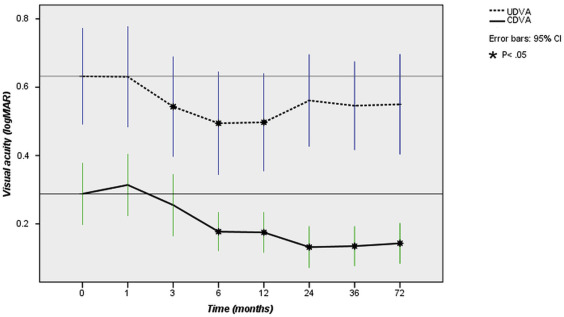
At baseline, the mean UDVA and CDVA were, respectively, 0.63 ± 0.41 (0.0–1.8) and 0.28 ± 0.26 (0.0–1.5) logMAR ( Table 1 ). UDVA significantly improved from 3 to 12 months after treatment (decrease in UCVA logMAR metric, P = .01–.005), and then showed a tendency toward improvement with no statistically significant variation, reaching 0.55 ± 0.43 logMAR (0.0–1.3) at 6 years ( P = .19) ( Figure 1 ). CDVA improvement was observed as well, becoming highly significant at month 6 and reaching 0.14 ± 0.17 logMAR (0.0–0.6) at 6 years (mean Δ = −0.14 ± 0.28 logMAR) ( P = .004) ( Figure 1 ). Detailed data of visual acuity measurements are given in Table 1 . Separate analysis of KC and PLE subgroups from baseline to 6 years in the KC subgroup showed significant visual acuity improvement (UDVA from 0.66 ± 0.42 to 0.54 ± 0.45 [ P = .09] and CDVA from 0.29 ± 0.29 to 0.13 ± 0.16 logMAR [ P = .009]). At the same time, the PLE subgroup showed a tendency toward UCVA worsening (from 0.52 ± 0.34 to 0.60 ± 0.38 logMAR [ P = .5]) and CDVA improvement (from 0.28 ± 0.15 to 0.21 ± 0.22 logMAR [ P = .1]). Statistical analysis did not find any statistically significant change for either UDVA or CDVA in the PLE group because of the small size of the cohort.
| Before Inclusion | Baseline | Month 1 | Month 3 | Month 6 | Month 12 | Month 24 | Month 36 | Month 72 | |
|---|---|---|---|---|---|---|---|---|---|
| Kmax (diopters) | 47.07 ± 3.7 (38.90–56.86) P = .02 | 49.58 ± 4.1 (42.08–59.98) | 50.43 ± 4.7 (41.23–64.66) P = .02 | 49.98 ± 4.7 (41.29–65.03) P = .14 | 49.51 ± 4.3 (41.37–63.29) P = .95 | 49.51 ± 4.3 (41.37–63.29) P = .74 | 49.31 ± 4.4 (41.10–62.40) P = .25 | 49.43 ± 4.6 (41.00–62.00) P = .55 | 49.7 ± 4.6 (40.80–61.25) P = .68 |
| Kmin (diopters) | 42.93 ± 3.3 (37.02–52.00) P = .002 | 45.30 ± 2.9 (39.88–52.70) | 45.86 ± 3.7 (38.71–56.00) P = .02 | 45.69 ± 3.75 (39.90–60.06) P = .13 | 45.23 ± 2.9 (39.57–51.38) P = .65 | 45.27 ± 3.0 (39.17–51.30) P = .87 | 45.26 ± 3.0 (39.10–52.05) P = .74 | 45.08 ± 3.0 (39.12–51.50) P = .16 | 45.04 ± 3.2 (30.04–51.71) P = .23 |
| UDVA (logMAR) | 0.63 ± 0.41 (0.0–1.8) | 0.63 ± 0.43 (0.0–1.8) P = .97 | 0.54 ± 0.43 (0.0–1.8) P = .01 | 0.49 ± 0.44 (0.0–1.8) P = .005 | 0.49 ± 0.42 (0.0–1.3) P = .002 | 0.56 ± 0.39 (0.0–1.3) P = .12 | 0.54 ± 0.38 (0.0–1.3) P = .08 | 0.55 ± 0.43 (0.0–1.3) P = .19 | |
| CDVA (logMAR) | 0.28 ± 0.26 (0.0–1.5) | 0.31 ± 0.26 (0.05–1.5) P = .35 | 0.25 ± 0.26 (0.0–1.5) P = .20 | 0.18 ± 0.16 (0.0–0.7) P = .01 | 0.17 ± 0.17 (0.0–0.7) P = .01 | 0.13 ± 0.18 (−0.2 to 0.18) P = .001 | 0.13 ± 0.17 (−0.1 to 0.5) P = .002 | 0.14 ± 0.17 (0.0–0.6) P = .004 | |
| CCT (μm) | 445 ± 36 (400–520) | 437 ± 35 (355–503) P = .005 | 435 ± 38 (350–502) P = .008 | 429 ± 39 (350–500) P = .005 | 428 ± 40 (333–501) P = .003 | 431 ± 42 (333–530) P = .003 | 431 ± 45 (320–550) P = .01 | 429 ± 50 (310–577) P = .01 | |
| GAT-IOP (mm Hg) | 10.7 ± 2 (6–15) | 10.5 ± 1.3 (6–15) P = .73 | 10.6 ± 1.7 (7–14) P = .53 | 10.5 ± 1.9 (6–15) P = .59 | 10.9 ± 1.9 (7–16) P = .57 | 10.7 ± 1.5 (8–15) P = .93 | 10.5 ± 1.2 (8–13) P = .53 | 11.6 ± 1.6 (8–16) P = .01 | |
| ECD (cells/mm 2 ) | 2 936 ± 370 (2 250–3 800) | 2 983 ± 294 (2 256–3 600) P = .43 | 3 044 ± 310 (2 250–3 650) P = .10 | 3 025 ± 309 (2 500–3 745) P = .09 | 3 043 ± 318 (2 350–3 556) P = .08 | 3 021 ± 270 (2 450–3 800) P = .13 | 2 967 ± 268 (2 300–3 550) P = .39 | 2 967 ± 268 (2 370–3 400) P = .64 |
Mean Steep Keratometry and Flat Keratometry on Corneal Topography
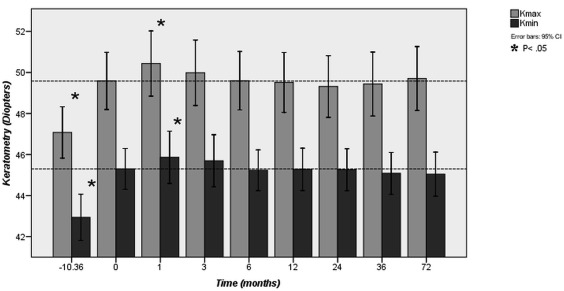
At baseline, mean Kmax and Kmin were, respectively, 49.58 ± 4.1 D (range, 42.08–59.98 D) and 45.30 ± 2.9 D (range, 39.88–52.70 D). Before inclusion, a significant progression of both Kmax and Kmin of +2.5 ± 2.3 D (1.7–3.2 D) and +2.36 ± 2.45 D (1.5–3.2 D), respectively, was observed during a mean follow-up of 10.36 ± 11 months (range, 1–48 months) ( P = .02 and P = .01). One month after treatment, a transient but significant increase of both Kmax and Kmin of +0.84 ± 1.50 D (0.33–1.35 D) and +2.92 ± 2.94 D (1.93–3.92 D), respectively, was observed ( P = .02 and P = .002). From month 3 to the end of the follow-up, we did not observe any statistically significant variation of these parameters at any time point during follow-up, with a final Kmax value of 49.7 ± 4.6 D (40.80–61.25 D) and a Kmin value of 45.04 ± 3.2 D (30.04–51.71 D) ( P > .05) ( Figure 2 ). Detailed data of keratometry measurement are given in Table 1 .
A separate analysis showed similar results for both KC and PLE subgroups from before inclusion to 6 years, with a significant increase of both Kmax and Kmin before inclusion of +2.61 ± 2.46 D (1.67–2.55 D) and 2.42 ± 2.64 D (1.41–3.43 D) in the KC subgroup ( P = .001 and P = .001), and +2.08 ± 1.50 D (0.69–3.47 D) and 2.10 ± 1.52 D (0.69–3.51 D) in the PLE subgroup ( P = .01 and P = .01). At month 1, an increase of these parameters was observed in the KC subgroup with, respectively, 1.08 ± 1.40 D (0.55–1.61 D) and +0.70 ± 1.14 D (0.27–1.14 D) ( P = .001 and P = .003). Then no significant change was observed in these parameters for both groups at any time point during follow-up ( P > .05). Statistical analysis may not have found any statistically significant change after treatment in the PLE group because of the small size of the cohort.
Overall Progression
At 6 years, among the 36 treated eyes, 24 (67%) were stabilized without improvement, 8 (22%) improved, and 4 (11%) continued to progress (criteria listed above). Thus, progression of the disease was at least stabilized in 89% of cases. At baseline, there was no statistically significant difference in UDVA, CDVA, Kmin, Kmax, CCT, age, or sex ratio between the full cohort and each subgroup (stabilized without improvement, improved, worsened) ( Table 2 ). Improvement was statistically significant for CDVA, Kmax, and Kmin, and was recorded beginning at month 12 for both CDVA and Kmax and beginning at month 36 for Kmin. Stabilization was achieved at month 3 and until the endpoint follow-up for all parameters (UDVA, CDVA, Kmax, and Kmin). Progression of the disease concerned only Kmax with a U-shaped trend, with initial postoperative worsening (months 1 to month 6) followed by a transient stabilization (month 12 to 24) and late deterioration (month 36 to endpoint follow-up). Detailed data are provided in Table 3 .
| All Patients (100%, n = 36) | Improvement (22%, n = 8) | Stabilization (67%, n = 24) | Worsening (11%, n = 4) | |
|---|---|---|---|---|
| Kmax (diopters) | 49.58 ± 4.1 (42.08–59.98) | 49.09 ± 5.67 (42.36–57.60) P = .8 | 49.09 ± 5.67 (42.08–59.98) P = .9 | 49.76 ± 3.79 (45.62–53.85) P = .9 |
| Kmin (diopters) | 45.30 ± 2.9 (39.88–52.70) | 45.82 ± 4.08 (41.06–52.70) P = .7 | 45.82 ± 4.08 (39.88–50.19) P = .7 | 45.78 ± 2.42 (43.83–49.27) P = .7 |
| UDVA (logMAR) | 0.63 ± 0.41 (0.0–1.8) | 0.72 ± 0.57 (0.0–1.8) P = .7 | 0.58 ± 0.37 (0.0–1.3) P = .6 | 0.72 ± 0.38 (0.5–1.3) P = .7 |
| CDVA (logMAR) | 0.28 ± 0.26 (0.0–1.5) | 0.26 ± 0.23 (0.0–0.7) P = .8 | 0.30 ± 0.30 (0.0–1.5) P = .9 | 0.27 ± 0.12 (0.1–0.4) P = .9 |
| CCT (μm) | 445 ± 36 (400–520) | 441 ± 36 (400–486) P = .8 | 448 ± 39 (384–520) P = .7 | 429 ± 39 (421–443) P = .1 |
| Age (y) | 25 ± 6.4 (15–45) | 24.9 ± 4.4 (19–31) P = .9 | 25.2 ± 7.2 (15–45) P = .9 | 25.5 ± 4.8 (20.30) P = .9 |
| Sex ratio (male to female) | 1.4 | 1 P = .6 | 1.6 P = .8 | 1 P = .7 |
| Month 1 | Month 3 | Month 6 | Month 12 | Month 24 | Month 36 | Month 72 | ||
|---|---|---|---|---|---|---|---|---|
| Improved (22%; n = 8) | UDVA | −0.04 ± 0.18 P = .58 | −0.10 ± 0.24 P = .31 | −0.13 ± 0.20 P = .12 | −0.21 ± 0.26 P = .05 a | −0.22 ± 0.31 P = .08 | −0.20 ± 0.26 P = .07 | −0.15 ± 0.28 P = .18 |
| CDVA | +0.02 ± 0.12 P = .69 | −0.09 ± 0.15 P = .15 | −0.05 ± 0.10 P = .17 | −0.12 ± 0.13 P = .03 a | −0.13 ± 0.13 P = .02 a | −0.12 ± 0.12 P = .02 a | −0.15 ± 0.16 P = .03 a | |
| Kmax | +0.48 ± 1.82 P = .48 | +0.45 ± 2.90 P = .67 | −0.82 ± 1.05 P = .06 | −1.19 ± 0.40 P = .01 a | −0.99 ± 0.61 P = .003 a | −0.92 ± 0.49 P = .001 a | −1.36 ± 0.49 P = .001 a | |
| Kmin | +0.12 ± 1.78 P = .85 | +0.74 ± 2.76 P = .47 | −0.55 ± 0.86 P = .11 | −0.35 ± 0.84 P = .27 | −0.36 ± 0.57 P = .12 | −0.67 ± 0.42 P = .003 a | −1.14 ± 0.42 P = .001 a | |
| Stabilized without improvement (67%, n = 24) | UDVA | +0.04 ± 0.21 P = .37 | −0.07 ± 0.20 P = .08 | −0.11 ± 0.29 P = .08 | −0.09 ± 0.24 P = .09 | −0.03 ± 0.24 P = .49 | −0.06 ± 0.29 P = .28 | −0.07 ± 0.40 P = .38 |
| CDVA | +0.04 ± 0.18 P = .31 | −0.00 ± 0.15 P = .86 | −0.11 ± 0.29 P = .06 | −0.12 ± 0.30 P = .06 | −0.10 ± 0.33 P = .06 | −0.08 ± 0.26 P = .06 | −0.07 ± 0.29 P = .07 | |
| Kmax | +0.84 ± 1.49 P = .01 a | −0.20 ± 0.99 P = .32 | −0.12 ± 1.18 P = .62 | +0.10 ± 1.27 P = .69 | −0.24 ± 1.49 P = .44 | −0.19 ± 1.54 P = .54 | +0.18 ± 1.49 P = .55 | |
| Kmin | +0.64 ± 1.20 P = .01 a | +0.25 ± 1.02 P = .24 | −0.03 ± 0.89 P = .85 | −0.01 ± 0.86 P = .96 | −0.00 ± 0.83 P = .98 | −0.15 ± 1.03 P = .49 | −0.04 ± 1.36 P = .87 | |
| Worsened (11%, n = 4) | UDVA | −0.17 ± 0.29 P = .31 | −0.17 ± 0.21 P = .19 | −0.32 ± 0.20 P = .06 | −0.24 ± 0.18 P = .08 | −0.02 ± 0.28 P = .87 | −0.02 ± 0.27 P = .86 | −0.00 ± 0.34 P = 1 |
| CDVA | −0.04 ± 0.07 P = .39 | −0.09 ± 0.08 P = .13 | −0.05 ± 0.10 P = .17 | −0.08 ± 0.06 P = .21 | −0.04 ± 0.16 P = .67 | −0.07 ± 0.09 P = .21 | −0.07 ± 0.12 P = .32 | |
| Kmax | +1.57 ± 0.70 P = .02 a | +1.44 ± 0.56 P = .01 a | +1.03 ± 0.41 P = .01 a | −1.12 ± 1.02 P = .11 | −3.60 ± 3.20 P = .11 | +1.66 ± 1.02 P = .04 a | +2.66 ± 1.31 P = .02 a | |
| Kmin | +0.95 ± 1.59 P = .31 | +0.55 ± 0.72 P = .23 | +0.29 ± 0.49 P = .31 | +0.55 ± 0.78 P = .25 | +0.37 ± 0.33 P = .11 | +0.30 ± 0.56 P = .36 | +0.24 ± 0.86 P = .61 | |
Stay updated, free articles. Join our Telegram channel

Full access? Get Clinical Tree


