Purpose
To investigate photoreceptor changes in eyes with glaucoma.
Design
Cross-sectional study.
Methods
The study included 35 eyes of 35 patients with primary open-angle glaucoma who had suffered parafoveal visual field loss at least 3 years previously, as well as 21 eyes of 21 normal subjects. Eyes with an axial length ≥26.0 mm were excluded. All subjects underwent a full ophthalmologic examination, including spectral-domain optical coherence tomography (SDOCT) and prototype adaptive-optics scanning laser ophthalmoscopy (AO-SLO) imaging.
Results
As determined using AO-SLO, eyes with glaucoma did not differ significantly from normal eyes in terms of either cone density (26 468 ± 3392 cones/m 2 vs 26 147 ± 2700 cones/m 2 , respectively; P = .77; measured 0.5 mm from the foveal center) or cone spatial organization (ratio of hexagonal Voronoi domain: 43.7% ± 4.4% vs 44.3% ± 4.9%; P = .76; measured 0.5 mm from the foveal center). Furthermore, SDOCT showed that the 2 groups did not differ significantly in terms of the photoreceptor-related layer thickness, and that the photoreceptor ellipsoid zone band was continuous in all normal and glaucoma eyes. In glaucoma eyes with vertically asymmetric severity, the more affected side did not significantly differ from the less affected side in terms of cone density, cone spatial organization, or photoreceptor-related layer thickness. In 8 eyes (22.9%) with glaucoma, dark, partition-like areas surrounded the cones on the AO-SLO.
Conclusions
Both AO-SLO and SDOCT showed cone integrity in eyes with glaucoma, even in areas with visual field and nerve fiber loss. In AO-SLO, microcystic lesions in the inner nuclear layer may influence images of the cone mosaic.
Glaucoma is one of the leading causes of blindness worldwide, and its prevalence increases with aging. The only treatment that effectively slows glaucoma-related loss of visual function is the reduction of intraocular pressure (IOP), although the visual field often worsens despite the IOP’s having been reduced to within normal limits. Given such a serious limitation to treatment, it follows that the pathogenesis of glaucoma may not yet be fully understood. Both age and high IOP are risk factors for glaucoma progression ; myopia and blood flow impairment may also be involved in the disease mechanism. If we improve our understanding of glaucoma pathogenesis, we will be better equipped to develop new therapeutic strategies.
Retinal ganglion cells (RGCs) are damaged in glaucoma, causing thinning of both the retinal nerve fiber layer (RNFL) and the ganglion cell layer (GCL). In addition, several studies have reported possible changes in the other retinal layers—the inner nuclear layer (INL), which contains the nuclei of horizontal, bipolar, amacrine, and Müller cells; and the outer nuclear layer (ONL), which contains the nuclei of photoreceptors—although these layers are less affected in glaucoma. Nork and associates showed histologically that the cone cells in glaucomatous eyes may swell, and Choi and associates observed, using an adaptive optics (AO) fundus camera, dark areas in the cone mosaic of glaucomatous eyes. Conversely, Kendell and associates showed histologically that the number of photoreceptors does not decrease in eyes with primary open-angle glaucoma (POAG).
Thus, it is still not clear whether, or in what way, glaucoma is associated with photoreceptor damage—perhaps because it is difficult to image photoreceptors in vivo. Optical coherence tomography (OCT) and other imaging modalities such as scanning laser ophthalmoscopy (SLO) cannot provide sufficiently detailed images of photoreceptor microstructure—primarily because of aberrations in the optics of the eye. These aberrations can be compensated for in living eyes using systems that incorporate AO, such as a wavefront sensor to measure aberrations in the eye, a deformable mirror, or a spatial light modulator. Indeed, AO has been added to imaging systems such as flood-illuminated ophthalmoscopes, SLO, or OCT, and this has allowed researchers to identify abnormalities in individual cone photoreceptors in patients with various retinal diseases. In the current study, we used our prototype AO-SLO system to investigate photoreceptor changes in glaucomatous eyes. We also compared these changes with those observed on images obtained using spectral-domain OCT (SDOCT) and swept-source OCT (SSOCT).
Methods
This cross-sectional study adhered to the tenets of the Declaration of Helsinki, and the study was approved by the institutional review board and the ethics committee at Kyoto University Graduate School of Medicine. We explained to all potential participants the nature of the study and its possible consequences, and we obtained written informed consent from all who participated.
Subjects
All patients with POAG who visited the Glaucoma Service at Kyoto University Hospital between November 2012 and July 2015, as well as healthy volunteers, were considered as potential participants in this study. All patients and volunteers underwent a comprehensive ophthalmologic examination, which included autorefractometry/keratometry, uncorrected and best-corrected visual acuity (BCVA) evaluation using a 5-m Landolt chart, IOP measurement using a Goldmann applanation tonometer, axial length measurement using an IOLMaster (Carl Zeiss Meditec, Dublin, California, USA), visual field testing using the Humphrey Field Analyzer (HFA; Carl Zeiss Meditec), gonioscopy, dilated funduscopy, stereo fundus photography (3Dx simultaneous stereo disc camera; Nidek, Gamagori, Japan), red-free SLO fundus imaging (Heidelberg Retina Angiography [HRA] 2; Heidelberg Engineering, Heidelberg, Germany), SDOCT (Spectralis HRA+OCT; Heidelberg Engineering), SSOCT (DRI-OCT-1; Topcon, Tokyo, Japan), and our prototype AO-SLO.
Glaucoma was diagnosed in cases of (1) diffuse or localized rim thinning evident on stereo disc photography and/or (2) RNFL defects—determined using red-free fundus imaging—that corresponded to glaucomatous visual field defects. This diagnosis was carried out during our glaucoma service meeting before the recruitment to this study. The optic disc appearance was independently evaluated by 3 glaucoma specialists, who were masked to all other information about the eyes. If any examiner disagreed with the others regarding the classification of an eye, the group reviewed and discussed the fundus color and stereo photographs until they had reached a consensus.
We defined glaucoma-related visual field defects according to the Anderson and Patella criteria (using standard automated perimetry in accordance with the 24-2 Swedish Interactive Threshold Algorithm [SITA] standard); the criteria were as follows: (1) abnormal range on the glaucoma hemifield test; (2) pattern deviation of <5% in 3 adjacent points, 1 of which was <1%; or (3) pattern standard deviation of <5% of the normal reference value, which is confirmed by 2 consecutive tests, and the tests were considered to be reliable when there was a fixation loss of <20%, false-positive results of <20%, and false-negative results of <20%.
Patients with POAG were only included if (1) the visual field sensitivity in the parafoveal region (within 5 degrees of the fovea) had deteriorated by less than 20 dB, and (2) the deterioration had occurred at least 3 years before their recruitment in the study. These inclusion criteria were determined in order to detect any glaucomatous damage to the cones sensitively. The exclusion criteria were as follows: (1) contraindication for mydriasis; (2) spherical equivalent refractive error of >5.0 diopters or <-10.0 diopters, or cylindrical refractive error of <-3.0 diopters; (3) axial length of ≥26.0 mm; (4) unreliable HFA results (ie, fixation loss of ≥20%; false positives or false negatives of ≥20%); (5) history of intraocular surgery other than cataract surgery; (6) evidence of vitreoretinal disease, or of brain diseases, diabetes mellitus, or other systemic diseases that might affect the eye; (7) poor image quality. If both eyes in a glaucoma patient were eligible, the eye with the more severe visual field loss was selected. If both eyes of a healthy subject were eligible, 1 eye was selected randomly.
Adaptive-optics Scanning Laser Ophthalmoscopy
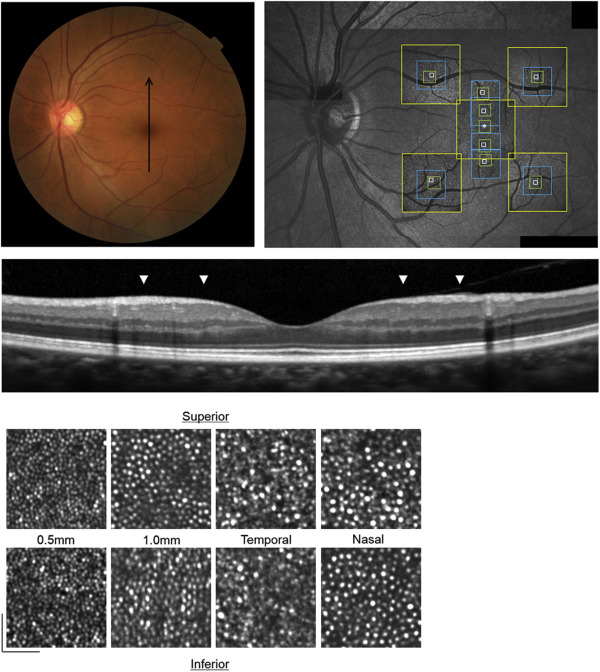
We developed an original prototype AO-SLO system in collaboration with Canon Inc (Tokyo, Japan). The system comprises an AO subsystem, a high-resolution confocal SLO imaging subsystem, a wide-field imaging subsystem, and a pupil observation subsystem. This system allows the user to visualize individual cone photoreceptors in vivo. We obtained a series of AO-SLO images from several locations ( Figure 1 ); at each location, we moved the focus from the RNFL to the retinal pigment epithelium (RPE) to obtain the image series. We obtained AO-SLO images that focused on the cone mosaic, capturing up to 3 different fields of view at each location (L: 1700 × 1700 μm, M: 820 × 820 μm, and S: 340 × 340 μm). First, we obtained images at 3 different fields of view (L, M, and S) at the foveal center; then we captured images at 2 fields of view (M and S) centered 0.5 mm and 1.0 mm from the foveal center (both superior and inferior). Then we obtained images at 3 fields of view (L, M, and S) that were centered 1.5 mm superior or inferior, and 1.5 mm nasal or temporal, to the foveal center (diagonally 2.1 mm). At each location, 32 images were averaged to reduce noise. After image acquisition, we created montages of the AO-SLO images by matching the vessels and cone mosaic patterns; this allowed automatic calculation of the distances between the foveal center and target areas. We only used the highest-magnification images (S) for quantification, and we quantified these images in smaller areas that contained approximately 100 cones, each of which was at a targeted distance from the foveal center. We also obtained AO-SLO images that focused on different depths between the RNFL and cone mosaics.
To assess the cones, we applied the automated cone labeling process established by Li and Roorda. When the algorithm failed to properly label the cones, an observer (who was masked to clinical information) manually labeled the areas where cones were visible but not detected automatically. To assess the interobserver intraclass correlation coefficients (ICCs), another masked observer independently carried out the manual correction of the automated cone labeling in randomly selected eyes, and measured cone density, the hexagonal Voronoi domains, and the ratio of average nearest-neighbor distance (NND) to expected NND. To assess the intersession reproducibility, ICCs were assessed between images repeatedly obtained at the same locations. To obtain accurate scan lengths, we corrected for the magnification effect using the adjusted axial length method reported by Bennett and associates. Spatial organization of the cone mosaics was assessed in terms of NNDs and Voronoi domains. The NNDs were determined by measuring the minimum distances to the center of the neighboring cells within the cone mosaic. Expected NNDs were calculated using a virtual, perfectly hexagonally packed mosaic with a density equal to that at each measured location. The ratio of the average NND to the expected NND was calculated at each location. The Voronoi domain of each cell was constructed by identifying all points that were closer to that cell than to any other cell in the mosaic. The ratio of the hexagonal Voronoi domain was calculated at each location.
In the current study, we only assessed locations that corresponded to HFA test points where (1) the sensitivity had deteriorated by less than 20 dB and (2) this deterioration had occurred at least 3 years prior to recruitment in the study. We defined these as “affected locations,” and the quantified data in each table are limited to these locations. If there were 2 or more affected locations on the different sides (superior and inferior), cone density, hexagonal Voronoi domain ratio, and average NND/expected NND were measured at each location, and the mean density or ratio of each distance was calculated. Eyes with glaucoma of >15 dB vertically asymmetric severity were analyzed separately.
Optical Coherence Tomography
The Spectralis HRA+OCT system was used to scan the macula. Our macular scan protocol comprised 19 vertical line scans and scanned a macular area that was centered at the fovea, 30 degrees in height, and 15 degrees in width. To reduce speckle noise, each image was obtained by averaging 50 B-scans.
In order to confirm that the glaucomatous damage had occurred where the AO-SLO images were obtained, we measured the thicknesses of the RNFL, as well as those of the INL, the ONL plus the outer plexiform layer (OPL), and the photoreceptor layer. The ONL + OPL thickness was defined as the distance from the inner border of the OPL to the external limiting membrane (ELM). Photoreceptor thickness was defined as the distance from the ELM to the inner border of the RPE. The continuity of the ellipsoid zone (EZ) line was also assessed. We measured the combined thicknesses of the ONL and OPL, instead of the ONL thickness alone, because it is difficult to accurately measure the ONL thickness using standard SDOCT images. We performed the measurements using the built-in digital caliper tool of the SDOCT system, with adjustments for the displacement between the cones and RGCs, in accordance with the formula introduced by Sjostrand and associates : namely, y = 1.29 × (x + 0.046) 0.67 , where “y” is the RGC eccentricity and “x” is the cone eccentricity. The measurements were conducted independently in randomly selected eyes by 2 observers, and the interobserver ICCs were assessed. Additionally, we performed SSOCT (DRI-OCT-1) examinations. En face images of each layer were automatically reconstructed from a 3-dimensional volumetric scan centered at the fovea using software developed by the Topcon Corporation.
Statistical Analysis
We used the unpaired t test to compare glaucomatous eyes with healthy eyes in terms of mean age, refractive error, axial length, mean deviation (MD) value, and IOP. Cone density, hexagonal Voronoi domain ratio, and ratio of average NND to expected NND were compared between glaucomatous eyes and normal eyes using the unpaired t test. In glaucomatous eyes with vertically asymmetric severity, the paired t test was used to compare the same parameters between more and less affected locations. The unpaired t test was used to compare parameters between eyes with dark areas on AO-SLO and eyes without them. A P value < .05 was considered statistically significant. Where applicable, data are presented as mean ± standard deviation (SD).
Results
Thirty-five eyes of 35 glaucoma patients with parafoveal visual field loss and 21 eyes of 21 healthy volunteers were included in this study. The clinical characteristics of all participants are summarized in Table 1 . The ages of the patients with glaucoma ranged from 35 to 75 years (60.4 ± 10.4 years), while those of the healthy volunteers ranged from 36 to 72 years (55.2 ± 11.1 years; P = .08). The axial length ranged from 21.26 mm to 25.98 mm (24.4 ± 1.3 mm) in glaucomatous eyes and from 23.47 mm to 25.13 mm (24.3 ± 0.5 mm) in healthy eyes ( P = .87). All eyes in the glaucoma group showed glaucomatous visual field defects that corresponded to evident optic disc rim thinning. The mean MD was −11.6 ± 7.5 dB in glaucomatous eyes, which was significantly lower than that in healthy eyes (-0.4 ± 1.7 dB; P < .001). The pretreatment IOP ranged from 15 mm Hg to 29 mm Hg (19.9 ± 3.4 mm Hg) in the glaucoma group.
| Variables | Glaucoma (35 Eyes of 35 Patients) | Normal (21 Eyes of 21 Subjects) | P Value |
|---|---|---|---|
| Age (y) | 60.4 ± 10.4 | 55.2 ± 11.1 | .08 |
| Sex (male/female) | 17/18 | 13/8 | .33 |
| Spherical equivalent (diopters) | −2.4 ± 2.8 | −1.3 ± 1.7 | .12 |
| Axial length (mm) | 24.4 ± 1.3 | 24.3 ± 0.5 | .87 |
| MD (dB) | −11.6 ± 7.5 | −0.4 ± 1.7 | <.001 |
| IOP (mm Hg) | 14.4 ± 3.0 | 15.2 ± 3.0 | .41 |
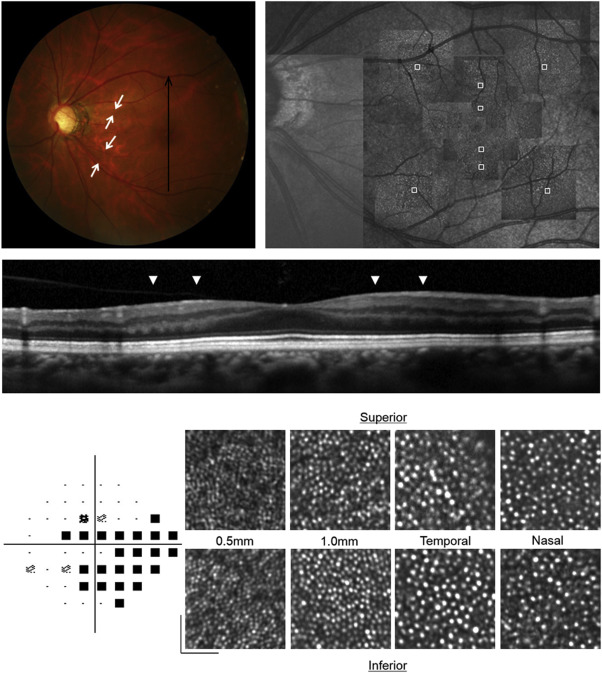
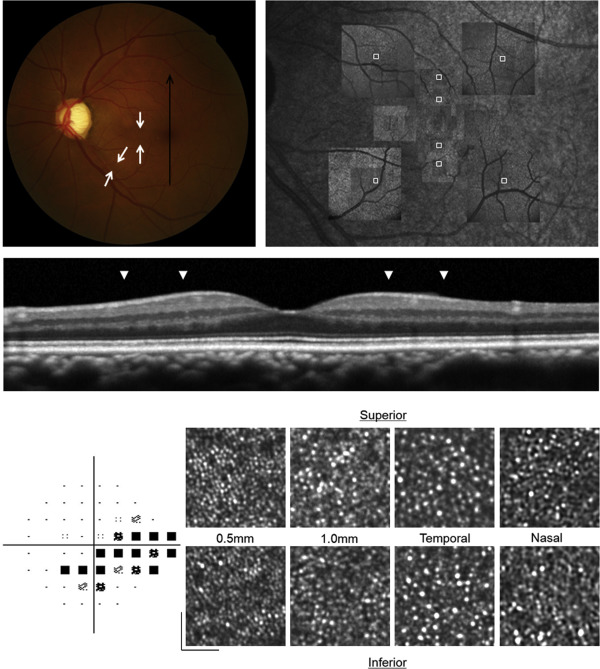
Both in healthy eyes and in glaucomatous eyes, AO-SLO images revealed a regular cone mosaic pattern ( Figures 1–3 ). Even where there was an RNFL defect, the cone mosaic was not disrupted ( Figures 2 and 3 ).
Manual correction of cone labeling was required in 12.5% ± 7.7% of cones in normal eyes and in 12.8% ± 7.2% of cones in eyes with glaucoma. The interobserver ICCs in normal eyes were 0.994 for measurements of cone density, 0.746 for the hexagonal Voronoi domains, and 0.919 for the ratio of average NND to expected NND (n = 13; Table 2 ). The interobserver ICCs in eyes with glaucoma were 0.989 for measurements of cone density, 0.871 for the hexagonal Voronoi domains, and 0.909 for the ratio of average NND to expected NND (n = 10; Table 2 ). AO-SLO images were repeatedly obtained at the same locations in normal eyes (n = 13) and in glaucoma eyes (n = 15) to assess the intersession reproducibility ( Table 3 ). The ICCs were 0.997 for measurements of cone density, 0.809 for hexagonal Voronoi domains, and 0.808 for the ratio of average NND to expected NND in normal eyes. The ICCs were 0.997 for measurements of cone density, 0.805 for hexagonal Voronoi domains, and 0.846 for the ratio of average NND to expected NND in glaucoma eyes.
| Intraclass Correlation Coeffients | ||
|---|---|---|
| Interobserver Reproducibility | 95% Confidence Interval | |
| Normal | ||
| Cone density (cones/mm 2 ) | 0.994 | 0.989–0.997 |
| Ratio of hexagonal Voronoi domain (%) | 0.746 | 0.577–0.854 |
| Average NND/expected NND | 0.919 | 0.856–0.955 |
| Glaucoma | ||
| Cone density (cones/mm 2 ) | 0.989 | 0.973–0.995 |
| Ratio of hexagonal Voronoi domain (%) | 0.871 | 0.716–0.944 |
| Average NND/expected NND | 0.909 | 0.793–0.961 |
| Intraclass Correlation Coeffients | ||
|---|---|---|
| Intersession Reproducibility | 95% Confidence Interval | |
| Normal | ||
| Cone density (cones/mm 2 ) | 0.997 | 0.992–0.999 |
| Ratio of hexagonal Voronoi domain (%) | 0.809 | 0.607–0.913 |
| Average NND/expected NND | 0.808 | 0.607–0.912 |
| Glaucoma | ||
| Cone density (cones/mm 2 ) | 0.997 | 0.994–0.998 |
| Ratio of hexagonal Voronoi domain (%) | 0.805 | 0.641–0.899 |
| Average NND/expected NND | 0.846 | 0.711–0.921 |
Table 4 summarizes the comparison of the cone assessments between glaucomatous and healthy eyes. In both healthy and glaucomatous eyes, the cone density was lower at greater distances from the foveal center. At each distance from the center of the fovea, the groups did not differ significantly in terms of either cone density (26 468 ± 3392 cones/mm 2 in glaucomatous eyes vs 26 147 ± 2700 cones/mm 2 in healthy eyes; P = .77; 0.5 mm from the foveal center) or cone spatial organization (ratio of hexagonal Voronoi domain: 43.7% ± 4.4% vs 44.3% ± 4.9% [ P = .76]; average NND/expected NND: 0.73 ± 0.02 vs 0.75 ± 0.03 [ P = .19]; 0.5 mm from the foveal center).
| Glaucoma (35 Eyes of 35 Patients) | Normal (21 Eyes of 21 Subjects) | P Value | |
|---|---|---|---|
| Vertically 0.5 mm | |||
| Cone density (cones/mm 2 ) | 26 468 ± 3392 | 26 147 ± 2700 | .77 |
| Ratio of hexagonal Voronoi domain (%) | 43.7 ± 4.4 | 44.3 ± 4.9 | .76 |
| Average NND/expected NND | 0.73 ± 0.02 | 0.75 ± 0.03 | .19 |
| Vertically 1.0 mm | |||
| Cone density (cones/mm 2 ) | 18731 ± 2430 | 17 676 ± 2014 | .18 |
| Ratio of hexagonal Voronoi domain (%) | 43.7 ± 4.3 | 46.6 ± 4.5 | .07 |
| Average NND/expected NND | 0.73 ± 0.02 | 0.74 ± 0.03 | .07 |
| Diagonally 2.1 mm (temporal) | |||
| Cone density (cones/mm 2 ) | 16 260 ± 3007 | 16 064 ± 2401 | .83 |
| Ratio of hexagonal Voronoi domain (%) | 41.5 ± 6.1 | 40.6 ± 3.1 | .54 |
| Average NND/expected NND | 0.71 ± 0.02 | 0.71 ± 0.01 | .13 |
| Diagonally 2.1 mm (nasal) | |||
| Cone density (cones/mm 2 ) | 16 450 ± 2969 | 16 239 ± 2429 | .85 |
| Ratio of hexagonal Voronoi domain (%) | 43.9 ± 5.0 | 40.6 ± 3.7 | .08 |
| Average NND/expected NND | 0.71 ± 0.02 | 0.71 ± 0.02 | .38 |
Of the 35 glaucomatous eyes included in the study, 29 showed a vertically asymmetric visual field loss of more than 15 dB within 5 degrees of the fovea ( Figures 2 and 3 ). Table 5 summarizes an analysis of these 29 eyes. At each distance from the center of the fovea, the more and less affected sides did not differ significantly in terms of either cone density (26 578 ± 3482 cones/mm 2 vs 25 926 ± 2100 cones/mm 2 , respectively; P = .56; 0.5 mm from the foveal center) or cone spatial organization (ratio of hexagonal Voronoi domain: 43.9% ± 4.5% vs 46.6% ± 7.7%, respectively [ P = .25]; average NND/expected NND: 0.74 ± 0.02 vs 0.73 ± 0.04 [ P = .59]; 0.5 mm from the foveal center).
| (29 Eyes of 29 Patients) | More Affected Side | Less Affected Side | P Value | |
|---|---|---|---|---|
| Vertically 0.5 mm | Cone density (cones/mm 2 ) | 26 578 ± 3482 | 25 926 ± 2100 | .56 |
| Ratio of hexagonal Voronoi domain (%) | 43.9 ± 4.5 | 46.6 ± 7.7 | .25 | |
| Average NND/expected NND | 0.74 ± 0.02 | 0.73 ± 0.04 | .59 | |
| Vertically 1.0 mm | Cone density (cones/mm 2 ) | 18 479 ± 2487 | 17 973 ± 1997 | .42 |
| Ratio of hexagonal Voronoi domain (%) | 44.1 ± 3.9 | 45.8 ± 8.8 | .48 | |
| Average NND/expected NND | 0.73 ± 0.02 | 0.75 ± 0.03 | .08 | |
| Diagonally 2.1 mm (temporal) | Cone density (cones/mm 2 ) | 16560 ± 3479 | 16 245 ± 2853 | .54 |
| Ratio of hexagonal Voronoi domain (%) | 41.9 ± 6.1 | 41.0 ± 5.3 | .57 | |
| Average NND/expected NND | 0.71 ± 0.02 | 0.71 ± 0.02 | .77 | |
| Diagonally 2.1 mm (nasal) | Cone density (cones/mm 2 ) | 15836 ± 2912 | 16 320 ± 3433 | .94 |
| Ratio of hexagonal Voronoi domain (%) | 44.2 ± 6.2 | 41.7 ± 2.5 | .29 | |
| Average NND/expected NND | 0.71 ± 0.02 | 0.72 ± 0.02 | .20 |
In all glaucomatous eyes, SDOCT revealed RNFL thinning ( Figures 2 and 3 ). The interobserver ICCs in normal eyes were 0.919 for the RNFL thickness, 0.729 for the INL thickness, 0.847 for the OPL + ONL thickness, and 0.876 for the photoreceptor layer thickness (n = 13; Table 6 ). The interobserver ICCs in eyes with glaucoma were 0.964 for of RNFL thickness, 0.956 for the INL thickness, 0.954 for the OPL + ONL thickness, and 0.838 for the photoreceptor layer thickness (n = 16; Table 6 ). The RNFL was significantly thinner in glaucomatous eyes than in healthy eyes at each distance from the center of the fovea ( Table 7 ; 16.3 ± 9.0 μm vs 27.5 ± 6.4 μm; P < .001; 0.5 mm from the center of the fovea). However, the groups did not differ in terms of INL thickness (51.9 ± 10.8 μm vs 50.4 ± 4.6 μm; P = .63; 0.5 mm from the center of the fovea), OPL + ONL thickness (97.8 ± 9.1 μm vs 96.4 ± 8.5 μm; P = .62; 0.5 mm from the center of the fovea), and photoreceptor layer thickness (69.9 ± 3.9 μm vs 70.4 ± 4.5 μm; P = .75; 0.5 mm from the center of the fovea) at each distance from the center of the fovea ( Table 7 ). The EZ band was continuous in all eyes—both healthy and glaucomatous ( Figures 1–3 ). In the 29 eyes with vertically asymmetric visual field loss, the more affected and less affected sides did not differ significantly in terms of INL, OPL + ONL, or photoreceptor layer thickness ( Table 8 ).
| Eyes | Intraclass Correlation Coefficients | |
|---|---|---|
| Interobserver Reproducibility | 95% Confidence Interval | |
| Normal | ||
| RNFL | 0.919 | 0.862–0.952 |
| INL | 0.729 | 0.563–0.831 |
| OPL + ONL | 0.847 | 0.748–0.856 |
| Photoreceptor layer | 0.876 | 0.794–0.927 |
| Glaucoma | ||
| RNFL | 0.964 | 0.942–0.978 |
| INL | 0.956 | 0.928–0.973 |
| OPL + ONL | 0.954 | 0.926–0.972 |
| Photoreceptor layer | 0.838 | 0.747–0.855 |
| Glaucoma (35 Eyes of 35 Patients) | Normal (21 Eyes of 21 Subjects) | P Value | |
|---|---|---|---|
| Vertically 0.5 mm | |||
| RNFL (μm) | 16.3 ± 9.0 | 27.5 ± 6.4 | <.001 |
| INL (μm) | 51.9 ± 10.8 | 50.4 ± 4.6 | .63 |
| OPL + ONL (μm) | 97.8 ± 9.1 | 96.4 ± 8.5 | .62 |
| Photoreceptor layer (μm) | 69.9 ± 3.9 | 70.4 ± 4.5 | .75 |
| Vertically 1.0 mm | |||
| RNFL (μm) | 15.1 ± 7.4 | 40.4 ± 6.8 | <.001 |
| INL (μm) | 47.6 ± 7.7 | 46.4 ± 4.7 | .59 |
| OPL+ONL (μm) | 90.4 ± 8.2 | 87.2 ± 8.4 | .24 |
| Photoreceptor layer (μm) | 64.8 ± 4.5 | 65.6 ± 4.8 | .58 |
| Diagonally 2.1 mm (temporal) | |||
| RNFL (μm) | 8.9 ± 8.1 | 30.6 ± 4.5 | <.001 |
| INL (μm) | 35.0 ± 6.2 | 34.4 ± 2.2 | .78 |
| OPL+ONL (μm) | 74.4 ± 9.5 | 76.0 ± 4.1 | .60 |
| Photoreceptor layer (μm) | 59.2 ± 5.1 | 59.5 ± 3.2 | .90 |
| Diagonally 2.1 mm (nasal) | |||
| RNFL (μm) | 13.7 ± 8.3 | 55.6 ± 11.7 | <.001 |
| INL (μm) | 38.0 ± 6.2 | 35.2 ± 3.1 | .19 |
| OPL+ONL (μm) | 78.5 ± 10.3 | 77.4 ± 7.4 | .76 |
| Photoreceptor layer (μm) | 61.7 ± 5.1 | 61.3 ± 4.8 | .84 |
Stay updated, free articles. Join our Telegram channel

Full access? Get Clinical Tree


