Purpose
To assess macular photoreceptor abnormalities in eyes with fundus albipunctatus with RDH5 mutation by using adaptive optics scanning laser ophthalmoscopy (AO-SLO).
Design
Prospective cross-sectional study.
Methods
Ten eyes with fundus albipunctatus and 11 normal eyes underwent a full ophthalmologic examination, microperimetry, spectral-domain optical coherence tomography (SD OCT), and imaging with a prototype AO-SLO system. Cone density and spatial organization of the cone mosaic were assessed using AO-SLO images. Statistical analysis was done using data from right eyes of all patients.
Results
Four patients had the same mutation in RDH5 (c.928delC/insGAAG), and 1 patient had a novel mutation in RDH5 (c.718delG). AO-SLO revealed the presence of small patchy dark areas representing cone loss in the macula of all eyes with fundus albipunctatus, including eyes for which fundus photographs showed no macular abnormalities and SD OCT did not reveal any visible defects in the photoreceptor layer. Compared to normal eyes, eyes with fundus albipunctatus demonstrated significantly lower cone density in areas at 0.5 mm from the center of the fovea ( P = .020). At 0.5 mm and 1.0 mm from the center of the fovea, eyes with fundus albipunctatus showed fewer cones with 6 neighbors ( P = .041 and P = .006). AO-SLO revealed hyperreflective mosaics surrounded by hyporeflective rings in areas corresponding to the retinal flecks.
Conclusions
Macular cone density is lower and the regularity of the macular cone mosaic spatial arrangement is disrupted in eyes with fundus albipunctatus. AO-SLO imaging is a sensitive quantitative tool for detecting photoreceptor abnormalities in eyes with fundus albipunctatus.
Fundus albipunctatus is a form of congenital night blindness with characteristic fundus and electrophysiological findings. Fundus findings include numerous yellow-white flecks deep in the retina, extending from the posterior pole (outer macular area) to the periphery. Dark adaptation is delayed for both rods and cones. Electroretinography (ERG) findings reflect the course of dark adaptation. When adequately adapted, normal psychophysical thresholds and ERG amplitudes are typically observed. Carr and associates demonstrated that the basic pathogenesis mechanism lay in markedly delayed regeneration of the rod and cone visual pigments.
Fundus albipunctatus follows an autosomal recessive pattern of inheritance. Many patients with fundus albipunctatus have defects in the 11-cis retinol dehydrogenase ( RDH5 ) gene, which is expressed predominantly in the retinal pigment epithelium (RPE) and encodes 11-cis retinol dehydrogenase. Deficiency of 11-cis retinol dehydrogenase in the RPE would slow the rate of photoreceptor recovery from a bleach. Retinaldehyde-binding protein 1 ( RLBP1 ) and retinal pigment epithelium–specific protein ( RPE65 ) are also reported to demonstrate causal mutations associated with fundus albipunctatus.
Fundus albipunctatus was originally considered a stationary disease. However, recent studies have shown that the disease is not stationary; cone visual function deteriorates and cone dystrophy may develop in a subset of patients. Studies using spectral-domain optical coherence tomography (SD OCT) have revealed details such as macular structural abnormalities in the outer retina and disruption of the line representing the junction of the photoreceptor inner and outer segments (IS/OS) in several patients with fundus albipunctatus. These imaging modalities have not, however, provided sufficiently clear images of individual photoreceptor cells to allow identification of a specific structural abnormality that might underlie the pathogenesis of fundus albipunctatus.
The primary reason for this failure is that ocular optics possess aberrations, which can be compensated for by incorporating adaptive optics (AO)—specifically, either OCT or another imaging technique such as scanning laser ophthalmoscopy (SLO)—into the imaging system. An AO system consists of a wavefront sensor that measures aberrations of the whole eye and a deformable mirror or a spatial light modulator that compensates for these aberrations in living eyes. The addition of AO to imaging systems such as flood-illuminated ophthalmoscopes or SLO provides clear images of microstructural details in living eyes, including abnormalities in individual cone photoreceptors in patients with various retinal diseases.
Here, we used a prototype AO-SLO system that we developed to examine the photoreceptors of eyes with fundus albipunctatus associated with RDH5 mutation and compared the pathologic changes we saw with abnormalities on images obtained by other modalities, focusing on cone density and cone arrangement.
Methods
All study investigations adhered to the tenets of the Declaration of Helsinki, and this study was approved by the Institutional Review Board and the Ethics Committee of Kyoto University Graduate School of Medicine. The nature of the study, the implications of participating in this research study, and the possible consequences of such participation were explained to the study candidates. Written informed consent was obtained from all participants.
Participants
Twenty-one eyes of 16 participants were included in this prospective cross-sectional study. Five participants were patients (10 eyes, 4 men and 1 woman from 4 families; mean age, 29.6 years; range, 15-64 years) with fundus albipunctatus associated with RDH5 mutation, who all visited the Kyoto University Hospital, Kyoto, Japan, between August 2011 and July 2012. The other 11 participants were healthy volunteers (11 eyes; 9 men and 2 women; mean age, 32.8 years; range, 20-40 years) with no eye disease. Fundus albipunctatus was diagnosed on the basis of the presence of congenital stationary night blindness, fundus appearance (presence of numerous yellow-white punctate retinal flecks), and electroretinographic abnormalities. ERG was recorded according to the ISCEV standard protocol recommended in 2008 using LS-C (Mayo Co, Nagoya, Japan) and Neuropack MEB-2204 systems (Nihon Kohden, Tokyo, Japan). Prolonged dark adaptation was also performed in 2 patients (Patient 1 and Patient 3) for diagnosis. Only patients with fundus albipunctatus associated with RDH5 mutation were included in this study.
Ophthalmologic Examinations
All subjects underwent, at the same visit for each participant, comprehensive ophthalmologic examination, including best-corrected visual acuity (BCVA) assessment with the Landolt chart (the obtained value was expressed as the logarithm of the minimal angle of resolution [logMAR]), intraocular pressure, axial length assessment using an IOL Master (Carl Zeiss Meditec, Dublin, California, USA), indirect ophthalmoscopy, slit-lamp biomicroscopy with a contact lens, microperimetry (MP), color fundus photography, infrared reflectance, fundus autofluorescence (FAF), SD OCT, and AO-SLO.
IR and FAF were acquired using a confocal SLO (Spectralis HRA+OCT; Heidelberg Engineering, Heidelberg, Germany). The IR images were obtained using an 820-nm light stimulus. The FAF images were obtained using an excitation light of 488 nm and a barrier filter beginning at 500 nm. The field of view was set to 30 degrees × 30 degrees centered on the macula.
SD OCT was conducted using a Spectralis HRA+OCT (Heidelberg Engineering). Horizontal, vertical, and radial line scans through the foveal center were obtained at a 30-degree angle, and 20-100 SD OCT images were acquired and averaged to reduce speckle noise.
Analysis of Adaptive Optics Scanning Laser Ophthalmoscopy Images: Cone Mosaic Features
We developed an original prototype AO-SLO system in collaboration with Canon Inc (Tokyo, Japan) and used it in this study. The details of the AO-SLO system are described in the Supplementary Material (available at AJO.com ).
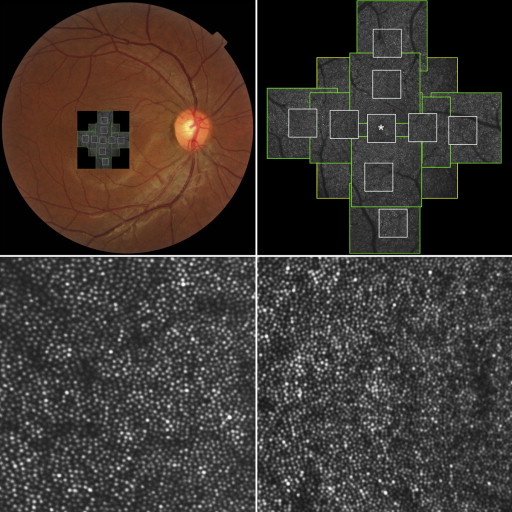
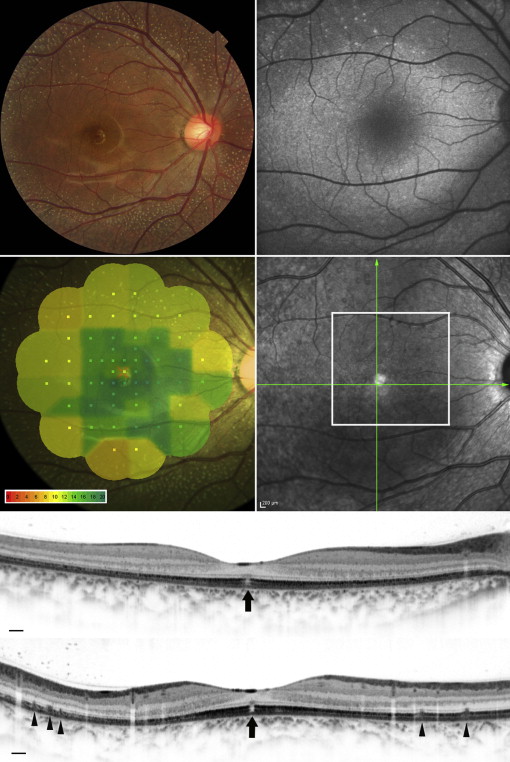
For each eye, we acquired a series of AO-SLO images in the macula. First, 3 different field-of-view images (L: 1700 × 1700 μm; M: 820 × 820 μm; S: 340 × 340 μm) centered on the center of the fovea were obtained, followed by 2 field-of-view images (M and S) centered 0.5 mm and 1.0 mm from the center of the fovea in each direction (superior, nasal, inferior, temporal) ( Figure 1 ). At each location of interest, 32 images were acquired and averaged to reduce noise. Then, offline, a montage of AO-SLO images was created for each eye by selecting the area of interest and generating each image included in the montage from averaged images. The montage of AO-SLO images was used for registration of images from other imaging modalities by matching the shape of the vessels.
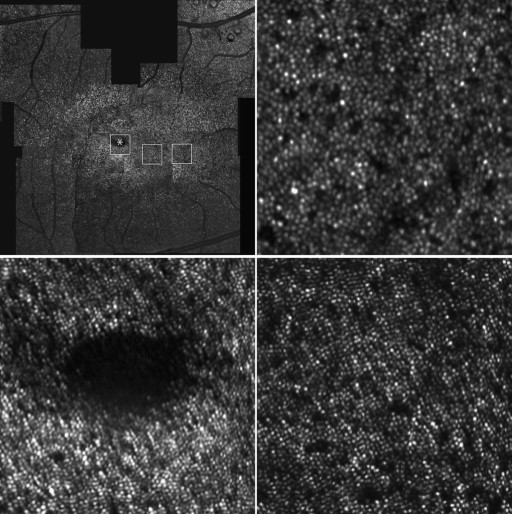
To evaluate cones, we applied the automated cone labeling process of Li and Roorda. After automated cone labeling, an experienced observer examined each image. The area for quantification (80 × 80 μm) was identified manually by selecting the area without vascular shadows and by placing the computer cursor on the area to be quantified. This method has been used in other studies, and inter-observer reproducibility was high in normal eyes as well as in patients with retinitis pigmentosa. As has been reported for similar systems, we found that our system did not always allow clear visualization of individual cones within much of the central fovea. However, we could clearly distinguish individual cones >0.2 mm from the center of the fovea. Therefore, we obtained an estimate of cone density in areas 0.5 mm and 1.0 mm from the foveal center by dividing the number of cones in each imaging area by the size of the area. The center of the fovea, defined as the center of the foveal avascular zone, was determined from the montage of AO-SLO images. We measured cone density in each of 4 directions (superior, lower, nasal, and temporal) using high-resolution S-size images (340 × 340 μm). To obtain accurate scan lengths, we corrected the magnification effect in each eye by using the adjusted axial length method reported by Bennett and associates.
To assess the spatial organization of the cone mosaics, the nearest-neighbor distances and Voronoi domains associated with the cones in each mosaic were examined. Voronoi domains were constructed for each cell by defining points in the regions that were closer to that cell than to any other cell in the mosaic. The nearest-neighbor distances were determined by calculating the minimum distances from the center of that cell to the centers of every other cell in the mosaic. Expected nearest-neighbor distance was calculated as the expected value for a perfectly hexagonally packed mosaic with a density equal to that in each location.
Microperimetry
We used fundus-monitoring MP to measure retinal sensitivity. MP-1 software (NIDEK, Padova, Italy) was set to automatically track fundus movements and evaluate every acquired frame for shifts in the directions of the x- and y-axes of the fundus with respect to a reference image obtained by an infrared camera at the beginning of the examination.
We used a 4-2-staircase strategy with Goldmann size III stimulus against a white background with illumination of 1.27 cd/m 2 to examine 57 stimulus locations covering the central 20 degrees. Differential luminance, defined as the difference between stimulus luminance and background luminance, was 127 cd/m 2 at 0 dB stimulation, and maximum stimulus attenuation was 20 dB. The stimulus duration was 200 ms. Mean retinal sensitivity was calculated in 9 separate areas (based on Early Treatment Diabetic Retinopathy Study [ETDRS] sectors) within the macula ( Supplementary Figure 1 , available at AJO.com ). Retinal sensitivity on the border between sectors was included in the counterclockwise sector.
Genetic Analysis
Genomic DNAs were prepared from peripheral blood using a DNA extraction kit (QuickGene-610L; Fujifilm, Minato, Tokyo, Japan) according to the manufacturer’s protocol, and the A260/A280 optical density was evaluated. All coding exons, namely exons 2, 3, 4, and 5 of the RDH5 gene (Gene ID 5959, NM_002905.3 ), were amplified by polymerase chain reaction using primer pairs described in a previous study. Sanger sequencing was performed with BigDye 3.1 and 3130× Genetic Analyzer (Applied Biosystems Inc, Foster City, California, USA). The genomic sequences were compared with public databases.
Statistical Analysis
Statistical analysis was done using data from right eyes of all patients. Age, logMAR, cone density, and nearest-neighbor distance and Voronoi parameters were compared using the Mann-Whitney U test. We compared the sex distribution of subjects using the Pearson χ 2 test. The Spearman rank correlation coefficient was calculated to determine associations between retinal sensitivity and cone density, nearest-neighbor distance, and Voronoi parameters. Statistical analyses were performed using SPSS software version 19.0 (SPSS, Inc, Chicago, Illinois, USA). P values less than .05 were considered statistically significant.
Results
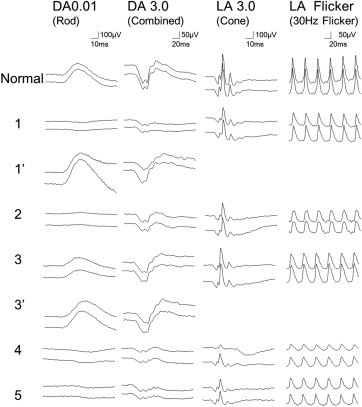
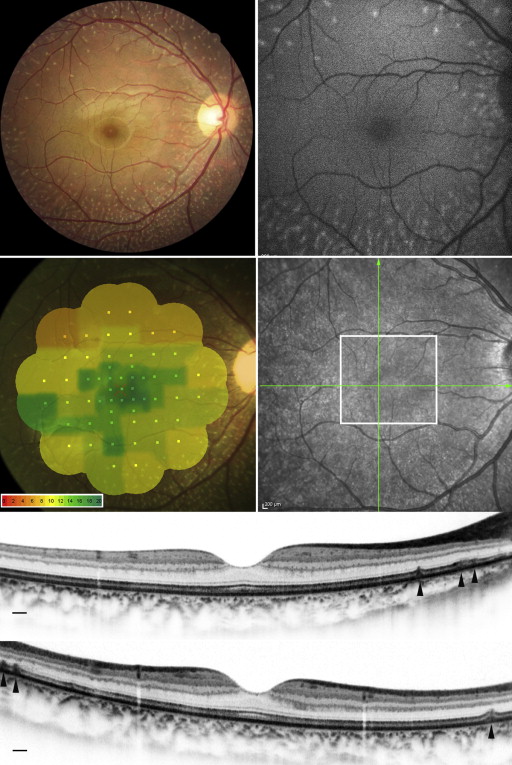
The clinical characteristics of each patient are summarized in Table 1 . Four patients from 3 families had the same mutation in RDH5 (c.928delC/insGAAG). One patient had a different, novel mutation in the RDH5 gene (c.718delG) ( Supplementary Figure 2 , available at AJO.com ). Dark-adapted 0.01 ERG (full field) with standard dark adaptation showed reduced or extinguished response ( Figure 2 ). Light-adapted 3.0 and flicker ERG were subnormal or normal. Dark-adapted 0.01 and 3.0 ERG response after prolonged dark adaptation were normal in Patient 1 and Patient 3. Yellow-white punctate retinal flecks were seen at least 1.5 mm apart from the center of the fovea in all eyes ( Figures 3-6 ). FAF revealed increased autofluorescence corresponding to some of the retinal flecks in 8 of 10 eyes ( Figures 3 and 5 ). Both eyes in Patient 3 (aged 64 years) showed no increased autofluorescence in the area of retinal flecks.
| Patient No./Sex/Age (y) | IP | RDH5 Mutation | Eye | Visual Acuity | AL (mm) | 0.5 mm | 1.0 mm | ||||
|---|---|---|---|---|---|---|---|---|---|---|---|
| Cone Density (Cells/mm 2 ) | Ratio of Hexagonal Voronoi Domains (%) | Average NND/Expected NND | Cone Density (Cells/mm 2 ) | Ratio of Hexagonal Voronoi Domains (%) | Average NND/Expected NND | ||||||
| 1/M/32 | AR | c.718delG (p.A240Pfs*7) | OD | 20/15 | 23.61 | 12 468 | 37.3 | 0.65 | 13 472 | 34.0 | 0.64 |
| OS | 20/15 | 23.60 | 13 849 | 39.0 | 0.64 | 13 290 | 36.2 | 0.63 | |||
| 2/F/20 | Spo | c.928delC/insGAAG (p.L310-Q311delinsEVQ) | OD | 20/25 | 22.25 | 19 763 | 42.2 | 0.68 | 15 640 | 37.3 | 0.63 |
| OS | 20/15 | 22.23 | 19 071 | 40.3 | 0.65 | 13 108 | 36.9 | 0.61 | |||
| 3/M/64 | Spo | c.928delC/insGAAG (p.L310-Q311delinsEVQ) | OD | 20/15 | 23.06 | 19 410 | 38.4 | 0.67 | 13 149 | 42.2 | 0.68 |
| OS | 20/15 | 22.80 | 21 695 | 37.6 | 0.70 | 14 137 | 37.0 | 0.66 | |||
| 4/M/17 | AR a | c.928delC/insGAAG (p.L310-Q311delinsEVQ) | OD | 20/15 | 22.53 | 23 725 | 40.6 | 0.71 | 15 644 | 37.4 | 0.71 |
| OS | 20/15 | 22.44 | 25 546 | 45.4 | 0.71 | 15 822 | 43.3 | 0.73 | |||
| 5/M/15 | AR b | c.928delC/insGAAG (p.L310-Q311delinsEVQ) | OD | 20/15 | 23.47 | 17 905 | 42.7 | 0.69 | 12 652 | 39.2 | 0.68 |
| OS | 20/15 | 23.19 | 19 404 | 39.6 | 0.71 | 11 853 | 41.7 | 0.68 | |||
The patient and volunteer groups in this study did not statistically differ in sex ( P = .931), age ( P = .173), or logMAR BCVA ( P = .602) ( Table 2 ).
| Fundus Albipunctatus (5 Eyes of 5 Patients) | Normal (11 Eyes of 11 Subjects) | P | |
|---|---|---|---|
| Sex | Male 4 Female 1 | Male 9 Female 2 | .931 a |
| Age (y) | 29.6 ± 20.3 | 32.8 ± 6.6 | .173 b |
| logMAR VA | −0.13 ± 0.12 | −0.17 ± 0.06 | .602 b |
| 0.5 mm | |||
| Cone density (cones/mm 2 ) | 18 654 ± 4073 | 22 905 ± 1596 | .020 b |
| Ratio of hexagonal Voronoi domains (%) | 40.2 ± 2.3 | 43.4 ± 3.0 | .041 b |
| Average NND/expected NND | 0.68 ± 0.02 | 0.72 ± 0.03 | .010 b |
| 1.0 mm | |||
| Cone density (cones/mm 2 ) | 14 111 ± 1427 | 15 588 ± 588 | .079 b |
| Ratio of hexagonal Voronoi domains (%) | 38.0 ± 3.00 | 45.8 ± 4.3 | .006 b |
| Average NND/expected NND | 0.67 ± 0.03 | 0.73 ± 0.02 | .005 b |
AO-SLO revealed the presence of small patchy dark areas representing cone loss in the macula of all eyes with fundus albipunctatus, including eyes in which fundus photographs showed no macular abnormalities and SD OCT did not reveal visible defects in the photoreceptor layer ( Figure 4 ). One eye demonstrated microhole-like photoreceptor defect in the fovea both on AO-SLO and on SD OCT ( Figure 6 ). In eyes with fundus albipunctatus, cone density was significantly lower in the area at 0.5 mm from the center of the fovea compared to normal eyes ( P = .020) ( Table 2 ). At 0.5 mm and 1.0 mm from the center of the fovea, a decreased number of cones had 6 neighbors in eyes with fundus albipunctatus ( P = .041 and P = .006). The ratio of observed mean nearest-neighbor distance for each subject divided by expected nearest-neighbor distances (computed assuming a perfectly hexagonal lattice of cones with a density equal to that observed for a given subject) was significantly lower for eyes with fundus albipunctatus than for normal eyes at 0.5 mm and 1.0 mm from the center of the fovea ( P = .010 and P = .005).
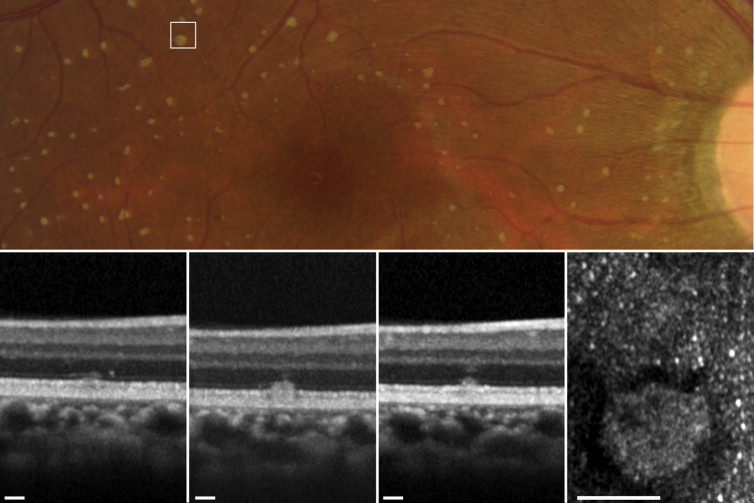
SD OCT showed hyperreflective lesions (n = 165) in areas corresponding to the retinal flecks seen on fundus photography ( Figures 3 and 5 ). These hyperreflective lesions were observed as mounds of accumulated material between the RPE and the outer nuclear layer (ONL) ( Supplementary Figure 3 , available at AJO.com ). Most lesions (142/165; 86.1%) were located above the RPE and below the external limiting membrane (ELM) ( Supplementary Table , available at AJO.com ). However, some lesions broke through the ELM boundary.
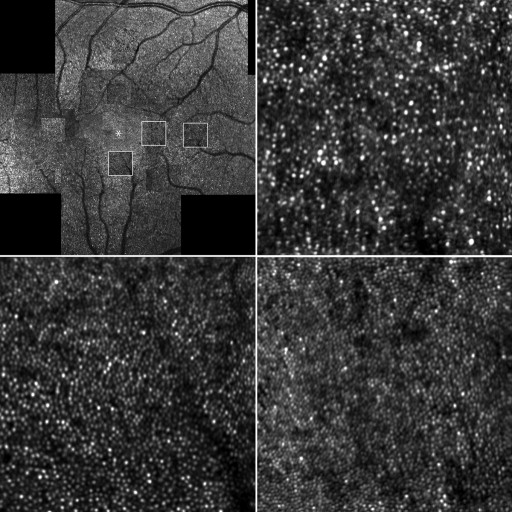
AO-SLO showed hyperreflective mosaics surrounded by hyporeflective rings in areas corresponding to the retinal flecks on fundus photography ( Figure 7 ). These hyperreflective mosaics were similar to the surrounding cone mosaics. However, the density and ratio of observed mean nearest-neighbor distance divided by expected nearest-neighbor distance significantly differed between the inside and outside of the areas corresponding to the retinal flecks ( P < .001 and P = .042) ( Table 3 ).
| Inside the Retinal Flecks | Outside the Retinal Flecks | P a | |
|---|---|---|---|
| Density (numbers/mm 2 ) | 23 375 ± 3256 | 16 993 ± 2437 | <.001 |
| Ratio of hexagonal Voronoi domains (%) | 41.92 ± 10.86 | 39.97 ± 4.40 | .594 |
| Average NND/expected NND | 0.69 ± 0.03 | 0.67 ± 0.02 | .042 |
Mean retinal sensitivity was significantly lower in areas with retinal flecks compared to areas lacking them (11.2 ± 2.6 dB and 13.9 ± 3.1 dB, P < .001). Retinal sensitivities were not significantly correlated with cone density ( P = .399), hexagonal Voronoi domains ( P = .686), or ratio of nearest-neighbor distance ( P = .865) at 0.5 mm from the center of the fovea.
Results
The clinical characteristics of each patient are summarized in Table 1 . Four patients from 3 families had the same mutation in RDH5 (c.928delC/insGAAG). One patient had a different, novel mutation in the RDH5 gene (c.718delG) ( Supplementary Figure 2 , available at AJO.com ). Dark-adapted 0.01 ERG (full field) with standard dark adaptation showed reduced or extinguished response ( Figure 2 ). Light-adapted 3.0 and flicker ERG were subnormal or normal. Dark-adapted 0.01 and 3.0 ERG response after prolonged dark adaptation were normal in Patient 1 and Patient 3. Yellow-white punctate retinal flecks were seen at least 1.5 mm apart from the center of the fovea in all eyes ( Figures 3-6 ). FAF revealed increased autofluorescence corresponding to some of the retinal flecks in 8 of 10 eyes ( Figures 3 and 5 ). Both eyes in Patient 3 (aged 64 years) showed no increased autofluorescence in the area of retinal flecks.


