Purpose
To evaluate a new computerized segmentation technique for the quantification of intraretinal and subretinal fluid in spectral-domain optical coherence tomography (SD OCT) images of the retina.
Design
Prospective, cross-sectional study.
Methods
Thirty-seven B-scan images of 37 patients with exudative age-related macular degeneration were chosen randomly from SD OCT volume scans (1 per volume scan). All hyporeflective areas in the image first were segmented automatically as candidate regions by the program. Researchers who were masked to the candidate region information selected each fluid region from the original image using a single mouse click. The program then delineated the boundary of each region selected and calculated quantitative parameters, including total area of fluid regions if multiple regions were selected. The performance of our technique was validated by comparing the results with the measurements obtained from boundaries manually delineated by 2 masked observers. Time efficiency, agreement with manual delineation, and intraobserver and interobserver agreement of using the program were evaluated.
Results
The proposed technique reduced the average processing time per image approximately 6-fold (15 seconds for computerized segmentation vs 90 seconds for manual delineation). There was good agreement between computerized segmentation and manual delineation measured by intraclass correlation coefficient (range, 0.897 to 0.979) and the Dice coefficient (range, 0.721 to 0.785). The proposed technique has excellent intraobserver and interobserver agreement (intraclass correlation coefficient range, 0.998 to 0.999; Dice coefficient range. 0.959 to 0.981).
Conclusions
This computerized segmentation method allows for accurate and fast quantification of fluid in retinal SD OCT images and could assist in monitoring disease progression and evaluating therapeutic intervention.
Optical coherence tomography (OCT) is a noninvasive imaging technique that provides information on the structural status of retinal tissue in vivo with resolution of individual retinal and subretinal layers. Since its invention in 1991 and application in human retinal imaging, OCT has become an indispensable tool in the diagnosis and management of exudative macular diseases such as diabetic maculopathy, age-related macular degeneration (AMD), and central serous chorioretinopathy. To assess disease severity and progression, clinicians currently rely on qualitative assessments of the distribution and extent of intraretinal fluid (IRF) and subretinal fluid (SRF), seen as hyporeflective spaces on OCT. In image grading centers, manual measurement is adopted, but to a limited extent because practically it is not feasible to draw the boundary of each hyporeflective space.
Automated quantification techniques have the potential to improve early disease detection and patient monitoring and to optimize treatment strategies. Despite the rapid evolution of acquisition techniques, the development of automated quantitative analyses of OCT images is still in its infancy. Analysis software offered by commercial instruments only quantifies retinal thickness and estimates total volume. This analysis lacks consistency across manufacturers, often is inaccurate, and relies on the subjective manual placement of calipers. These limitations have hampered the objective quantification of IRF and SRF and can result in variability in clinician decision making. Techniques for automated segmentation of IRF alone recently were described.
We developed a technique that uses computerized segmentation combined with minimal expert interaction to allow for fast and accurate quantification of both IRF and SRF on spectral-domain (SD) OCT images and investigated its performance in routine clinical practice.
Methods
The Research Development and Innovation Directorate and the Ethics Committee of the Royal Liverpool and Broadgreen University Hospitals approved this prospective, cross-sectional study. All procedures conformed to the tenets of the Declaration of Helsinki and were conducted in accordance with the approved research protocol. Informed consent for research use of data was sought and obtained from each study participant before participation.
Image Set
The SD OCT volume scans, acquired on a Spectralis HRA+OCT device (Heidelberg Engineering, Heidelberg, Germany), were collected prospectively at the St. Paul’s Eye Unit, Royal Liverpool University Hospital, between 2009 and 2010. A total of 37 SD OCT volume scans collected from 37 patients with exudative AMD (1 eye per patient, 16 right eyes, 20 women) were examined. The mean age was 78.8 years (range, 60 to 88 years; standard deviation, 0.4). The exudative AMD lesion types included were: classic choroidal neovascularization (n = 18), occult no classic (n = 14), and retinal angiomatous proliferation (n = 5). A single B-scan image that showed features of IRF, SRF, or both was selected randomly from each data set and was exported in tagged image file format (TIFF) at a height of 496 pixels.
The B-scans were heterogeneous in terms of acquisition parameters because of patient variability. The mean image quality score was 22.1 ± 4.1 dB (range, 0 [no signal] to 40 [excellent]). The scan rate was 40 000 A-scans/second. Thirty-one images had an automatic real-time setting of 9 frames, 3 images had 10 frames, 2 images had 5 frames, and 1 image had 2 frames. In addition, a volume scan (39 B-scans, 496 × 1024 pixels per B-scan) was used for 3-dimensional visualization of the detected fluid regions.
Computerized Assessment
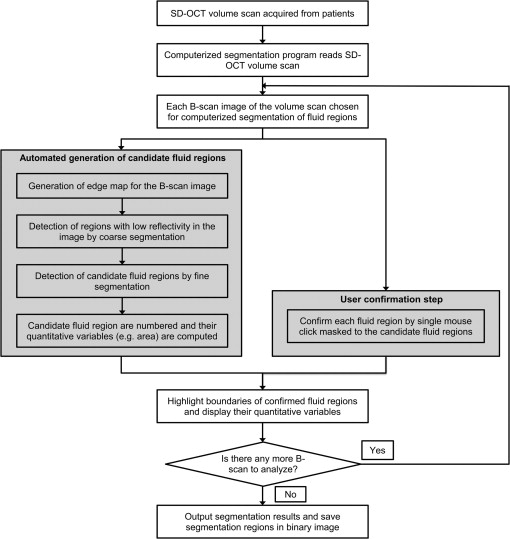
A computerized program was developed that detects all fluid regions on SD OCT and displays and calculates their quantitative features on a volume scan in an automated manner. The segmentation was achieved on a scan-by-scan basis. In brief, for each B-scan image of the volume scan, all candidate regions were generated automatically by a 4-step process described below, and the true fluid regions were confirmed by a potential expert user. The confirmed IRF and SRF regions then were displayed, and their quantitative variables were computed and then summed to give the overall measurements. For user convenience, a customized graphical user interface was developed to perform these tasks. This process is described in detail below.
Automatic generation of candidate fluid regions
A 4-step process was designed comprising preprocessing, coarse segmentation, fine segmentation, and quantitative analysis. Preprocessing comprised identification of the SD OCT image ( Figure 1 , Top left; this required removal of an intraretinal fundus image attached to the SD OCT platform studied) followed by generation of the edge map of the SD OCT image ( Figure 1 , Top right). In the coarse segmentation step, both the original and the edge map then were fed into a fast variational segmentation algorithm. This algorithm treats segmentation as an energy minimization problem where the energy under consideration comprises 2 parts: the first is a gradient-regularized length function ensuring that the length of the boundary is minimal, and the second is a region term ensuring that each region has a uniform intensity. This energy is globally convex, which implies that its optimal solution is unique, regardless of the initialization. As such, it outperforms more conventional level set methods in terms of reliability. The use of the fast Split-Bregman optimization technique allows for almost real-time segmentation. This algorithm set was adopted for speed, robustness, and applicability. Further mathematical details are described elsewhere. Pixels were classified in the resulting image as: (1) high reflectivity marked as background in black, and (2) low reflectivity marked as object in white ( Figure 1 , Bottom left).
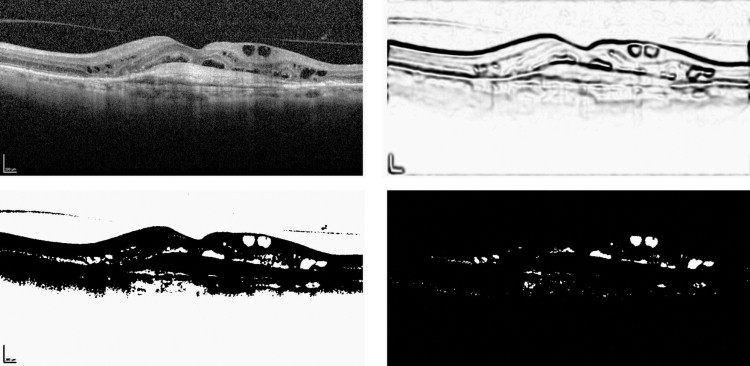
In fine segmentation, all detected IRF and SRF regions first were refined by a morphologic hole-filling operation to retrieve those pixels within each region that were undetected because of uneven reflectivity distribution. Candidate regions outside the retina were removed through a series of morphologic operations in which the retina was estimated as the largest background object ( Figure 1 , Bottom left), resulting in the final candidate set being demonstrated ( Figure 1 , Bottom right). In the fourth step, candidate IRF and SRF regions were numbered and their areas (number of pixels) were derived using a computational quantitative analysis.
Interactive selection of fluid regions
After the automatic generation of the candidate IRF and SRF regions, the potential expert users manually selected each region perceived to be IRF or SRF regions on the original B-scan, using a single click of the mouse. If this seed point was within any of the candidate regions, the contour of the corresponding region was highlighted for visualization, and the quantitative parameters of this region, such as area, height, width, and mean intensity, were also calculated. In images with multiple IRF and SRF regions, the selection process was repeated for all regions. Quantitative values were generated for each individual IRF or SRF region followed by the overall value if multiple IRF and SRF regions were detected.
We used our previously published definitions of IRF and SRF. IRF was defined as an intraretinal hyporeflective space surrounded by reflective septae, and SRF was defined as separation of the neuroretina from the outer high reflectivity band by a well-defined hyporeflective space.
The workflow of the process is shown in Figure 2 . The system was developed with commercial software (Matlab R14; The Mathworks Inc, Natick, Massachusetts, USA), and segmentation tasks were run on a personal computer with an Intel 2.66-GHz Core 2 Duo processor (Intel Corporation, Mountain View, California, USA) and 3.25 GB of RAM, using Windows XP Service Pack 2 (Microsoft Corporation, Redmond, Washington, USA).
Validation of the Technique
The technique was evaluated against an independent manual reference standard of IRF and SRF delineation determined by 2 masked retinal specialists (C.C. and A.N.S.) using ImageJ software version 1.45 (Wayne Rasband, National Institutes of Health, Bethesda, Maryland, USA). Both observers received training on boundary tracing. To assess the intraobserver repeatability of manual delineation, both observers independently repeated the same segmentation task with an interval of at least 1 week. Similarly, to assess the intraobserver and interobserver agreement of the proposed computerized segmentation technique, 2 different observers (A.R. and Y.Z.) independently performed segmentation tasks twice on the same data set with an interval of at least 1 week. Efficiency of the proposed segmentation technique was measured as the reduction of processing time compared with manual segmentation.
Reliability analysis using the intraclass correlation was performed using Statistical Package for Social Scientists software version 17.0 (SPSS Inc, Chicago, Illinois, USA) on the total area of fluid of the validation data set. A P value less than .05 was considered statistically significant.
In addition to area-based reliability analysis, we compared the computerized and manual methods in terms of overlap between different segmentations. Overlap can be seen as a more rigorous measure of agreement between 2 segmentations than size difference, because the latter may be 0 for 2 completely different segmentations. For this study, the Dice coefficient was used. Seen as a special case of the κ statistic, the Dice coefficient is defined as the ratio of the size of the intersection over the mean size of 2 different segmentations. The Dice coefficient ranges from 0 (no agreement) to 1 (perfect agreement). It is generally accepted that a Dice coefficient value higher than 0.70 indicates excellent agreement. The Dice coefficient values were computed using our customized Matlab program.
Results
As expected, our computerized technique considerably reduced the time required to conduct the task compared with the fully manual method. On average, it took approximately 90 to 150 seconds per B-scan image for retinal specialists to perform the manual delineation task, whereas the average segmentation time using our computerized technique was reduced to approximately 15 seconds ( Table 1 ). On average, it only took 1.14 seconds per scan for our proposed method to generate all the candidate regions and to compute their quantitative parameters from each single B-scan. The time it took for both the retinal specialist (A.R.) and the nonspecialist (Y.Z.) to perform segmentation using the proposed technique was similar.
| Test | Manual Segmentation | Computerized Segmentation | ||
|---|---|---|---|---|
| Observer 1 (C.C.) | Observer 2 (A.N.S.) | Observer 3 (A.R.) | Observer 4 (Y.Z.) | |
| First test | 137.8 (79.8) | 89.2 (43.9) | 15.8 (12.7) | 12.8 (8.2) |
| Second test a | 145.9 (76.9) | 87.6 (43.8) | 14.1 (10.0) | 12.1 (6.6) |
a There was a minimum interval of 1 week between each observer performing the first and the second tests.
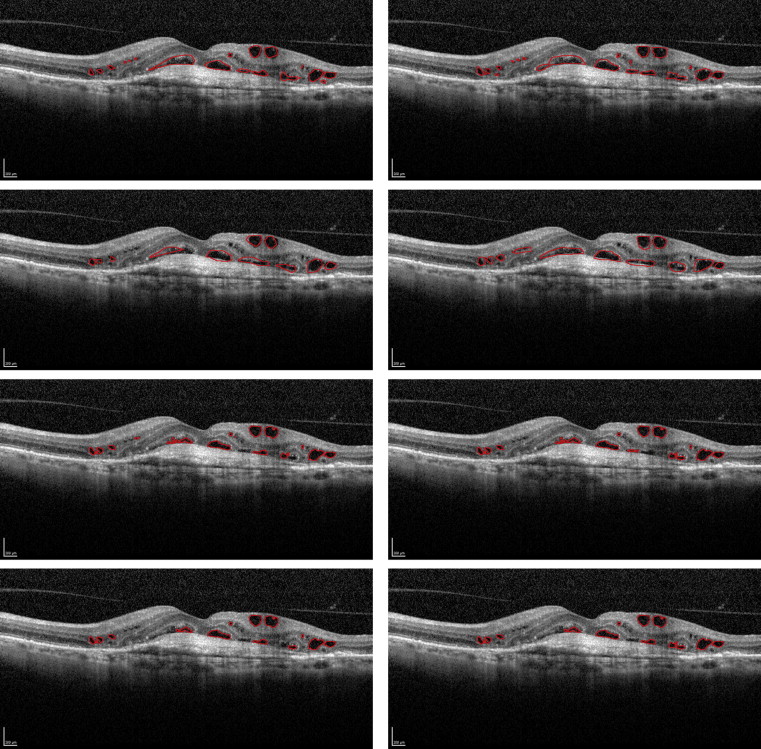
The mean area of fluid detected (number of pixels) for manual and computerized segmentation is shown in Table 2 , including the intraobserver repeatability tests. Figure 3 illustrates the segmentation results of the 2 methods for the 2 tests performed by each observer. Table 3 shows intraclass correlation coefficient values based on repetition by 4 observers for each segmentation strategy, respectively. These values calculated are for: (1) manual segmentation by 2 experts; (2) manual segmentation against computerized segmentation; and (3) computerized segmentation by 2 experts. Table 3 demonstrates good agreement between computerized and manual delineation (intraclass correlation coefficient range, 0.897 to 0.979), and an improved intraobserver and interobserver consistency of the computerized strategy (intraclass correlation coefficient range, 0.998 to 0.999) as compared with manual delineation (intraclass correlation coefficient range, 0.898 to 0.990).
| Test | Manual Segmentation | Computerized Segmentation | ||
|---|---|---|---|---|
| Observer 1 (C.C.) | Observer 2 (A.N.S.) | Observer 3 (A.R.) | Observer 4 (Y.Z.) | |
| First test | 5903 (5869) | 6379 (6033) | 5171 (5375) | 5115 (5341) |
| Second test a | 5765 (5597) | 6386 (6139) | 5173 (5359) | 5129 (5249) |
a There was a minimum interval of 1 week between each observer performing the first test and the second test.
| Observer | Manual Segmentation | Computerized Segmentation | ||||||
|---|---|---|---|---|---|---|---|---|
| A.N.S.1 | A.N.S.2 a | C.C.1 | C.C.2 a | A.R.1 | A.R.2 a | Y.Z.1 | Y.Z.2 a | |
| A.N.S.1 | 1.000 | |||||||
| A.N.S.2 a | 0.990 b | 1.000 | ||||||
| C.C.1 | 0.980 | 0.977 | 1.000 | |||||
| C.C.2 a | 0.898 | 0.902 | 0.919 b | 1.000 | ||||
| A.R.1 | 0.956 | 0.950 | 0.979 | 0.905 | 1.000 | |||
| A.R.2 a | 0.957 | 0.952 | 0.979 | 0.905 | 1.000 b | 1.000 | ||
| Y.Z.1 | 0.953 | 0.948 | 0.972 | 0.900 | 0.998 | 0.999 | 1.000 | |
| Y.Z.2 a | 0.952 | 0.946 | 0.973 | 0.897 | 0.998 | 0.999 | 0.999 b | 1.000 |
a There was a minimum interval of 1 week between each observer performing the first test and the second test.
b Cells highlighted in grey denote intraobserver repeatability; the remaining cells denote interobserver reproducibility.
Stay updated, free articles. Join our Telegram channel

Full access? Get Clinical Tree


