Purpose
To assess the visualization of the retinal microvasculature with intravenous fluorescein angiography (IVFA) compared to the Retinal Function Imager (RFI).
Design
Multicenter, retrospective, observational case series.
Methods
Seven normal eyes and 26 eyes with various ocular diseases were imaged with both IVFA and the RFI. The ability to assess vessel loops, vertical collateral vessels, the size of the foveal avascular zone (FAZ), and degree of vessel branching were compared between IVFA and RFI images.
Results
The RFI visualized a greater number of vessel loops (1.3 vs 0.4 per eye) and vertical collateral vessels (4.42 vs 0.97 per eye) than IVFA. On average, higher order of vessel branching was seen with the RFI compared to IVFA (5.2 vs 4.6). The foveal avascular zone (FAZ) was more clearly delineated using the RFI and was significantly smaller when measured on RFI (0.35 vs 0.75 mm 2 ).
Conclusions
RFI, a noninvasive retinal imaging instrument, revealed vessel loops, vertical collateral vessels, the area of the FAZ, and order of vessel branching in greater detail than IVFA. This instrument may be helpful in understanding dynamic retinal vascular changes in a number of common ocular diseases, as well as in normal eyes.
Intravenous fluorescein angiography (IVFA) is integral to the diagnosis and treatment of diseases affecting the retinal blood vessels. Although IVFA is the gold standard for evaluation of the retinal circulation, it necessitates intravenous injection of a contrast dye; and although uncommon, adverse reactions to the fluorescein dye can be severe, including anaphylaxis. Finding venous access may also be difficult and time-consuming in certain patients. IVFA is also relatively contraindicated during pregnancy. Finally, IVFA is unable to accurately measure retinal blood flow, which may be of interest when assessing the severity and disease course of various retinal vasculopathies.
For these reasons, other noninvasive imaging technologies have been developed. The Retinal Function Imager (RFI) (Optical Imaging, Rehovot, Israel; and Topcon Imaging, Oakland, New Jersey, USA) is a novel imaging technique that visualizes the retinal microvasculature noninvasively by using red blood cell motion as an intrinsic contrast. Hemoglobin within red blood cells provides a natural chromophore without the need for intravenous contrast dye. This also allows visualization and mapping of capillaries that are indistinct or invisible using other imaging modalities.
In this study, we compare and contrast features seen on images from the RFI and IVFA in normal eyes and eyes with a variety of retinal diseases.
Methods
The study design was a retrospective case series. The Institutional Review Boards at the Wills Eye Institute and the Shiley Eye Center (University of California at San Diego) approved this study as a retrospective chart review. Patients referred for IVFA were additionally imaged with the RFI after their verbal consent. RFI and IVFA images were obtained for analysis from the same eye on the same day. RFI was performed prior to IVFA. Normal eyes and eyes with a wide variety of diseases were imaged.
Patients were excluded from analysis if they did not have both IVFA and RFI images available, or if the quality of the images was deemed insufficient for comparison. The RFI is very sensitive to media opacities and requires a high degree of patient cooperation. Of note, RFI images from 11 patients were excluded because of poor image quality from media opacity, poor fixation, or high refractive error. An additional number of patients did not receive IVFA imaging after RFI imaging because of difficulty obtaining clear images, and were not included in the study.
The RFI instrumentation has been described in detail in previous publications, but is briefly summarized here. It consists of a standard fundus camera, to which a customized high-speed stroboscopic flash lamp has been added; the camera captures 35-degree snapshots of the posterior pole. Eight consecutive flashes with an inter-flash interval of ∼20 ms are delivered to obtain 8 sequential fundus images. Using integrated software, these sequential images are aligned to each other and a signal-averaged noninvasive capillary perfusion map (nCPM) image is generated. Capillaries often appear more distinct than larger vessels on nCPM images because motion blurring of red blood cell clusters occurs to a greater extent in larger vessels.
Digital IVFA images were captured using 1 of 2 instruments. The Heidelberg Spectralis FA+OCT (Heidelberg Engineering, Inc, Carlsbad, California, USA) was used to capture 30-degree images in some patients, while the Topcon TRC 50-EX (Topcon Medical Systems, Inc, Oakland, New Jersey, USA) was used to capture 50-degree images in other patients. The frame with the best visualization of macular capillaries was used for analysis. Mean capture time point from dye injection to image capture for IVFA images used in the study was 67.2 seconds (range 25.0–128.8 seconds). IVFA images were optimized for visualization of capillaries; image contrast was enhanced using either the intrinsic Heidelberg software or OIS Winstation software (Ophthalmic Imaging Systems, Sacramento, California, USA).
The charts of all patients who underwent RFI imaging and IVFA were reviewed, and age, sex, and ophthalmic diagnoses recorded. To perform accurate comparisons, images were imported into Adobe Photoshop Version CS5 (Adobe Systems Inc, San Jose, California, USA), and RFI images were superimposed and aligned with IVFA images. All RFI and IVFA images were evaluated by 4 examiners (S.G., R.A., A.W., K.S.), who were masked to patient name and diagnosis, and the following parameters were analyzed: presence of vertical collateral vessels, presence of vascular “loops,” highest order of apparent vascular branching, size of the foveal avascular zone (FAZ), and presence of image artifacts.
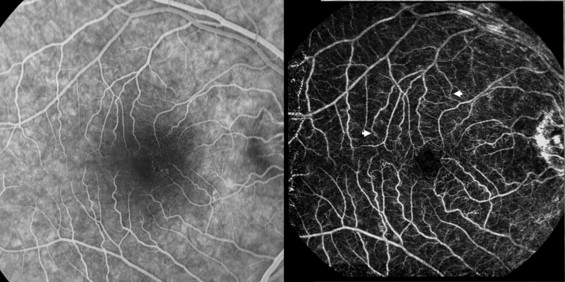
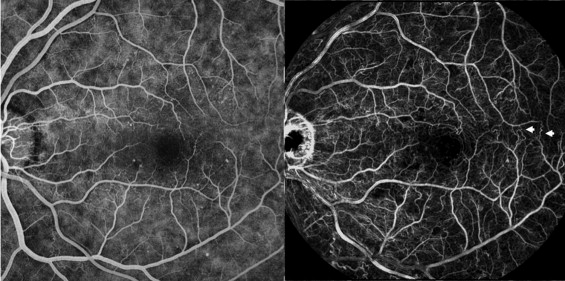
Vascular loops were circular microvascular abnormalities that did not cross the horizontal raphe ( Figure 1 ). Vertical collateral vessels were anastomotic vessels connecting the superior and inferior retinal circulations by crossing the horizontal raphe ( Figure 2 ). The designations of vascular loops and vertical collateral vessels were similar to those described in a previous study of flow velocity maps using the RFI.
The FAZ was measured in all images using Adobe Photoshop, and FAZ areas were measured in pixels. To standardize measurements between patients, the diameter of the first-order retinal venule was measured in pixels and converted to mm (the first-order venule was estimated to be 0.125 mm in diameter), and the FAZ area could then be estimated in mm 2 .
Statistical analysis was performed using Microsoft Excel Version 12.2.8 (Microsoft Corporation, Redmond, Washington, USA). The number of vascular loops per eye, vertical anastomoses per eye, highest order of visible vessel branching, and the FAZ area were compared between RFI and IVFA images using 2-tailed Student t tests. All average values were expressed as means.
Results
Thirty-three eyes of 28 patients were included in the study (11 eyes were excluded because of poor RFI image quality). Seven eyes of 4 individuals without retinal pathology and 26 eyes of 24 patients with various ocular diseases were imaged. There were 14 men and 14 women, aged 22 to 83 years (mean 54 years). The following ocular diseases were imaged: nonexudative age-related macular degeneration (4), central serous chorioretinopathy (3), diabetic macular edema (3), nondiabetic cystoid macular edema (2), central retinal vein occlusion (2), choroidal neovascularization (2), epiretinal membrane (2), leukemic retinopathy (2), posterior uveitis (2), choroidal hemangioma (1), hypertensive retinopathy (1), macular hole (1), and ocular toxoplasmosis (1).
Vascular loops, as previously described in the methods section, were sometimes apparent on both IVFA and RFI, but often more loops were visible on the RFI. The average number of loop vessels per eye apparent on FA was 0.97 ± 1.50, and the average number of loop vessels per eye on RFI was 4.42 ± 3.58 ( P < .001) ( Table ) .
| Microvascular Measurements | IVFA | RFI | P Value |
|---|---|---|---|
| Vessel loops per eye | 0.970 (± 1.503) | 4.424 (± 3.580) | <.001 |
| Eyes with 0 loops | 20 (61%) | 8 (24%) | |
| Eyes with 1–3 loops | 10 (30%) | 7 (21%) | |
| Eyes with >3 loops | 3 (9%) | 18 (55%) | |
| Vertical anastomoses per eye | 0.424 (± 0.540) | 1.333 (± 1.514) | <.001 |
| Eyes with 0 anastomoses | 23 (70%) | 11 (33%) | |
| Eyes with 1–2 anastomoses | 8 (24%) | 14 (42%) | |
| Eyes with >2 anastomoses | 2 (6%) | 8 (24%) | |
| Order of vessel branching | 4.576 (± 0.708) | 5.182 (± 0.638) | <.001 |
| Fourth order visible | 18 (55%) | 4 (12%) | |
| Fifth order visible | 11 (33%) | 19 (58%) | |
| Sixth order visible | 4 (12%) | 10 (30%) | |
| Foveal avascular zone (mm 2 ) | 0.753 (± 0.757) | 0.352 (± 0.181) | .017 |
Vertical collateral vessels were also seen on both imaging modalities, but were identified more frequently on the RFI images. The mean number of vertical collaterals per eye on IVFA was 0.42 ± 0.54, and was 1.33 ± 1.51 on the RFI ( P < .001) ( Table ).
The highest order of visible retinal vascular branching was recorded. The first-order vessel was defined as the superior or inferior hemi-artery emanating from the optic nerve head. The highest vessel order visible on either IVFA or RFI was of the sixth order. Vessels of the sixth order were more apparent on RFI than on IVFA. The mean order of visible vessel branching on IVFA was 4.6 ± 0.7, and was 5.2 ± 0.6 on the RFI ( P < .001) ( Table ).
The FAZ was measured in all eyes and compared between IVFA and RFI images ( Figure 3 ). In 12 eyes that received 30-degree IVFA imaging, the disc and peripapillary retinal venules were not completely captured; therefore, the FAZ could not be accurately calculated and these eyes were not used in the analysis. However, these 12 eyes were used for analysis of other features. In general, the measurable FAZ was larger on IVFA (0.753 ± 0.757 mm 2 ) compared to RFI (0.352 ± 0.181 mm 2 , P = .017) ( Table ). However, in 5 out of 21 of these eyes, the FAZ was larger on RFI compared to IVFA.


