Purpose
To compare the macular choroidal thickness in 2 types of early dry-type myopic maculopathy.
Design
Prospective, observational, comparative study.
Methods
Patients with a refractive error of less than −8 diopters were included and were classified into 2 groups. Group 1 consisted of 24 eyes with a tessellated fundus, and group 2 consisted of 33 eyes with diffuse chorioretinal atrophy, but not to the extent of patchy chorioretinal atrophy. These 2 groups were compared with regard to their clinical characteristics, refractive error, axial length, macular choroidal thickness, and best-corrected visual acuity (BCVA). Linear regression was used to evaluate the explanatory variables in terms of macular choroidal thickness and BCVA.
Results
Patients in group 1 were significantly younger and had better BCVA, less myopia, shorter axial length, and less staphyloma than those in group 2. Refractive error, axial length, and BCVA correlated significantly with macular choroidal thickness in group 2. However, no such significant correlations were observed in group 1. Multiple linear regression analysis showed that age and macular choroidal thickness were the variables that associated most strongly with BCVA, whereas neither refractive error nor axial length was a significant predictor of BCVA. In group 2, eyes with lacquer cracks showed worse BCVA and thinner macular choroidal thickness than eyes without lacquer cracks.
Conclusions
Macular choroidal thickness is an important factor in myopic maculopathy and can be a better indicator of its severity. These findings suggest that BCVA reduction in eyes with dry-type myopic maculopathy can be related to a thinner macular choroidal thickness and to the development of lacquer cracks.
Pathologic myopia is the most frequent cause of visual impairment in Asian countries because of the high prevalence of myopia. Most visual impairment in eyes with pathologic myopia is attributable to myopic maculopathy, which is usually bilateral and irreversible and can result in blindness. From 2 different studies among elderly Taipei, Taiwan, residents, myopic maculopathy has been identified as the second leading cause of visual impairment, being more prevalent than age-related macular degeneration (AMD): (Liu and associates: cataract, 30.4%; myopic maculopathy, 25.0%; AMD, 14.3%; Hsu and associates: cataract, 41.7%; myopic maculopathy, 12.5%; AMD, 10.4%).
Similar to wet and dry AMD, myopic maculopathy can be classified as either wet or dry, depending on the presence or absence of choroidal neovascularization (CNV), respectively. Effective therapies of myopic CNV are available, but there is no treatment available for dry-type myopic maculopathy. Hayashi and associates demonstrated that eyes with tessellated fundus, lacquer cracks, diffuse atrophy, and patchy atrophy at the initial examination may progress to CNV development. Therefore, it will be crucial for early detection of highly susceptible eyes among those with dry-type myopic maculopathy.
The definitions of pathologic myopia can vary depending on the age, race, or epidemic country. It can be defined according to a refractive error of at least −5 diopters (D), −6 D, or −8 D; an axial length of more than 25.5 mm, 26 mm, or 26.5 mm; or posterior pole abnormalities in eyes with high refractive errors. Several classifications of myopic maculopathy have been defined according to posterior pole abnormalities. Avila and associates graded myopic retinopathy on a scale from 0 to 5 according to choroidal pallor, tessellated fundus, posterior staphyloma, lacquer cracks, and choroidal atrophy. Vongphanit and associates defined myopic retinopathy as staphyloma, lacquer cracks, Fuchs spot, and myopic chorioretinal atrophy. Hayashi and associates defined myopic maculopathy as a tessellated fundus, patchy or diffuse chorioretinal atrophy, lacquer cracks, CNV, and macular atrophy. Several problems are associated with these classifications and definitions of the severity of myopic maculopathy. First, posterior pole abnormalities are identified subjectively. Second, neither axial length nor refractive error is a completely reliable indicator of myopia type. Third, there are variations in the axial length or refractive error that defines pathologic myopia.
Optic coherence tomography (OCT) has been used to investigate myopic maculopathy with a wide range of findings, including foveoschisis, paravascular inner-retinal cleavage, cysts, posterior retinal detachment with macular holes, peripapillary intrachoroidal cavitation (also known as peripapillary detachment in pathologic myopia ), and CNV. All these OCT findings can result in visual impairment. Recently, the choroid was found to undergo further thinning with age and the degree of myopia, and posterior staphyloma is a key indicator of choroidal thinning.
Therefore, the purpose of this study was to compare macular choroidal thickness in 2 types of early myopic maculopathy, to determine a possible explanation of the visual impairment in eyes with early dry-type myopic maculopathy, and to detect early the high-risk eyes that may progress to advanced myopic maculopathy.
Methods
Inclusion Criteria
We conducted a prospective study of highly myopic patients (defined as having a spherical equivalent refractive error more negative than −8 D) at Chang Gung Memorial Hospital, Linkuo Medical Center, Taoyuan, Taiwan, between June 1, 2010, and January 31, 2011.
Patients were excluded from this study if they had a history of amblyopia, glaucoma, uveitis, diabetic retinopathy, retinal vascular abnormalities, laser treatment, drusen, severe chorioretinal atrophy, macular scarring, refractive surgery, intraocular surgery (such as cataract extraction), vitrectomy, or intravitreal injection. The information collected included age at presentation, sex, affected eye, medical and ocular histories, and the duration of the presenting symptoms.
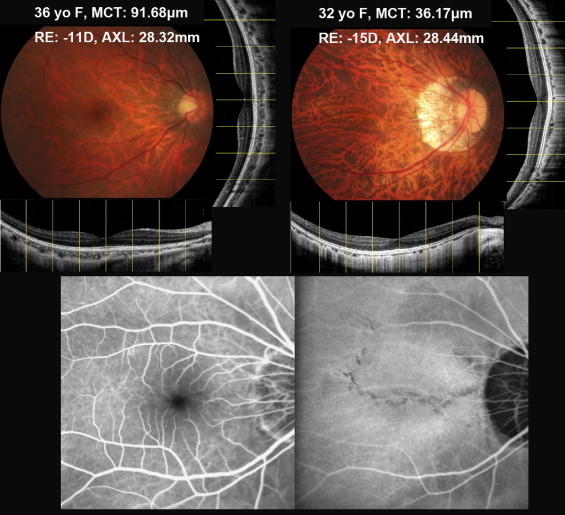
Patients with cataract, moderate to severe chorioretinal atrophy, pathologic structures resulting from spectral-domain (SD) OCT, such as CNV, foveoschisis, macular pucker, and macular hole, which may have predisposed them to visual deterioration, were excluded. The eyes were divided into 2 groups according to classification of myopic maculopathy. Eyes with only tessellated fundus were included in group 1 ( Figure 1 , Top left), and eyes with diffuse chorioretinal atrophy, but not to the extent of patchy chorioretinal atrophy, with or without lacquer cracks were included in group 2 ( Figure 1 , Top right). These 2 groups were compared with regard to their clinical characteristics, refractive error, axial length, and choroidal thickness.
Basic Examination
All patients underwent a full ophthalmic evaluation, including a slit-lamp examination and dilated ophthalmoscopy. Their spherical equivalent refractive error was measured with a TOPCON KR-8100 autorefractor (Topcon, Tokyo, Japan), and then their cycloplegic refraction was measured by Snellen chart under standard constant illumination. Snellen visual acuities were converted to logarithm of the minimal angle of resolution units for statistical analysis. After cycloplegic refraction, an ultrasound examination was performed 8 to 10 times with a Sonomed A-Scan model A2500 apparatus (Sonomed, Inc, New York, New York, USA). We calculated the average values after excluding the maximal and minimal values.
Measurement of Choroidal Thickness
Retinal biometry and choroidal biometry were measured with an SD OCT system (RTVue; Optovue, Inc, Fremont, California, USA). The signal strength index is a measure of the average signal strength across the scan; the higher the number, the better the quality. Only well-centered images with good quality, as determined by a signal strength index of 50 or more, were used for analysis. The repeatability has been reported for the measurement of the nerve fiber layer and macular thickness. Choroidal thickness was measured as previously reported. Briefly, the choroid was imaged in the choroidal mode with the SD OCT system. In the choroidal mode, the signal from the retinochoroidal portion of the scanned region is enhanced relative to that in the vitreoretinal portion. Each image encompassing the macula and optic nerve was obtained from 8 averaged scans. Both the horizontal and vertical sections passing directly through the center of the fovea were used for the choroidal thickness measurements. The choroidal thickness was defined as the distance from the outer border of the retinal pigment epithelium line to the hyperrefractive line behind the large vessel layers of the choroid, which is presumed to be the choroid–sclera interface. Choroidal thickness measurements were obtained manually under the fovea using the scale supplied with the software at 1000-μm intervals from the fovea to a distance of 3 mm in the nasal, temporal, superior, and inferior directions ( Figure 1 , Top). Each image was measured by 2 independent observers (H.Y.C., L.K.Y.). Data with discrepancies of 20% were reanalyzed by the senior author (N.K.W.). The value averaged from 14 choroidal thickness readings was considered to be the macular choroidal thickness.
Advanced Examination
Fluorescein and indocyanine green angiography were performed simultaneously with a confocal scanning laser ophthalmoscope (Heidelberg Retina Tomograph; Heidelberg Engineering, Heidelberg, Germany). Lacquer cracks are visualized better by indocyanine green angiography than by fluorescein angiography ( Figure 1 , Bottom). To exclude further the possibility of white dot syndrome, late-phase indocyanine green angiography was performed 30 to 60 minutes after the injection of the dye to ensure that there were no hypofluorescent spots at the posterior pole.
Statistical Analysis
Statistical analysis was performed with SPSS software package version 17 (SPSS, Inc, Chicago, Illinois, USA). Confluent covariates were assessed with the Mann–Whitney U test. Categorical covariates were assessed individually with the chi-square test, and the Fisher exact test was used for samples with an expectancy of less than 5. Simple liner regression was calculated for variations in macular choroidal thickness relative to age, refractive error, axial length, and best-corrected visual acuity (BCVA). Multiple linear regression was used to evaluate the explanatory variables with regard to the dependent variable, BCVA. Subgroup analysis of macular choroidal thickness was performed in eyes with and without lacquer cracks using an independent-sample t test. A P value of less than .05 was considered statistically significant.
Results
Patient Demographic Data
Group 1 contained 24 eyes of 12 patients and group 2 contained 33 eyes of 17 patients. The mean age was 35.5 ± 10.20 years (mean ± standard deviation) in group 1 and 41.21 ± 11.32 years in group 2 ( P = .034, independent-sample t test). The mean refractive error was −11.93 ± 2.24 D in group 1 and −15.44 ± 4.23 D in group 2 ( P = .001). The mean logarithm of the minimal angle of resolution visual acuity was 0.02 ± 0.03 (Snellen equivalent, 0.96 ± 0.07) in group 1 and 0.42 ± 0.42 (Snellen equivalent, 0.52 ± 0.32) in group 2 ( P < .001). The mean macular choroidal thickness was 123.74 ± 30.90 μm in group 1 and 42.26 ± 15.18 μm in group 2 ( P < .001). All the data are summarized in Table 1 . Figure 1 shows examples of the results for the eyes in each group. The distribution ranges for macular choroidal thickness were 79.02 to 169.16 μm and 14.71 to 79.96 μm in groups 1 and 2, respectively.
| Group 1 (24 Eyes, 12 Patients) | Group 2 (33 Eyes, 17 Patients) | P Value | |
|---|---|---|---|
| Age (year) | 35.50 ± 10.20 | 41.21 ± 11.32 | .034 a |
| Eye (right eye:left eye ratio) | 12:12 | 16:17 | 1.000 |
| Refractive error (D) | –11.93 ± 2.24 | –15.44 ± 4.23 | .001 a |
| Best-corrected visual acuity | |||
| logMAR | 0.02 ± 0.03 | 0.42 ± 0.42 | <.001 a |
| Snellen equivalent | 0.96 ± 0.07 | 0.52 ± 0.32 | <.001 a |
| Axial length (mm) | 27.55 ± 0.94 | 29.54 ± 1.63 | <.001 a |
| Macular choroidal thickness (μm) | 123.74 ± 30.90 | 42.26 ± 15.18 | <.001 a |
| Range (μm) | 79.02 to 169.16 | 14.71 to 73.96 | |
| Subfoveal choroidal thickness (μm) | 128.26 ± 41.68 | 40.55 ± 17.44 | <.001 a |
| Fundus lesions, no (%) | |||
| Staphyloma | 0 | 8 (24.2) | .016 a |
| Lacquer crack | 0 | 27 (81.8) | <.001 a |
Simple Regression Analysis
A simple regression analysis of macular choroidal thickness is shown in Table 2 and Figure 2 . Age was not related significantly to macular choroidal thickness in either group. Refractive error, axial length, and BCVA correlated significantly with macular choroidal thickness in group 2. However, these correlations were not observed in group 1. Figure 2 shows scatterplots of macular choroidal thickness and factors such as age, refractive error, axial length, and BCVA in all eyes (left column) and separately in group 1 (middle column) and group 2 (right column).
| Factors | Unstandardized Coefficients Estimate (Standard Error) | P Value | Correlation Coefficients |
|---|---|---|---|
| Group 1 (n = 24) | |||
| Age (year) | –0.085 (0.646) | .896 | 0.028 |
| Refractive error (D) | 5.363 (2.708) | .060 | 0.389 |
| Axial length (mm) | –11.344 (6.582) | .099 | 0.345 |
| Best-corrected visual acuity | |||
| logMAR | 130.430 (210.209) | .541 | 0.131 |
| Snellen equivalent | –65.226 (99.798) | .520 | 0.138 |
| Group 2 (n = 33) | |||
| Age (year) | –0.305 (0.235) | .204 | 0.227 |
| Refractive error (D) | 2.105 (0.521) | <.001 a | 0.588 |
| Axial length (mm) | –5.540 (1.348) | <.001 a | 0.594 |
| Best-corrected visual acuity | |||
| logMAR | –18.225 (5.690) | .003 a | 0.499 |
| Snellen equivalent | 25.388 (7.207) | .001 a | 0.535 |
Multiple Regression Analysis
We performed a stepwise multiple linear regression analysis to determine the explanatory variables most strongly associated with BCVA from among age, refractive error, macular choroidal thickness, and axial length. Age ( P = .016) and macular choroidal thickness ( P < .001) were the variables associated most significantly with BCVA, whereas neither refractive error nor axial length was a significant predictor of BCVA ( Supplemental Table , available at AJO.com ).
Relation to Subfoveal Choroidal Thickness
Figure 3 shows a significant statistical association between subfoveal choroidal thickness and macular choroidal thickness in all eyes ( R 2 = 0.93; P < .001). However, the coefficient of determination was higher in group 1 ( R 2 = 0.861; P < .001) than in group 2 ( R 2 = 0.546; P < .001). Although the eyes in group 1 tended to have a subfoveal choroid thicker than macular choroidal thickness and eyes in group 2 had a subfoveal choroid thinner than macular choroidal thickness ( Table 1 ), the differences were not statistically significant ( P = .215 for group 1; P = .419 for group 2).


