Purpose
To investigate the impact of Bruch membrane pathology on the choroid in pseudoxanthoma elasticum (PXE).
Design
Monocenter cross-sectional prospective case series.
Methods
The study included 61 eyes of 51 patients with PXE and 54 eyes of 54 normal subjects. The diagnosis of PXE was based on skin biopsy, genetic analysis or both. Eyes with PXE were subdivided into 3 groups: eyes without choroidal neovascularization (CNV) or chorioretinal atrophy (Group 1); eyes with active or fibrotic CNV (Group 2); and eyes with chorioretinal atrophy only (Group 3). Choroidal thickness was measured using enhanced-depth imaging optical coherence tomography (EDI-OCT).
Results
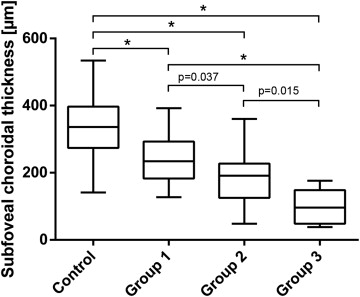
Compared to controls (331 μm ± 24; mean ± 95% CI), mean subfoveal choroidal thickness in eyes of patients with PXE was significantly reduced within all 3 groups (Group 1: 243 μm ± 29; Group 2: 184 μm ± 28; Group 3: 104 μm ± 28; P < 0.001). Associated structural changes included apparent loss of small choroidal vessels. The difference of PXE compared to control eyes was largest close to the optic disc and approximated the level of controls toward the periphery. Within the PXE subgroups, eyes without CNV or chorioretinal atrophy (Group 1) showed the least reduction of choroidal thickness, while it was most pronounced in Group 3.
Conclusions
The results indicate that changes of Bruch membrane can be associated with choroidal alterations, which are most pronounced in the presence of advanced disease. A role of Bruch membrane in choroidal homeostasis may reflect a possible contribution of Bruch membrane alterations to CNV and geographic atrophy development in age-related macular degeneration.
The Bruch membrane is a stratified, acellular-extracellular matrix located between the retinal pigment epithelium (RPE) and the choriocapillaris. It is composed of a middle elastin-rich layer, adjacent outer and inner collagen-rich layers, and the basal laminae of the RPE and the choriocapillaris. Bruch membrane has a multitude of important functions for adjacent structures, including the trafficking of metabolites and nutrients between the RPE and the choriocapillaris and the attachment of the RPE cell layer. Changes in Bruch membrane occur with age but are also implicated in a number of diseases, including age-related macular degeneration (AMD), which is the most common cause of severe vision loss and blindness in Western industrialized countries. As a prototypic multifactorial disease, the pathophysiologic factors in AMD include not only changes in Bruch membrane but also oxidative stress, RPE lipofuscin accumulation, inflammatory and immunologic pathways, and possibly a vascular-nutritive component due to changes in the choroid. In multifactorial diseases, it is difficult to separate primary from secondary effects that eventually lead to functional loss. For instance, choroidal alterations could occur secondary to changes in Bruch membrane, but such discrimination may not be noticeable.
One way to study selectively the contribution of differing factors to a disease phenotype of a multifactorial disease such as AMD is the investigation of genetically modified animal models mimicking only 1 pathophysiologic component of the disease. The disadvantages of this approach include the different anatomy and physiology of widely used animal models such as mouse and rat, which are small nocturnal animals without a macula. Another possibility for separately investigating specific components of AMD pathology is the detailed investigation of human monogenic diseases with clearly defined changes mimicking specific components of AMD pathophysiology.
A good candidate for studying the impact of an altered Bruch membrane is pseudoxanthoma elasticum (PXE), a rare multisystem disorder with a prevalence of 1:25 000 to 1:100 000 (Online Mendelian Inheritance in Man #264800). PXE has an autosomal recessive inheritance and is caused by mutations in the adenintriphosphate-binding cassette subfamily C member 6 (ABCC6) gene, which encodes a transmembrane transporter protein expressed primarily in the liver and kidneys. Dysfunction of ABCC6 is hypothesized to cause a systemic deficiency of an as yet unidentified inhibitor of extracellular calcification, leading to calcification and fragmentation of connective tissue rich in elastic fibers. The primary pathologic alteration in eyes of patients with PXE appears to be a thickening and calcification of Bruch membrane. In later disease stages, the disease shares various phenotypic similarities with AMD, including a high risk for developing choroidal neovascularization (CNV) or chorioretinal atrophy of the macular region, both of which are associated with severe vision loss.
So far, the contribution of Bruch membrane alterations to AMD pathophysiology and its association with choroidal changes are unknown. Therefore, this study sought to characterize choroidal thickness and structure in PXE as a human model for Bruch membrane pathology.
Materials and Methods
This monocenter cross-sectional prospective case series was performed at the Department of Ophthalmology, University of Bonn. The study was in adherence with the Declaration of Helsinki. Institutional review board approval (Ethikkommission, Medizinischen Fakultät, Rheinische Friedrich-Wilhelms-Universität Bonn) and patients’ consents were obtained.
Patient Characteristics
Diagnosis of PXE was confirmed by (1) genetic testing using direct sequencing and multiplex ligation-dependent probe amplification analysis of the ABCC6 gene, as described previously or (2) skin histopathology in combination with characteristic funduscopic findings, or both. All patients underwent a complete ophthalmologic examination, including best corrected visual acuity, funduscopy, fundus photography, confocal laser scanning ophthalmoscopy, optical coherence tomography (OCT) and, in selected cases, fluorescein or indocyanine green angiography or both. Refractive error (spherical equivalent) was measured by autorefractometry (NIDEK ARK-560A; NIDEK, Gamagori, Japan).
Patients with any additional retinal pathology known to affect choroidal thickness, prior retinal surgery or any other previous treatment, including laser photocoagulation or photodynamic therapy, were excluded. Use of intravitreal vascular endothelial growth factor inhibitors was not an exclusion criterion. Subjects with refractive errors higher than ± 3 diopters spherical equivalent were excluded from analysis.
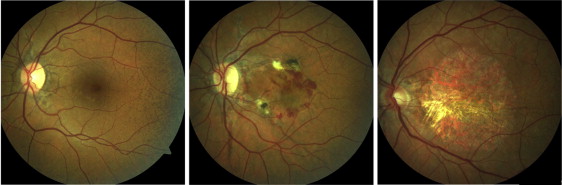
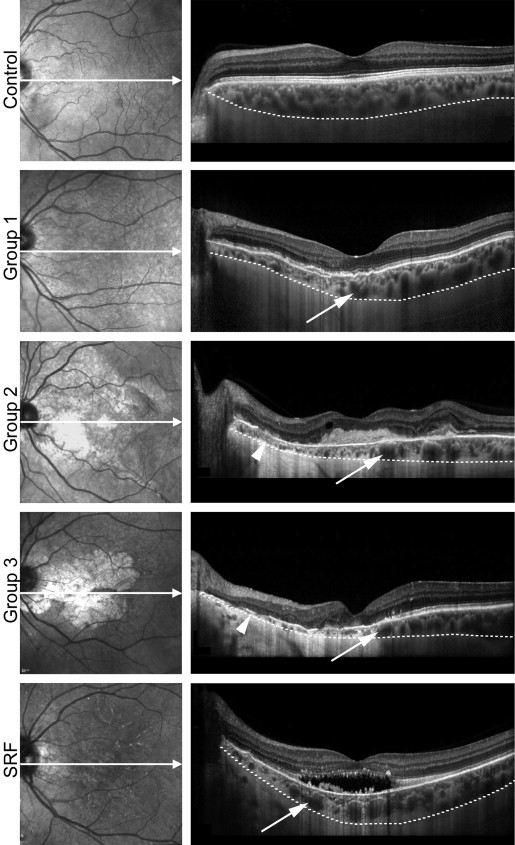
Eyes of patients with PXE were grouped according to certain disease characteristics, assuming more severe Bruch membrane alterations with more progressed disease stages ( Figure 1 ). Group 1 included eyes with characteristic PXE-associated fundus changes, such as angioid streaks, peau d’orange and peripheral comet lesions without evidence of CNV or macular chorioretinal atrophy ( Figure 1 , left). Group 2 was characterized by active CNV or secondary subretinal fibrosis ( Figure 1 , middle). Group 3 included eyes with chorioretinal atrophy without evidence for CNV ( Figure 1 , right). Presence or absence of CNV was confirmed using fluorescein angiography and OCT imaging. If applicable, the right eye of each patient was assigned to 1 of the 3 groups. If the right eye matched 1 of the exclusion criteria, the left eye was used for analysis. If patients had a different phenotype in each eye, both could be included and were assigned to different groups.
The right eyes of control subjects without any ocular disease served as controls. Controls underwent an ophthalmologic examination including best corrected visual acuity, funduscopy and fundus photography.
Image Acquisition and Processing
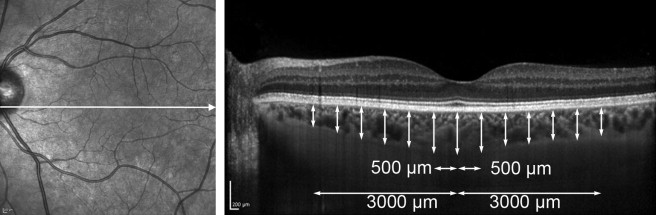
Enhanced depth imaging (EDI) OCT was performed using the enhanced-depth imaging mode of a spectral domain OCT device (Spectralis HRA-OCT, Heidelberg Engineering, Heidelberg, Germany). Single horizontal and vertical line scans were recorded centered on the fovea with up to 100 images averaged. Localization on the foveal center was controlled manually.
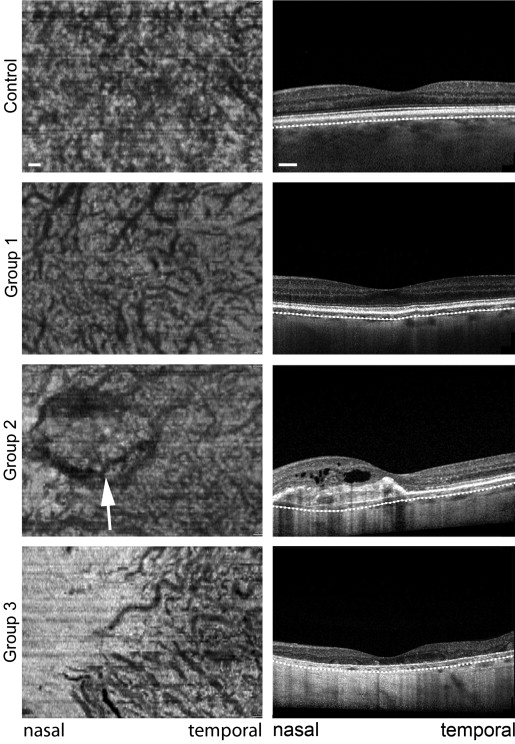
Choroidal thickness was measured manually using the Heidelberg Eye Explorer software (Heidelberg Engineering). Thickness was measured from the outer border of the highly reflective RPE/Bruch membrane band to the sclerochoroidal junction as described by Margolis and Spaide. Measurement was performed by 2 independent readers (MG and PLM) subfoveally and in 500-μm intervals up to 3 mm nasal, temporal, superior, and inferior to the foveal center, as exemplified in a horizontal OCT scan in Figure 2 . For en face images, volume scans encompassing an area of 15 degrees × 10 degrees with 97 scans (distance between scans ∼30 μm) and 15 images averaged per scan were acquired. Images were generated using a prototype transverse section viewer tool from Heidelberg Eye Explorer software. Bruch membrane was automatically identified in all sections by the software and served as a reference plane. If needed, the reference plane was adjusted manually. Choroidal en face images were then computed based on the information of the volume scan as a single layer 60 μm beyond the reference plane, based on previous experience using this algorithm.
Statistical Analysis
Statistical analysis was performed using commercially available statistic software (IBM SPSS, v 20.0, IBM, Armonk, New York, USA). Mean subfoveal choroidal thickness was compared among the groups by one factorial analysis of variance (ANOVA) followed by the Tukey test for the pair-wise comparison of groups. To assess the difference in the age dependency of subfoveal choroidal thickness between patients with PXE compared to controls, we fitted a linear model to the logarithmic transformed thickness values. Assuming that the early average thickness was the same in both groups, we chose a model with identical intercept but different slopes. Correlation between refractive error and choroidal thickness was assessed by computing the Pearson correlation coefficient. Interobserver agreement was determined by calculating the intraclass correlation (ICC) coefficient for subfoveal choroidal thickness (ICC r = 0.98). There were 10 patients in whom both eyes were included in the study. In these cases, both eyes belonged to different subgroups of the disease, so we assumed the effect of the dependency between the two eyes of one person to be negligible for our analyses.
Results
Of 51 patients with PXE, 61 eyes were included in this study. All included patients had positive genetic and/or histopathologic diagnosis of PXE ( Supplemental Table at AJO.com ). Genetic testing was performed in 48 patients. Of these patients, 39 were found to have 2, and 8 patients to have 1 disease causing mutation in the ABCC6 gene. In 1 patient no disease-causing mutations were identified. Histopathologic investigation of skin biopsies were performed in 30 patients and were positive in all but 1 case. The controls were 54 normal eyes without any eye disease. Descriptive data concerning the groups are shown in the Table . The distribution of age and refractive error was equal in both groups.
| Control | Overall PXE | Group 1 | Group 2 | Group 3 | |
|---|---|---|---|---|---|
| No. of patients (eyes) | 54 (54) | 51 (61) | 25 (25) | 26 (26) | 10 (10) |
| Sex (f/m) | 33/21 | 33/18 | 15/10 | 18/8 | 8/2 |
| Age [yrs] (±95% CI) | 45.8 (±4.1) | 48.5 (±2.6) | 44.8 (±5.3) | 51.2 (±2.8) | 52.9 (±3.4) |
| Refractive error [dpt] (±95% CI) | −0.34 (±0,37) | −0.53 (±0.35) | −0.38 (±0.54) | −0.76 (±0.48) | −0.25 (±1.02) |
| Subfoveal choroidal thickness [μm] (±95% CI) | 331.4 (±23.9) | 197.3 (21.1) | 243.3 (28.7) | 183.6 (28.2) | 103.8 (27.9) |
Subfoveal Choroidal Thickness in Pseudoxanthoma Elasticum
Subfoveal choroidal thickness was significantly different across the 4 groups (ANOVA P < 0.001). Compared to controls, mean subfoveal choroidal thickness was thinner in patients with PXE overall and in all 3 subgroups ( P < 0.001 for each group) ( Table , Figure 3 ). Comparison between PXE subgroups revealed thinner subfoveal choroidal thicknesses in groups 2 and 3 compared to Group 1, and a further reduction in Group 3 compared to Group 2 ( P = 0.037, P < 0.001, P = 0.015) ( Table , Figure 3 ). Group 1 included 2 patients with subretinal fluid in absence of a CNV. The respective eyes showed choroidal thinning similar to the other patients in Group 1.
Topography of Pseudoxanthoma Elasticum–Related Choroidal Thickness Changes
To further study the topography of choroidal changes, choroidal thickness was measured at various locations in 500 μm intervals up to an eccentricity of 3000 μm nasally, temporally, superiorly, and inferiorly ( Figure 4 ).
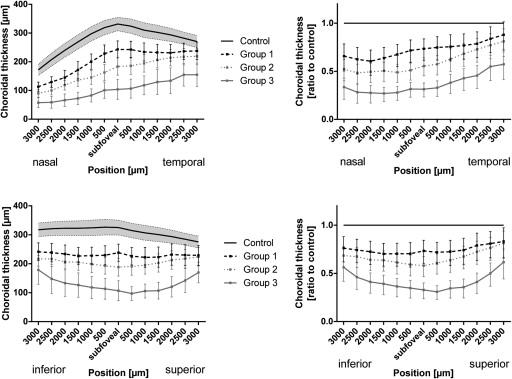
The choroid in control eyes was thickest subfoveally and showed a continuous thinning with increasing eccentricity along horizontal and vertical scans through the foveal center ( Figure 4 , left). The thinnest values of choroidal thickness were measured 3000 μm nasally.
In all 3 subgroups of the PXE cohort, choroidal thickness was significantly reduced along the horizontal and vertical scans through the foveal center ( Figure 4 , left). Overall, there appeared to be a gradient of choroidal thinning in patients with PXE. Relative to normal controls, the choroid was thinnest close to the optic nerve head, approximating normal thickness values temporally along the horizontal OCT scan ( Figure 4 , top row). Along the vertical OCT scan there also was a gradient, with the most pronounced thinning at the foveal center and approximation to values of the control group with increasing eccentricity ( Figure 4 , bottom row). Comparison of the 3 PXE subgroups revealed the least choroidal thinning in Group 1 and the most pronounced thinning in Group 3.
Choroidal Structure in Pseudoxanthoma Elasticum
On cross-sectional EDI-OCT scans, choroidal structure in healthy middle-aged controls was characterized by a layer of small and medium-sized vessels in the inner choroid, accounting for about one third to one half of choroidal thickness, and larger vessels in the outer choroid ( Figure 5 , first row). Within all PXE subgroups, choroidal thinning appeared to affect the inner choroid primarily, with associated enhanced visibility of larger outer choroidal vessels. While choroidal thickness was largest subfoveally in normal controls ( Figure 5 , first row), eyes of patients with PXE revealed a gradient of marked thinning close to the optic disc to more preserved choroid temporally ( Figure 5 , second to fourth rows). Subretinal fluid accumulations were not accompanied by different changes of choroidal thickness or structure ( Figure 5 , last row).
EDI-OCT volume-scans were used to reconstruct en face views 60 μm below the RPE where the inner choroid was well visualized in most healthy controls. In the first row of Figure 6 , a representative control eye illustrates the normal dense choroidal vascular network of the inner choroid with little spacing between vessels. In a Group 1 eye with PXE there was marked rarefication of this dense vascular network and increased visibility of larger choroidal vessels. Between vessels there was increased spacing with interposed hyperreflective material ( Figure 6 , second row). Patients in Group 2 exhibited a comparable choroidal structure and additional visibility of the CNV, which interfered with visualization of the choroid ( Figure 6 , third row). In the patients in Group 3, the choroid was almost completely absent close to the optic disc, whereas some larger vessels of the outer choroid were visible temporally ( Figure 6 , last row).
Dependence on Age and Refractive Error
Choroidal thickness is negatively correlated with age in healthy subjects. It was of interest to discover whether age dependency of choroidal thickness was different in eyes with Bruch membrane impairment. Therefore, the subfoveal choroidal thickness of patients with PXE in Group 1 and of healthy controls was separately plotted against age ( Figure 7 , graph). Thickness measurements were negatively correlated with age within both groups (r = −0.42, P = 0.002; r = −0.612, P = 0.001). However, age-dependent choroidal thinning was significantly enhanced in patients with PXE compared to controls ( P < 0.001).
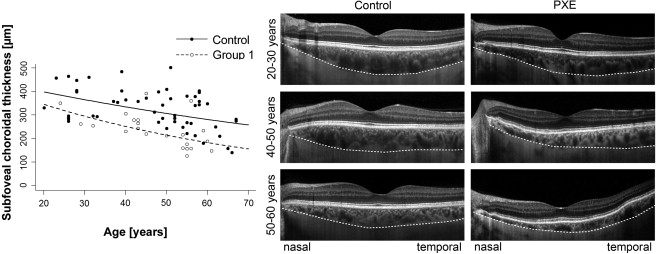
With regard to the topography of age-dependent choroidal thinning, controls showed a homogeneous thinning at different eccentricities ( Figure 7 , left) whereas in patients with PXE, thinning of the choroid started nasally and then spread to the temporal periphery with increasing age ( Figure 7 , right).
There was a tendency toward a positive correlation between refractive error and thickness that was comparable in all groups.
Stay updated, free articles. Join our Telegram channel

Full access? Get Clinical Tree


