Purpose
To investigate the choroidal and retinal thickness in myopic, emmetropic, and hyperopic Chinese children by swept-source longer-wavelength optical coherence tomography.
Design
Cross-sectional study.
Methods
Two-hundred and seventy-six schoolchildren aged 7-13 years underwent comprehensive ophthalmic examinations, including cycloplegic refraction, and swept-source optical coherence tomography measurements. The thickness of the choroid, retina, ganglion cell layer, and nerve fiber layer were compared among children of different refractive status. The topographic variation and factors related to the thickness of the choroid and retinal layers were analyzed.
Results
Compared to emmetropic subjects, those with myopia had a significantly thinner choroid in all regions ( P < .01), and hyperopic subjects had a thicker choroid in most regions ( P < .05). The myopic retinas were thinner than those of emmetropic or hyperopic subjects in the superior parafoveal and all 4 perifoveal subfields ( P < .05), but no other subfields differed significantly among different refractive groups ( P > .05). The axial length and refractive diopters were independently related to central foveal choroidal thickness (R 2 = 0.17, P < .01), while age and intraocular pressure were independently associated with central fovea retinal (R 2 = 0.15, P < .01) and ganglion cell layer thicknesses (R 2 = 0.10, P < .01) after adjustment for other systematic and ocular factors. Central foveal choroidal and retinal thickness were unrelated in children of different refractive status ( P > .05).
Conclusions
Choroidal thickness, but not retinal thickness, correlated closely with axial length and refractive diopters in Chinese children. Choroid thinning occurs before retina thinning early in myopic progression.
Myopia is a global public health concern. It is estimated that one third of the world’s population may be affected by myopia by the year 2020. The pathophysiology of myopic progression is not well understood, although both genetic and environmental factors have been implicated in this apparent dysregulation of the emmetropization process. The choroid, which may facilitate axial growth by modulating the remodeling of the scleral extracellular matrix, has been implicated as playing an important role in the emmetropization of the eye during development. In animal models of induced myopia and hyperopia, changes in choroidal thickness precede changes in axial length and scleral remodeling. This implies that choroidal thickness may be an important marker in predicting myopia and myopic progression.
Morphologic changes in the choroid and retina of myopic eyes have been well studied in adults, but they are poorly understood in children. Few studies have described retinal and choroidal thickness in children with different refractive states, but none have studied both characteristics in the same cohort.
Swept-source optical coherence tomography (SSOCT) uses a long-wavelength swept light source to probe the amplitude and phase of backscattering of light from tissue. SSOCT has several advantages compared with spectral-domain optical coherence tomography (SDOCT), including higher resolution, greater imaging depth and breadth, and faster scan speed. SSOCT has been used for epidemiologic characterization of the fundus, with good repeatability.
In this cross-sectional study, we investigated several retinal and choroidal characteristics, including the thickness of the retina, choroid, ganglion cell layer, and nerve fiber layer, using SSOCT in children aged 7-13 years, to elucidate the anatomic and topographic variations of the choroidal and retinal layers among children of different refractive status.
Methods
Setting and Participants
This cross-sectional study was conducted according to the tenets of the Declaration of Helsinki and was approved by the Institutional Review Board of Shanghai General Hospital, Shanghai Jiao Tong University. All of the children understood the study protocol, and written informed consents were provided by their parents or other guardians.
A primary school located in Shanghai, China, was randomly selected using cluster sampling. All of the students aged 7-13 years were screened for enrollment into the study in January 2015. They were excluded if (1) there was a self-reported history of intraocular surgery or pathology (eg, retinopathy of prematurity, congenital glaucoma, congenital cataract, etc); (2) the parents were unwilling or unable to give written informed consent; or (3) the participant was unwilling or unable to give verbal informed assent. The research team consisted of 1 ophthalmologist, 5 optometrists, and 2 public health physicians. The investigation site was set up within the school.
Research Methods
Participants’ age and sex were recorded according to state-issued identification cards, and height and weight were measured. Body mass index (BMI) was calculated using the formula: weight (kg)/[height (m)] 2 . Self-reported background information, including the participants’ birth history, birth weight, and refractive status of the parents, were collected by means of a questionnaire.
Each participant underwent comprehensive ophthalmic examinations, including visual acuity, sensorimotor examination, slit-lamp biomicroscopy, tonometry, cycloplegic refraction, and fundus examination. This was followed by ancillary testing, including axial length, corneal curvature measurements, and SSOCT. Visual acuity was measured using a retroilluminated Early Treatment Diabetic Retinopathy Study (ETDRS) chart at a distance of 4 m. Cycloplegia was achieved by administering 1 drop of topical 0.5% proparacaine (Alcaine; Alcon, Fort Worth, Texas, USA) followed by 2 doses of 1% cyclopentolate (Cyclogyl; Alcon) applied 5 minutes apart. After 30 minutes, if the pupils were still reactive to light and the pupil size was estimated to be less than 6 mm, a third drop of cyclopentolate was administered. Corneal curvature and refraction were determined using a desk-mounted auto-refractor (model KR-8900; Topcon, Tokyo, Japan). Spherical equivalent refraction (SER) was used to classify refractive status. Hyperopia was defined as SER ≥0.5 diopters (D) and myopia was defined as SER ≤-0.5 D. Intraocular pressure was measured using a noncontact tonometer (model NT-4000; Nidek Inc, Fremont, California, USA) prior to dilation. Axial length was measured using noncontact optical biometry (IOLMaster, version 5.02; Carl Zeiss Meditec, Oberkochen, Germany).
SSOCT (model DRI OCT-1 Atlantis; Topcon), with a lateral resolution of 10 μm and a depth resolution of 8 μm, was used to measure the thickness of choroid and retinal layers. The machine uses a 1050-nm-wavelength light source and has a scanning speed of 100 000 A-scans per second. The 12-line radial scan pattern with a resolution of 1024 × 12 was used. Each image was an average of 4 overlapped consecutive scans, which covered an area of 12 mm × 9 mm, centered on the fovea.
Built-in software was used to segment layers and construct topographic maps. Choroidal thickness was measured as the distance between the Bruch membrane and the choroid-sclera interface; retinal thickness was measured as the distance between the internal limiting membrane and the interface between photoreceptor outer segments and retinal pigment epithelium. The ganglion cell layer thickness was measured as the distance from the interface between the nerve fiber layer and the ganglion cell layer to the interface between the inner plexiform layer and the inner nuclear layer. The nerve fiber layer thickness was measured as the distance between the internal limiting membrane and the interface between the nerve fiber layer and the ganglion cell layer ( Figure 1 ).
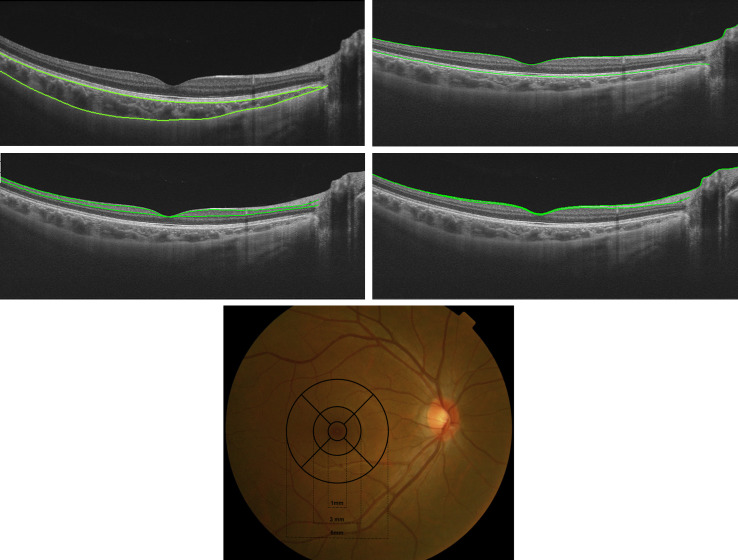
All acquired images were inspected, and if automatic segmentation errors occurred or resulted in measurement artifacts, manual segmentation was performed. The ETDRS grid was applied once the tomography map was obtained, which divided the macula into 3 concentric circles centered on the fovea: the central foveal circle (diameter = 1 mm), the parafoveal circle (diameter = 3 mm), and the perifoveal circle (diameter = 6 mm). The parafoveal region and the perifoveal region were further subdivided into superior, inferior, temporal, and nasal subfields ( Figure 1 ). The average thickness of the choroid, retina, ganglion cell layer, and nerve fiber layer of each subfield was calculated with the built-in software.
A single technician performed all the SSOCT image acquisitions between 9 AM and 11 AM, to reduce the impact of diurnal variation. Images with signal strength below 60 were rejected and the test was repeated. On the first 20 participants, the SSOCT was performed twice in order to assess measurement reproducibility.
Statistical Analyses
SAS (version 8.0; SAS Institute, Cary, North Carolina, USA) was used for all the statistical analyses, and all data were doubly entered independently by 2 research associates and all discrepancies adjudicated. Although data were acquired from both eyes, only the right eye data were used for statistical analysis. The characteristics were presented as the means ± standard deviation for continuous variables that were normally distributed and as rates (proportions) for categorical data.
The data distribution was examined using Kolmogorov-Smirnov test. All the SSOCT measurements were normally distributed, and intergroup differences were tested by t test (between sexes) and variance analysis (between refractive groups). The categorical variables were compared with the χ 2 test. Comparisons among different measurement spots of the same eye were made using repeated measures analysis of variance and contrast analysis (MANOVA). Stepwise multiple regression analysis was performed to determine the independent factors of central foveal choroidal and retinal layers. Linear correlation testing was used to assess the relationship between the thickness of the retina and choroid and SER. Statistical significance was defined as P < .05 (2-tailed).
Results
Patient Characteristics
Among the 299 participants enrolled in the study, 9 were excluded owing to poor cooperation, and another 14 were excluded because of poor SSOCT images. Therefore, of enrolled participants, a final total of 276 (92.31%) were included in the study. There was no significant difference in sex or age between the included and excluded participants (all P > .05).
The mean age of the participants was 9.69 ± 1.17 years (range: 7-13 years). Six children had best-corrected vision less than 20/25 equivalence, attributed to amblyopia; 18 children had best-corrected vision of 20/25 equivalence; and all remaining children had a best-corrected visual acuity of 20/20 equivalence. Axial lengths ranged between 20.0 mm and 26.6 mm. The SER ranged between −9.00 D and + 5.25 D, with a mean of −0.15 ± 1.60 D. Eighty-six of the participants had myopia (31.2%), and 99 had hyperopia (35.9%). The mean age and mean BMI of hyperopic participants were lower than those of emmetropic and myopic subjects ( P < .01). More boys were emmetropic, while more girls were hyperopic or myopic. Compared with emmetropic subjects, those with myopia had a longer axial length, and those with hyperopia had a shorter axial length ( Table 1 ).
| Parameter | Total N = 276 | Myopic N = 86 | Emmetropic N = 91 | Hyperopic N = 99 | P |
|---|---|---|---|---|---|
| Age, y | 9.70 ± 1.17 | 10.10 ± 1.09 | 9.85 ± 1.19 | 9.24 ± 1.06 | <.01 a |
| Male | 145 (52.54) | 41 (47.67) | 59 (64.84) | 45 (45.45) | .02 b |
| BMI, kg/m 2 | 17.77 ± 3.14 | 17.98 ± 3.10 | 18.40 ± 3.39 | 17.03 ± 2.82 | .01 a |
| Preterm history | 55 (19.92) | 16 (18.60) | 18 (19.78) | 21 (21.21) | .87 b |
| Axial length, mm | 23.38 ± 0.99 | 24.17 ± 0.96 | 23.25 ± 0.72 | 22.81 ± 0.77 | <.01 a |
| Intraocular pressure, mm Hg | 17.65 ± 3.05 | 17.56 ± 2.50 | 17.19 ± 3.27 | 18.15 ± 3.24 | .10 a |
| Refractive error, D | −0.15 ± 1.60 | −2.00 ± 1.45 | 0.18 ± 0.26 | 1.16 ± 0.69 | <.01 a |
a Statistical significance was tested using variance analysis.
The choroidal thickness measurement with SSOCT was highly reproducible in each subfield, with a test-retest correlation coefficient of 0.97-0.99 (n = 20). In the central foveal location, average choroidal thickness was thickest in hyperopic subjects, followed by that in emmetropic and myopic subjects. No statistical difference was observed in the central foveal thickness of the retina, ganglion cell layer, or nerve fiber layer between the different refractive groups ( Table 2 ). There was no significant difference between the sexes in the central foveal choroidal thickness (261 ± 65 μm vs 269 ± 68 μm, P = .37) and central foveal retinal thickness (236 ± 25 μm vs 233 ± 27 μm, P = .13). Age was negatively associated with central foveal retinal thickness (r = −0.23, P < .01), ganglion cell layer thickness (r = −0.28, P < .01), and nerve fiber layer thickness (r = −0.17, P < .01), but there was no significant association between age and central foveal choroidal thickness ( P = .34).
| Subfield | Layer | Total | Myopic | Emmetropic | Hyperopic | P a |
|---|---|---|---|---|---|---|
| Central fovea | Choroid | 251 ± 61 | 227 ± 61 | 253 ± 58 | 271 ± 55 | <.01 |
| Retina | 235 ± 26 | 234 ± 22 | 232 ± 23 | 238 ± 31 | .18 | |
| Ganglion cell layer | 47 ± 14 | 47 ± 11 | 45 ± 12 | 49 ± 16 | .59 | |
| Nerve fiber layer | 10 ± 9 | 10 ± 6 | 9 ± 8 | 11 ± 12 | .17 | |
| Parafoveal Nasal | Choroid | 222 ± 58 | 199 ± 60 | 222 ± 56 | 241 ± 52 | <.01 |
| Retina | 309 ± 21 | 308 ± 14 | 309 ± 23 | 309 ± 23 | .13 | |
| Ganglion cell layer | 93 ± 10 | 93 ± 6 | 93 ± 10 | 92 ± 11 | .65 | |
| Nerve fiber layer | 26 ± 9 | 27 ± 4 | 25 ± 11 | 26 ± 10 | .44 | |
| Parafoveal Temporal | Choroid | 267 ± 61 | 244 ± 63 | 267 ± 57 | 284 ± 58 | <.01 |
| Retina | 293 ± 20 | 291 ± 16 | 293 ± 22 | 293 ± 20 | .82 | |
| Ganglion cell layer | 87 ± 9 | 87 ± 8 | 88 ± 8 | 86 ± 10 | .49 | |
| Nerve fiber layer | 19 ± 6 | 20 ± 4 | 18 ± 4 | 20 ± 8 | .10 | |
| Parafoveal Superior | Choroid | 252 ± 59 | 225 ± 63 | 250 ± 55 | 274 ± 52 | <.01 |
| Retina | 310 ± 18 | 306 ± 20 | 312 ± 16 | 312 ± 19 | .03 | |
| Ganglion cell layer | 92 ± 10 | 92 ± 8 | 94 ± 9 | 91 ± 13 | .06 | |
| Nerve fiber layer | 30 ± 9 | 29 ± 6 | 29 ± 11 | 31 ± 9 | .18 | |
| Parafoveal Inferior | Choroid | 254 ± 60 | 233 ± 61 | 254 ± 58 | 270 ± 58 | <.01 |
| Retina | 301 ± 20 | 301 ± 18 | 304 ± 20 | 298 ± 22 | .13 | |
| Ganglion cell layer | 90 ± 11 | 91 ± 9 | 92 ± 10 | 87 ± 14 | .04 | |
| Nerve fiber layer | 26 ± 9 | 27 ± 6 | 26 ± 10 | 24 ± 9 | .11 | |
| Perifoveal Nasal | Choroid | 179 ± 52 | 161 ± 51 | 177 ± 50 | 195 ± 51 | <.01 |
| Retina | 291 ± 22 | 285 ± 20 | 291 ± 24 | 296 ± 21 | <.01 | |
| Ganglion cell layer | 72 ± 8 | 69 ± 6 | 73 ± 8 | 74 ± 8 | <.01 | |
| Nerve fiber layer | 52 ± 10 | 54 ± 7 | 51 ± 9 | 52 ± 12 | .25 | |
| Perifoveal Temporal | Choroid | 270 ± 56 | 250 ± 55 | 271 ± 52 | 285 ± 56 | <.01 |
| Retina | 265 ± 18 | 260 ± 16 | 265 ± 19 | 268 ± 17 | <.01 | |
| Ganglion cell layer | 74 ± 8 | 72 ± 7 | 75 ± 7 | 74 ± 9 | <.01 | |
| Nerve fiber layer | 23 ± 4 | 23 ± 4 | 23 ± 4 | 24 ± 6 | .72 | |
| Perifoveal Superior | Choroid | 248 ± 54 | 222 ± 59 | 249 ± 48 | 268 ± 48 | <.01 |
| Retina | 278 ± 17 | 272 ± 13 | 280 ± 17 | 281 ± 20 | <.01 | |
| Ganglion cell layer | 65 ± 7 | 64 ± 7 | 65 ± 8 | 65 ± 8 | <.01 | |
| Nerve fiber layer | 47 ± 26 | 45 ± 6 | 50 ± 42 | 45 ± 10 | .36 | |
| Perifoveal Inferior | Choroid | 244 ± 55 | 226 ± 54 | 244 ± 55 | 258 ± 51 | <.01 |
| Retina | 272 ± 17 | 265 ± 19 | 274 ± 14 | 277 ± 18 | <.01 | |
| Ganglion cell layer | 67 ± 8 | 63 ± 7 | 69 ± 9 | 69 ± 9 | <.01 | |
| Nerve fiber layer | 44 ± 9 | 45 ± 9 | 45 ± 10 | 42 ± 8 | .03 |
a Statistical significance was tested using repeated measures analysis of variance analysis (RMANOVA).
Topographic Variation of Choroid and Retinal Layers in Participants of Different Refractive Status
The thickness of the choroid increased from the nasal quadrant to the temporal quadrant, horizontally, while vertically the choroid in the parafoveal subfields was thicker than that in the perifoveal subfields ( Figure 2 ). The total retinal thickness and the ganglion cell layer thickness of the parafoveal regions were highest, followed by those of the perifoveal areas, while those of the central fovea were the lowest ( Figures 3 and 4 ). However, nerve fiber layer thickness increased with the distance to the fovea ( Figure 5 ). All of the retinal layers were thicker in the nasal quadrant and thinner in the temporal quadrant.


