Purpose
To compare analyses of choroidal thickness and volume in healthy eyes measured concurrently with prototype long-wavelength swept-source optical coherence tomography (OCT) and commercially available spectral-domain optical coherence tomography (OCT) with and without enhanced depth imaging (EDI).
Design
Prospective cross sectional study.
Methods
The study included 19 healthy subjects (19 eyes), who were prospectively recruited to undergo 2 consecutive imaging sessions on the same randomly selected eye using spectral domain OCT and a prototype long-wavelength swept-source OCT. On spectral domain OCT, 2 line scans, 1 with and 1 without EDI, and 1 volumetric scan were obtained. On swept-source OCT, 1 line scan and 1 volumetric scan were obtained. Scan patterns on swept-source OCT were created to simulate those available on Cirrus HD-OCT to keep the time of image acquisition constant. Swept-source OCT volumetric scans were motion corrected using a novel registration algorithm. Choroidal thickness and volume were analyzed.
Results
The choroidoscleral interface was clearly visualized in 19/19 (100%) of eyes imaged by swept-source OCT, compared to 14/19 (73.6%) and 13/19 (68.4%) eyes imaged by spectral domain OCT, with and without EDI, respectively. There was no significant difference in choroidal thickness measurements on the line scans obtained on either system ( P = 0.10). Choroidal volume could not be assessed on volumetric scans from spectral domain OCT. Mean choroidal volume from swept-source OCT volumetric scans was 11.77 ± 3.13 mm 3 (6.43 mm 3 -17.15 mm 3 ).
Conclusion
This is the first study that compares simultaneously a prototype long-wavelength swept-source OCT to a commercially available spectral domain OCT for a detailed analysis of choroid in healthy eyes. Swept-source OCT shows potential for better choroidal analysis. Studies using swept-source OCT in diseased eyes will further define this new technology’s utility in chorioretinal diseases.
Optical coherence tomography (OCT) has become one of the most important ancillary tests in ophthalmic practice. Its utility is based on its ability to quantify retinal thickness and reveal changes in morphology of the retina in normal and diseased states. Currently available spectral-domain OCT systems, which operate at central wavelengths of 800-870 nm, are being used increasingly to assess the thickness, morphology and vascular layers of the choroid in healthy and diseased eyes.
An accurate analysis of the choroid requires a precise visualization of the choroidoscleral interface. Spectral domain OCT systems use a signal enhancement technique of image averaging that involves acquiring multiple frames (B-scans) at the same retinal location that are then averaged together to increase the signal-to-noise ratio, allowing enhanced visualization of the retina and choroid. More recently, an enhanced depth imaging (EDI) technique has become available to better visualize the choroid. It involves image averaging in conjunction with setting the choroid adjacent to the 0 delay line, which is the axial range position of maximal sensitivity for signal detection. This allows for an enhanced visualization of the choroidoscleral interface. The choroidoscleral interface has been visualized to varying degrees and sensitivities using various spectral domain OCT systems and imaging techniques. Studies using the Cirrus spectral domain OCT system and the Topcon spectral domain OCT system, both without EDI, demonstrate accurate visualization of the choroidoscleral interface in approximately 65%–75% of healthy and diseased eyes. A recent study using the Spectralis spectral domain OCT (Heidelberg Engineering, Heidelberg, Germany) with EDI showed successful visualization of the choroidoscleral interface for measurement of the sub-foveal choroidal thickness in 93% of 3468 healthy eyes, which is, to date, the largest study analyzing the visualization of the choroidoscleral interface in healthy eyes. The inability to delineate the choroidoscleral interface in some eyes using spectral domain OCT systems is attributed to an inadequate penetration of light into the deeper tissue and a backscattering of light due to the hyper-reflective retinal pigment epithelium (RPE). Longer wavelength spectral domain OCT systems operating in the 1050-1060 nm wavelength regime are also being used to analyze the choroid because the reduced light scattering at longer wavelengths provides deeper penetration into the tissue and thus improves visualization of the choroid.
An alternative Fourier-domain detection method to spectral domain OCT is the swept-source OCT technology. Swept-source OCT uses a wavelength-sweeping laser and a dual-balanced photo detector instead of a broadband super-luminescent diode, spectrometer and high-speed line-scan camera. This wavelength tunable laser light source allows for a much higher image acquisition speed (∼100,000 A-scans/second). In addition, the use of longer wavelengths (centered at 1050-1060 nm) allows for better light penetration into the deeper tissue and lower sensitivity roll-off vs depth that is characteristic of the spectral domain OCT technology, allowing full-depth volumetric imaging of the choroid without the need for EDI. Recently, Ikuno and associates, Hirata and associates and Ruiz-Moreno and associates used swept-source OCT to analyze choroidal thickness in healthy adult and pediatric eyes and showed good reproducibility of choroidal thickness measurements. Hirata and associates also showed an assessment of the choroidal volume of the healthy eyes using swept-source OCT. To our knowledge, however, a comparison of a prototype swept-source OCT with a commercially available spectral domain OCT with and without EDI for a detailed analysis of the choroid including its thickness as well as volume has not been performed to-date. With increasing evidence of the involvement of choroid in retinal diseases, such a comparison is imperative to assess the clinical utility of swept-source OCT technology over the currently available spectral domain OCT systems.
The aim of the present study was to compare a prototype long-wavelength swept-source OCT system with a commercially available spectral domain OCT system with and without EDI for analysis of the thickness and volume of the choroid in healthy eyes.
Methods
Subjects
We prospectively recruited 19 healthy subjects (19 eyes) at the New England Eye Center, Boston, Massachusetts, between September and November 2012, for consecutive high-definition raster scanning with and without EDI on a spectral domain OCT system (Cirrus HD-OCT, software v 6.0; Carl Zeiss Meditec, Dublin, California) and a prototype swept-source OCT system developed at Massachusetts Institute of Technology (Cambridge, Massachusetts) and deployed at the New England Eye Center (Boston, MA). All subjects had a best-corrected visual acuity of 20/20 or better and underwent fundus examination to exclude any existing retinal or choroidal pathology. Informed consent was obtained from all subjects prior to enrolment in the study. This study was approved by the institutional review boards of Tufts Medical Center and the Massachusetts Institute of Technology, and is adherent to the tenets of Declaration of Helsinki.
Spectral Domain OCT and Swept-Source OCT Systems
The spectral domain OCT system used in this study was the Cirrus HD-OCT (Carl Zeiss Meditec). It performs imaging with light at ∼800 nm wavelength, an axial resolution of ∼5 μm in tissue, and an imaging speed of 27,000 A-scans/second. The swept-source OCT system employed in this study uses a light source with a wavelength-sweeping laser centered at 1050 nm, yielding an axial resolution of ∼5.3 μm in tissue and an imaging speed of 100,000 A-scans/second, which is ∼3.7 times faster than Cirrus HD-OCT.
Imaging Protocols
A single operator trained in acquiring images on the 2 systems acquired all images. One randomly selected eye of each subject was imaged consecutively within 10 minutes on the 2 systems. All images were taken as close to the fovea as possible to ensure that the same retinal location was imaged using the 2 systems in all eyes. Two scan patterns were employed per system. The scan patterns on swept-source OCT were created to replicate those available on the Cirrus HD-OCT for adequate comparison, such that the time of image acquisition was kept constant for each scan pattern on both the systems:
- 1)
Line scans for analysis of the visualization of the choroidoscleral interface and choroidal thickness measurements. The scan pattern employed on Cirrus HD-OCT is the 6 mm scan, which is acquired in 0.75 seconds and consists of 1000 A-scans/frame with averaging of 20 frames (B-scans). All subjects were scanned first without the EDI function (spectral domain OCT non-EDI) and then using the EDI function (spectral domain OCT EDI). The scan pattern created on the prototype swept-source OCT is a 6 mm scan and consists of 1000 A-scans/frame with averaging of 75 frames within the same acquisition time as on Cirrus HD-OCT (0.75 seconds).
- 2)
Volumetric scans for analysis of the volume of the choroid. The scan pattern employed on Cirrus HD-OCT is the macular cube protocol that obtains 512 × 128 A-scans (512 A-scans per frame; 128 frames or B-scans) in a 6 × 6 mm region centered at the fovea in 2.4 seconds. The scan pattern employed on the prototype swept-source OCT obtains two orthogonally scanned 350 × 350 A-scans (350 A-scans per frame; 350 frames or B-scans) volumes in a 6 × 6 mm region centered at the fovea within the same acquisition time (2.4 seconds for each volume).
A novel motion correction algorithm was applied to the orthogonally scanned swept-source OCT volumes; this method has been described previously. After motion correction, the volumetric data sets are undistorted and merge into a single volume with improved signal quality.
Analysis of Choroidoscleral Interface and Choroidal Thickness Measurements
Two independent observers experienced in analyzing OCT images assessed all the line scans for visualization of the choroidoscleral interface. Where the choroidoscleral interface was visualized, choroidal thickness was measured from the outer border of the hyper-reflective RPE to the inner border of the choroidoscleral interface at 7 locations: beneath the fovea and at 500 μm intervals up to 1500 μm temporal and nasal to the fovea. This method has been described previously. The Cirrus spectral domain OCT linear measurement tool was used to measure choroidal thickness on line scans obtained on Cirrus HD-OCT and Microsoft Powerpoint for Macintosh (2011, v 14.3.2) was used to measure choroidal thickness on the line scans obtained on swept-source OCT. For swept-source OCT line scans, the pixel dimensions of the original images were noted before importing them into Microsoft Powerpoint. The images were enlarged, and precise choroidal thickness measurements were obtained by the 2 observers using the Microsoft Powerpoint tools. The measurements were rescaled to the micron unit on the basis of the original pixel dimensions of the original images. Interobserver correlations for choroidal thickness measurements obtained from all the line scans were determined.
Analysis of Choroidal Volume
All volumetric scans were exported from the Cirrus HD-OCT and swept-source OCT systems and imported into a data analysis and processing software, AMIRA (Software v 5.2.1, Visualization Sciences Group, Bordeaux and Zuse Institute Berlin, Berlin, Germany). Calibration of the scan depth and transverse range of the respective OCT system provided accurate dimensions of the volumetric element of the 3-dimensional data set (VOXEL, volumetric pixel). This enabled determination of the VOXEL volume. Two independent observers experienced in analyzing OCT images performed manual segmentation of the choroid on every 10th frame within each volumetric scan. As for choroidal thickness measurements (described above), the inner border of the choroid was defined as the outer aspect of the hyper-reflective RPE, and the outer border of the choroid was defined as the inner aspect of the choroidoscleral interface for volumetric choroidal analysis. An automated interpolation of the manual segmentations on every 10th frame was applied to the unsegmented frames within each volumetric scan using the interpolation tool in AMIRA (Software v 5.2.1, Visualization Sciences Group, Bordeaux and Zuse Institute Berlin, Berlin, Germany). After interpolation, all frames (B-scans) within each volumetric scan were reassessed for the accuracy of segmentation. A VOXEL number was generated by AMIRA automatically by combining all the segmentations within each volumetric scan. Interobserver correlation was determined for the VOXEL numbers, and an average VOXEL number of the 2 independent observers was determined. The volume of choroid in each eye was obtained by multiplying the VOXEL volume by the VOXEL number.
Statistical Analysis
All data were expressed as mean ± standard error of the mean (SEM). A 2-way ANOVA with the Bonferroni post-test was used to determine the difference in the choroidal thickness measurements obtained from spectral domain OCT non-EDI, spectral domain OCT EDI and swept-source OCT line scans. Interobserver correlation for all measurements was determined using a Pearson correlation and an intraclass correlation coefficient. The methods of Bland and Altman were then used to calculate the mean difference in the subfoveal choroidal thickness measurements between spectral domain OCT non-EDI and spectral domain OCT EDI, spectral domain OCT non-EDI and swept-source OCT, and spectral domain OCT EDI and swept-source OCT. The reproducibility of subfoveal choroidal thickness was quantified using the bias and was analyzed by the concordance coefficient with a 95% confidence interval. All statistics were performed using Graph Pad Prism 5.0 software for Macintosh (GraphPad Software, La Jolla, California) and SPSS Statistics (v 19; IBM, Chicago, Illinois). A 95% confidence interval and a 5% level of significance were adopted; therefore, results with a P value less than or equal to 0.05 were considered significant.
Results
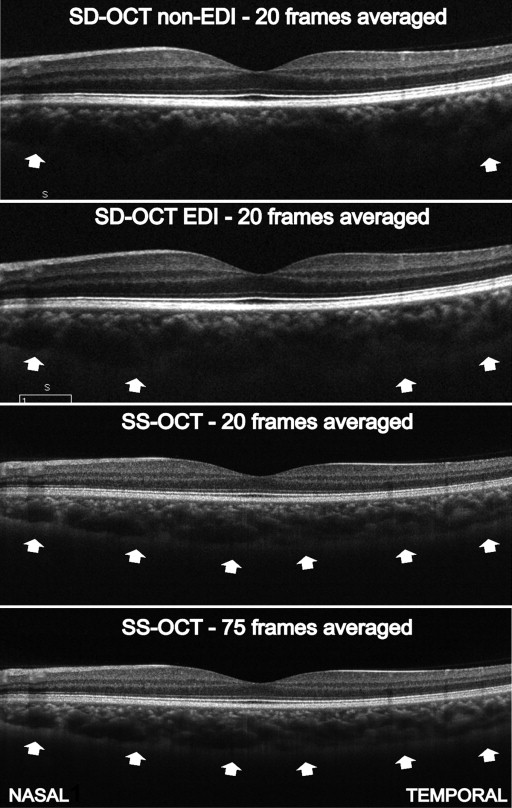
The 19 subjects had a mean age of 29 years (23–41 years). There were 11 females (58%) and 8 males (42%). The choroidoscleral interface was clearly visualized on the line scans in 19/19 (100%), 14/19 (73.6%) and 13/19 (68.4%) of eyes imaged with swept-source OCT, spectral domain OCT EDI, and spectral domain OCT non-EDI, respectively. Figure 1 shows a representative example of an improved visualization of the choroidoscleral interface with swept-source OCT when compared to spectral domain OCT non-EDI and spectral domain OCT EDI.
At all locations, there was no significant difference in the mean choroidal thickness measurements and the mean subfoveal choroidal thickness measurements obtained on spectral domain OCT non-EDI, spectral domain OCT EDI and swept-source OCT line scans (n = 13; P = 0.10 and P = 0.67, respectively; Figure 2 ). The Bonferroni post-test revealed no significant difference in the choroidal thickness measurements in any pair of the 3 line scans ( P > 0.05). A strong positive interobserver correlation for choroidal thickness measurements existed on the line scans ( Figure 3 ). The intraclass correlation coefficients for the 2 observers for choroidal thickness measurements were 0.90 (0.88–0.93) for spectral domain OCT non-EDI, 0.97 (0.92–0.98) for spectral domain OCT EDI and 0.98 (0.93–0.99) for swept-source OCT ( P < 0.0001). The 95% limits of agreement for the mean subfoveal choroidal thickness measurements were –11.53%–9.39% (bias –1.07) between spectral domain OCT non-EDI and spectral domain OCT EDI; –22.8%–20.6% (bias –1.06) between spectral domain OCT non-EDI and swept-source OCT; and –15.9%–15.9% (bias –0.007) between spectral domain OCT EDI and swept-source OCT ( Figure 4 ).


