Purpose
To measure oxygen (pO 2 ) in eyes of patients undergoing intraocular surgery and identify correlations with central corneal thickness (CCT).
Design
Prospective, cross-sectional study.
Methods
setting : Institutional. patient population : 124 patients undergoing cataract and/or glaucoma surgery. observation procedure : Prior to surgery, an oxygen sensor was introduced into the anterior chamber (AC) via peripheral corneal paracentesis. The tip of the flexible fiberoptic probe was positioned for 3 measurements in all patients: (1) near central corneal endothelium; (2) in mid-AC; and (3) in AC angle. In patients undergoing cataract extraction, additional measurements were taken (4) at the anterior lens surface and (5) in the posterior chamber. main outcome measures : pO 2 measurements at 5 locations within the eye were compared to central corneal thickness measurements by multivariate regression analyses.
Results
There was a statistically significant inverse correlation between CCT and pO 2 in the anterior chamber angle ( P = .048). pO 2 was not significantly related to CCT at any other location, including beneath the central cornea. Regression analysis relating CCT to age, race, and oxygen levels in all 5 locations in the anterior segment revealed an association of a thinner cornea with increasing age ( P = .007).
Conclusions
Physiologic correlations with central corneal thickness may provide clues to understanding why a thinner cornea increases the risk of open glaucoma. Associations between glaucoma risk, CCT, and pO 2 in the AC angle suggest that exposure of the outflow system to increased oxygen or oxygen metabolites may increase oxidative damage to the trabecular meshwork cells, resulting in elevation of intraocular pressure.
Although elevated intraocular pressure (IOP) is the most significant risk factor for the development of glaucoma, recent studies revealed an association between central corneal thickness (CCT) and the risk of developing glaucoma, the leading cause of irreversible blindness worldwide. However, the importance of CCT in glaucoma was not studied more closely until validated in the Ocular Hypertension Treatment Study (OHTS). Measurement of CCT is now considered to be the standard of care in the evaluation of a patient at risk for glaucomatous optic neuropathy. The Early Manifest Glaucoma Trial (EMGT), which enrolled subjects with glaucoma damage not based on IOP measurement, correlated the effect of CCT on glaucomatous progression. In spite of the small size, the homogeneity of the study population, and the relatively short follow-up, CCT correlated with progression. A thinner cornea is not only a strong predictive risk factor for progression of ocular hypertension to open-angle glaucoma (OAG), but also correlates with the severity of visual field damage and more rapid progression of visual field loss. In addition, a recent publication from the OHTS trial data indicated that using a formula to adjust the IOP for CCT does not improve the prediction model for open-angle glaucoma. Although this does not prove a role for CCT as an independent risk factor in this population, it remains an important risk factor without a physiologic explanation.
Although Jonas and associates confirmed that thinner CCT correlated significantly with the area of the neuroretinal rim and inversely with visual field loss at the time of referral, they noted progression of the neuropathy to be independent of CCT. These investigators did not find a correlation with CCT and thickness of the lamina cribrosa or development of glaucomatous optic disc hemorrhages.
Anatomic and mechanical links between corneal thickness and the structural properties of the optic disc and lamina cribrosa have been identified. Disc area, cup depth, and elasticity of the lamina cribrosa have been shown to be associated with CCT. A statistically significant correlation of scleral thickness and CCT has been described among patients with normal-tension glaucoma, but not in controls or patients with ocular hypertension or primary OAG. Genome-wide association studies identified a significant association between CCT and variants linked to the α2 chain of collagen VIII and the α1 chain of collagen V. Although this statistical association is robust, the mechanistic link between collagen expression or function and glaucoma pathogenesis remains unclear.
In spite of these clinical, anatomic, and genetic correlates, no physiologic associations with CCT have been identified. We report that thinner corneas are associated with increased partial pressure of oxygen (pO 2 ) in the anterior chamber angle in patients undergoing cataract and/or glaucoma surgery.
Methods
Study Design
The Human Resource Protection Office and the Institutional Review Board of the Washington University School of Medicine prospectively approved this study, which is compliant with HIPAA guidelines and conforms to the tenets of the Declaration of Helsinki. Informed consent was obtained from the subjects after explanation of the nature and possible consequences of the study. The prospective, cross-sectional study was designed to measure oxygen distribution in different regions of the eye in a reference group, with no previous cataract or vitrectomy surgery, and to evaluate correlations with patient characteristics.
Patients and Oxygen Measurements
Patients undergoing cataract and/or open-angle glaucoma surgery in a single subspecialty practice (C.J.S.) were eligible for this study. Patients were excluded from the study if they had evidence of corneal endothelial dysfunction, ischemic ocular disease, anterior chamber angle closure, inflammatory disease, ocular neoplasia, shallow anterior chamber, or monocular status. Patients with prior ocular surgery, except for laser therapy and glaucoma filtering surgery, were also excluded from participation.
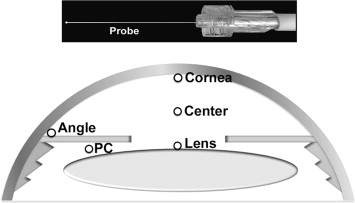
A complete general medical and ophthalmic history was obtained, as well as a complete ophthalmic examination. Central corneal thickness (CCT) was measured by ultrasound (DGH 55 Pachmate; DGH Technology, Inc, Exton, Pennsylvania, USA). Axial length measurements were recorded on patients undergoing cataract extraction (Zeiss IOLMaster; Carl Zeiss Meditec, Jena, Germany). Race was self-reported using a standardized questionnaire. As per usual surgical protocol, the patient was placed in the supine position and intravenous sedation was administered. Supplemental oxygen was provided by nasal cannula. The surgical field was completely separated from the cannula using an adhesive surgical drape to avoid any additional oxygen exposure to the eye. Blood oxygen saturation (SaO 2 ) monitoring was performed by continuous pulse oximetry and maintained between 95% and 100%. The surgical eye was prepared and draped and a lid speculum was placed. A sub-Tenon injection of 3 mL of 2% lidocaine and 0.375% bupivacaine (50:50) was performed to provide local anesthesia. Prior to the planned surgical procedure, a 30 gauge needle was used for entry into the anterior chamber to fashion a peripheral corneal paracentesis and the Oxylab pO 2 optical oxygen sensor (optode; Oxford Optronix, Oxford, United Kingdom) was carefully introduced into the anterior chamber without leakage of aqueous humor ( Figure , Top). Instrument calibration was checked prior to and following each set of measurements. The tip of the flexible fiberoptic probe was positioned for 3 measurements in all patients by the surgeon (C.J.S.; Figure , Bottom): (1) near the central corneal endothelium, (2) in the mid-anterior chamber (AC), and (3) in the AC angle. In patients scheduled to undergo cataract extraction, additional measurements were taken (4) at the anterior lens surface and (5) in the posterior chamber just behind the iris. This avoided risk of damage to the lens in patients who were to remain phakic after the operative procedure. Each measurement required a mean of 46.2 seconds for accurate probe positioning and stabilization of the pO 2 level. Patients were monitored postoperatively for any complications.
Statistical Analysis
Results are expressed as mean values ± standard deviation (SD). Statistical analyses were performed using SPSS software Version 17.0 (SPSS, Chicago, Illinois, USA). Multivariate regression analyses were performed with adjustment for all potential confounding variables measured. Probability values less than .05 were considered statistically significant.
Results
A total of 124 patients participated. There were 53 male and 71 female subjects, 37 African American and 87 white. The mean age was 70.4 years. The pO 2 in different regions of the eye was not related to surgical diagnosis or surgical procedure performed. The study group included patients with no previous intraocular ocular surgery (77 eyes) and patients with prior laser (22 eyes) or glaucoma filtering surgery (25 eyes). Glaucoma patients were divided into those with medically controlled IOP and those for whom medical control was not adequate. Glaucoma patients were also subdivided into 3 groups based on their visual field loss, as a measure of glaucoma severity. The oxygen levels at the 5 locations, patient age, axial length, and CCT are shown in Table 1 . There was no significant difference in the 2 groups (glaucoma plus cataract vs cataract only).
| Glaucoma + Cataract (N = 107) | Cataract Only (N = 17) | P Value | |
|---|---|---|---|
| Age (y) | 70.2 ± 10.0 | 71.2 ± 13.8 | .785 |
| CCT (μm) | 549.6 ± 38.0 | 556.3 ± 41.7 | .566 |
| Axial length (mm) | 24.0 ± 1.4 | 24.5 ± 2.0 | .329 |
| p O 2 at cornea (mm Hg) | 22.0 ± 6.8 | 22.6 ± 7.6 | .792 |
| p O 2 at center (mm Hg) | 10.3 ± 3.8 | 9.7 ± 5.2 | .660 |
| p O 2 at lens (mm Hg) | 2.1 ± 2.1 | 2.6 ± 2.8 | .454 |
| p O 2 at angle (mm Hg) | 12.0 ± 5.1 | 13.6 ± 4.9 | .244 |
| p O 2 at PC (mm Hg) | 3.7 ± 2.8 | 4.4 ± 2.7 | .370 |
For the study group, regression analysis that related CCT to age, race, and oxygen levels in all 5 locations in the anterior segment showed that having a thinner cornea was associated with increasing age ( P = .007) and increased pO 2 in the anterior chamber angle ( P = .048) ( Table 2 ). Oxygen levels at all other locations were not associated with CCT, even beneath the central cornea. As in our previous study, African Americans had significantly higher pO 2 in all 5 areas measured. These data are not shown because some patients were included in both studies. When adjusted for age and race, IOP that was not medically controllable was significantly associated with having a thinner cornea ( P = .045; Table 3 , left). Glaucoma severity, as measured by visual field loss classified as none, early, moderate, or severe, was not associated with CCT ( P = .127; Table 3 , right). Although African heritage has been associated with having a thinner cornea in other studies, it was not significantly associated with CCT in this patient group.
| β | P Value | |
|---|---|---|
| Age | −1.215 | .007 |
| Race | 7.841 | .489 |
| p O 2 at cornea | 0.314 | .741 |
| p O 2 at center | 0.446 | .782 |
| p O 2 at lens | −3.622 | .182 |
| p O 2 at angle | −2.204 | .048 |
| p O 2 at PC | −0.059 | .974 |
| β | P Value | β | P Value | |||
|---|---|---|---|---|---|---|
| Age | −0.919 | .007 | Age | −0.896 | .009 | |
| Race | −12.601 | .105 | Race | −11.649 | .137 | |
| IOP | −14.121 | .045 | Severity | −5.057 | .127 |
Stay updated, free articles. Join our Telegram channel

Full access? Get Clinical Tree


