Purpose
To compare the expression of calpain and caspase-12 in human lens epithelial cells (LECs) of cataract patients with or without diabetic retinopathy (DR).
Design
Prospective, comparative case series.
Methods
Patients were divided into 4 groups: patients without diabetes mellitus (DM) (Group 1), patients with DM and without diabetic retinopathy (DR) (Group 2), diabetic patients with nonprolifeative DR (NPDR) (Group 3), and diabetic patients with proliferative DR (PDR) (Group 4). Data on DM duration and glycated hemoglobin (HbA1c) level were collected. The LECs were obtained during cataract surgery and immunohistochemical staining was performed for calpain and caspase-12. The reactivity score of each specimen was determined using confocal microscopy.
Results
A total of 40 patients (40 eyes) were evaluated, and each group was composed of 10 patients. The expression of calpain and caspase-12 was highest in Group 4, followed by Group 3, Group 2, and Group 1 ( P < .001). The expressions were significantly higher with a longer duration of DM, increased HbA1c level, or advanced DR.
Conclusions
Endoplasmic reticulum stress may be associated with apoptosis of LECs, resulting in cataract formation in diabetic patients.
Diabetic cataract is a well-known cause of visual deterioration. Patients with diabetes mellitus (DM) tend to develop cataract earlier than non-DM patients, and chronic hyperglycemia plays a crucial role in the progression and acceleration of cataract. Furthermore, a higher prevalence of cataracts was reported in patients with longer DM duration and higher level of hemoglobin A1c (HbA1c). The normal aging process of the human crystalline lens includes aggregation, pigmentation, formation of disulfide and nondisulfide cross-links, fragmentation, and free radical formation. However, in the presence of chronic hyperglycemia, damage to the lens epithelial cells (LECs), a single cellular layer that constitutes the anterior surface of the lens and maintains the transparency of the lens, is thought to be the major factor of cataractogenesis in addition to the normal aging process. Elevated oxygen free radical formation, activation of the polyol pathway that causes excess sorbitol accumulation and epithelial cell swelling, and advanced glycation processes are the previously known pathogenic mechanisms of LEC homeostasis disruption.
Damaged LECs eventually undergo apoptosis through 1 of 2 main pathways: the extrinsic apoptosis pathway (death receptor mediated) or the intrinsic apoptotic pathway (mitochondria mediated). In the intrinsic apoptotic pathway, mitochondria release cytochrome c, which binds to apoptosis protease-activating factor-1 (Apaf-1) to form an apoptosome and activates caspase-9. Caspase-9 then subsequently activates caspase-3, which executes apoptosis by cell shrinkage or membrane blebbing. Jung and associates first reported overexpression of caspase-3 and caspase-9 in diabetic cataracts.
Caspase-12 is an upstream of caspase-9 in the mitochondria-mediated pathway and is activated by calpain, a calcium-activated, intracellular cysteine protease. Ca 2+ homeostasis in the lens is one of the important underlying mechanisms of lens transparency. This homeostasis is typically maintained by inward passive diffusion of Ca 2+ through membrane and outflux via Ca 2+ -adenosine triphosphatases (Ca 2+ -APTases) and Ca 2+ /Na + exchangers, located in the plasma membrane, sarcoplasmic membrane, and endoplasmic reticular membrane. However, when incubated in medium containing a high level of Ca 2+ , LECs were damaged, resulting in increased level of Ca 2+ in the lens and loss of cortex clarity. DM itself can lead to impaired membrane function, which results in a pathologically elevated level of lenticular Ca 2+ .
The aim of this study was to compare the expression of calpain and caspase-12 in LECs of diabetic patients with and without diabetic retinopathy (DR) and to determine the effect of DM duration and HbA1c level on the expression.
Methods
This prospective, comparative case series consists of patients older than 60 years who had clinically observable grade 2 or 3 nuclear cataracts according to the Lens Opacities Classification System III. Patients who received phacoemulsification and intraocular lens implantation by a single surgeon (S.K.C.) between April 1, 2015 and July 1, 2015 at St Paul’s Hospital, The Catholic University of Korea, were randomly selected, and informed consent was obtained from all patients after providing full explanation of the surgical procedures and possible complications. The study protocol followed the guidelines of the Declaration of Helsinki and was approved by the Institutional Review Board of The Catholic University of Korea, College of Medicine (PC16SASI0015).
The patients were divided into 4 groups: patients without DM (Group 1), patients with DM and without DR (Group 2), diabetic patients with nonprolifeative DR (NPDR) (Group 3), and diabetic patients with proliferative DR (PDR) (Group 4). Patients who underwent previous ocular surgery, and those with ocular disease other than DR or nuclear sclerosis harder than grade 3 were excluded from this study. Data on duration of DM and serum level of HbA1c were collected.
Immunohistochemical Staining of Lens Epithelial Cells and Quantification of Apoptosis
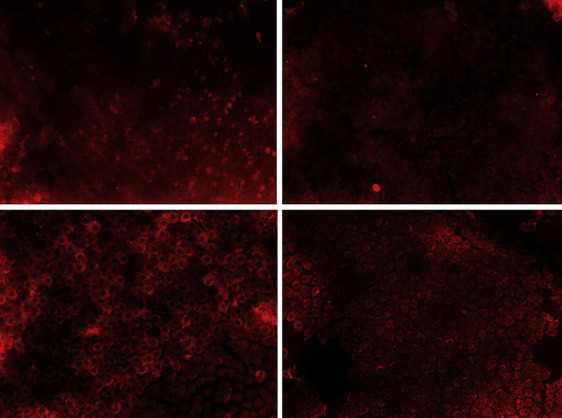
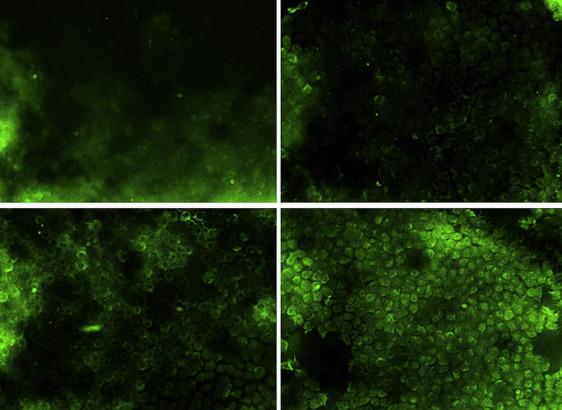
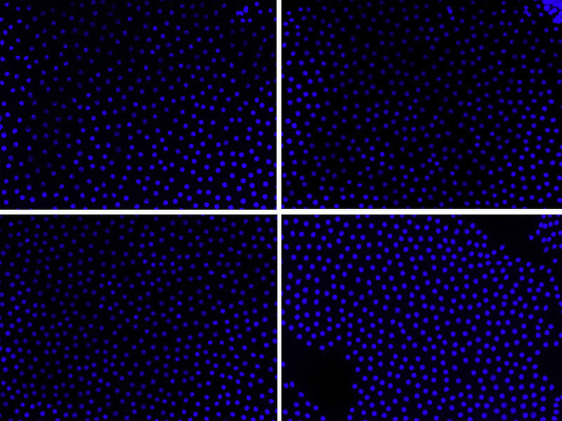
Topical lidocaine 4.0% and proparacaine hydrochloride 0.5% drops were instilled before surgery, and the anterior capsule with epithelial cells was incised using 5.5-mm continuous curvilinear capsulorrhexis. The anterior capsule sample was immediately fixed in 0.1 M phosphate buffer containing 4% paraformaldehyde (pH 7.4; paraformaldehyde [PFA]) and stored at 4 C. The PFA-fixed anterior capsule was rinsed with 0.1% polysorbate 20 (Tween 20) and phosphate-buffered saline (PBS; Amresco Inc, Ohio, USA) 3 times for 5 minutes. After 15 minutes, nonspecific background was blocked with a solution composed of PBS, 1.0% serum, and 0.1% Tween 20 and the samples were briefly washed with 1.0% polysorbate 20 and PBS. The capsulotomy samples were incubated with primary antibody at 4 C overnight in order to identify calpain and caspase-12 (Abcam plc, Cambridge, Massachusettes, USA). After being washed twice for 15 minutes with 0.1% Tween, samples were incubated with a 1:100 dilution of the appropriate secondary antibody conjugated with Alexa Fluor 594 and Alexa Fluor 488 (Abcam plc) at room temperature for 3 hours. The tissue was washed with 0.1% Tween and PBS for 15 minutes and was co-stained with blue fluorescent dye (Hoechst 33342; Invitrogen Corp, Waltham, Massachusettes, USA) diluted to 1:800 for 1 hour to visualize the nuclei. The samples were mounted on a glass slide and analyzed with a confocal microscope (LSM 510 Meta; Carl Zeiss Meditec AG, Jena, Germany). Digital images were obtained.
The number of immunopositive cells was counted in 4 representative fields. An eyepiece calibrated grid with ×200 magnification was used. The total number of cells in a 2 × 2 mm 2 area was analyzed and the percentage of positively stained cells was determined. The analysis was performed 3 times and the mean values were applied to a scoring system based on a scale of 0 to 4+ as follows: 4+ = very high (75%–100% positive cells); 3+ = high (50%–75% positive cells); 2+ = moderate (25%–50% positive cells); 1+ = low (<25% positive cells); 0 = negative (no positive cells).
Statistical Analysis
Statistical analysis was performed using SPSS software (version 19.0; SPSS, Inc, Chicago, Illinois, USA). Comparison between groups was performed using 1-way analysis of variance, and the Spearman correlation test was used for comparing independent samples. A P value less than .05 was considered to be statistically significant.
Results
A total of 40 patients (40 eyes) were enrolled in this prospective study. The mean patient age was 67.40 ± 10.59 years (range, 60–97 years). Each group included 10 eyes, and preoperative data are shown in Table 1 . Duration of DM and serum level of HbA1c were significantly different between Groups 2, 3, and 4 ( P < .05, for all).
| Mean ± SD | P Value | ||||
|---|---|---|---|---|---|
| Group 1 | Group 2 | Group 3 | Group 4 | ||
| Age (y) | 67.00 ± 8.71 | 70.00 ± 12.81 | 66.57 ± 9.17 | 64.45 ± 8.78 | .595 |
| Duration of DM (y) | – | 10.42 ± 4.64 | 16.92 ± 6.08 | 17.09 ± 9.48 | .016 |
| HbA1c (%) | – | 6.72 ± 0.83 | 8.56 ± 2.53 | 9.52 ± 1.67 | .013 |
Immunohistochemical Analysis of Calpain and Caspase-12 Expression
Table 2 describes differences in calpain and caspase-12 distribution between 4 groups. Both calpain and caspase-12 expression was increased in all 4 groups. The mean percentage of calpain-immunopositive cells was significantly higher in Groups 2, 3, and 4 compared to Group 1 ( P < .001). There also was a statistically significant increase in calpain expression among Groups 2, 3, and 4 compared to Group 1 (all P < .001). Caspase-12 showed similar results to calpain, being significantly greater in Groups 2, 3, and 4 compared to Group 1 ( P < .001).
| Mean Positive Cells (%) ± SD | P Value | ||||
|---|---|---|---|---|---|
| Group 1 | Group 2 | Group 3 | Group 4 | ||
| Calpain | 10.17 ± 31.88 | 31.58 ± 18.96 | 65.36 ± 12.51 | 72.92 ± 25.90 | <.001 |
| Caspase-12 | 17.50 ± 22.01 | 35.42 ± 22.10 | 56.57 ± 21.20 | 69.23 ± 24.27 | <.001 |
Figures 1–3 present confocal microscopy images of the immunohistochemical expression of lens epithelial cells in each group.
Other Risk Factors of Calpain and Caspase-12
The expression of both calpain and caspase-12 increased in a statistically significant manner with a longer duration of DM ( P = .021, P = .038, respectively; Table 3 ). Likewise, calpain and caspase-12 expression increased significantly according to serum level of HbA1c ( P = .018, P = .042, respectively; Table 4 ).
| Mean Positive Cells (%) ± SD | P Value | |||||
|---|---|---|---|---|---|---|
| No DM | DM <5 Years | DM 6–10 Years | DM 10–15 Years | DM >16 Years | ||
| Calpain | 13.33 ± 33.83 | 22.00 ± 23.86 | 58.76 ± 23.77 | 65.85 ± 27.87 | 70.56 ± 26.97 | .021 |
| Caspase-12 | 11.83 ± 30.28 | 15.86 ± 25.38 | 48.53 ± 25.35 | 60.67 ± 19.67 | 65.77 ± 31.60 | .038 |
Stay updated, free articles. Join our Telegram channel

Full access? Get Clinical Tree


