Purpose
To determine the burden of undetected and untreated glaucoma in the noninstitutionalized population over the age of 40 years in the United States of America (US).
Design
Cross-sectional study.
Methods
setting : US civilian, noninstitutionalized population from the 2005–2006 and 2007–2008 administrations of the National Health and Nutrition Examination Survey that were 40 years old or older with completed retinal photographs, completed interview question regarding prior diagnosis of glaucoma, and a negative response to questions regarding comorbidities. main outcome measures : Prevalence of self-reported glaucoma history; signs of glaucoma damage seen in retinal photographs and perimetry; prevalence of undiagnosed glaucoma; and comparison of demographic factors using odds ratios to identify populations with highest burden of previously undiagnosed glaucoma.
Results
The study population included 3850 participants who met the inclusion criteria. The 99.5th percentile of the vertical cup-to-disc ratio was 0.67 and the 99.5th percentile of the vertical cup-to-disc ratio asymmetry between eyes was 0.26. Prevalence of undiagnosed glaucoma was 2.9%, increasing with age to 6.6% of the population over 70 years old. Among those with glaucoma, 78% were previously undiagnosed and untreated. Blacks have roughly 4.4 times (95% confidence interval [CI]: 2.9–6.7; P < .0001) and Hispanics have roughly 2.5 times (95%CI: 1.5–4.3; P = .0012) greater odds of having undiagnosed and untreated glaucoma than non-Hispanic whites.
Conclusions
Approximately 2.4 million persons in the US have undetected and untreated glaucoma. Overall, prevalence of both diagnosed and undiagnosed glaucoma is much higher in minorities and the elderly. Among those with definite glaucoma, individuals younger than 60 years of age have a greater proportion of undetected disease.
Glaucoma is the second leading cause of blindness in the United States of America (US), affecting over 2 million people. Glaucoma prevalence has been evaluated by a number of well-designed investigations. However, the prevalence of undiagnosed glaucoma is unclear.
Though few studies have looked specifically at the burden of undiagnosed and untreated glaucoma, rates can be derived from studies that have gathered self-report and examination data in specific populations. The Proyecto Vision Evaluation and Research (VER) study population among Hispanics on the border of Mexico and Arizona showed a 75% prevalence of undiagnosed disease ; among the Latino population of Los Angeles, California, the prevalence of undiagnosed glaucoma was 75% ; the Baltimore Eye survey found a prevalence of 50% ; the Melbourne Visual Impairment Project, 50% ; the Blue Mountains Eye Study, 51% ; the Roscommon study in Ireland, 49% ; the Barbados Eye Study, 51% ; the Thessaloniki Eye Study, 50% ; and the Egna-Neumarkt Study, 87%.
The objective of the current study is to estimate the prevalence of undiagnosed and untreated glaucoma using the National Health and Nutrition Examination Survey (NHANES) population, a nationally representative sample of the noninstitutionalized population in the US. We hypothesize that there is a large burden of undiagnosed and untreated glaucoma in the US.
Methods
The National Health and Nutrition Examination Survey conducted by the National Center for Health Statistics (NCHS) is a continuous survey of the US population using a complex, multistage probability sampling methodology designed to assess the health and nutritional status of the civilian, noninstitutionalized US population. It is a cross-sectional study of a sample of about 10 000 persons per 2-year cycle and utilizes interviews, physical examinations, and laboratory tests. In the 2005–2006 and 2007–2008 iterations a question regarding previous diagnosis of glaucoma was included, in addition to perimetric testing (N30-5 FDT, Carl Zeiss Meditec, Inc, Dublin, California, USA), retinal photographs, and optic nerve head assessment. Data accumulation was performed by the NCHS with approval from the NCHS Research Ethics Review Board. Data from NHANES are publicly available anonymous data, so this study has received Institutional Review Board exemption from the University of California, Los Angeles.
Interview
Participants 40 years and older were asked about history of glaucoma before the physical examination; the question was phrased: “Have you ever been told by an eye doctor that you have glaucoma, sometimes called high pressure in your eyes?” Patients were coded for having the following responses: “Yes,” “No,” “Don’t know,” and “Refused (to respond).”
A history of glaucoma medication use was ascertained through the Prescription Medication subsection of the personal interview. During the household interview survey participants were asked if they had taken a medication in the past month prior to the survey date for which they needed a prescription. Those who answered “yes” were asked to show the interviewer the medication containers of all the products used. For each medication reported, the interviewer entered the product’s complete name from the container into a computer. If no container was available, the interviewer asked the participant to verbally report the name of the medication.
Clinical Examination
The sample eligible for participation in the visual field test and retinal imaging consisted of all persons aged 40 years and older who were not blind, did not have an eye infection, and did not have eye patches on both eyes. The visual field was assessed using the Humphrey Matrix Visual Field Frequency Doubling Technology instrument (manufactured by Carl Zeiss Meditec, Inc, Dublin, California, USA) with the N-30-5 screening protocol, a 19-point supra-threshold screening test. Test results for visual field locations were classified into probability levels based on age-corrected normative values. Targets were presented at a contrast level that 95% of healthy age-matched subjects would be expected to detect. If the target was seen, the visual field location was not retested and was identified as normal at P ≥ 5%. If unseen, the field was retested at the same contrast and location; if the light target was still unseen, the target was then presented at a contrast level that 98% of healthy subjects would be expected to see. If seen, the location was labeled as P < 5%; if unseen, the location was retested at a still higher contrast level for which 99% of healthy subjects are expected to see the target. If seen, the location was labeled P < 2%, but if unseen, it was considered a missed location and labeled P < 1%. Two visual field tests per eye were administered to each subject, and an eye was considered to have abnormal visual field if at least 2 locations in both the first and second tests were below the 1% threshold level, and at least 1 failed location was the same on both tests (2-2-1 algorithm). During each test, reliability checks were performed at random times, which included 3 false-positive tests to check if the participant was responding to seen targets and 3 blind spot tests to test for fixation errors. Test administrators also monitored and recorded if the participant’s eye wandered and if he or she was unable to maintain fixation throughout the testing period. The final eye status was coded as “insufficient” if 1 test was not done or incomplete. The final eye status was designated “unreliable” if: either of the 2 tests had 2 or more false-positive errors out of 3 false-positive tests; or there were 2 or more blind spot errors out of 3 blind spot tests; or a technician noted lack of fixation. These measures of unreliability were encoded to yield a reliability variable for each eye. An eye was excluded from analysis if the visual field was not done or was insufficient or unreliable or missing.
After the visual field test, subjects underwent retinal imaging examination. Two 45-degree nonmydriatic digital images of the retina were captured using the Canon Non-Mydriatic Retinal Camera CR6-45NM (Canon, Tokyo, Japan). Two digital images were taken, with the first centered on the macula and the second on the optic nerve. The digital images were sent to the Reading Center at the University of Wisconsin, Madison, for grading, according to the grading protocol used in NHANES III. The grading team included 9 experienced graders (a preliminary grading coordinator, 2 preliminary graders, and 6 detail graders). A final report of findings was sent to participants 12–16 weeks after the examination. Abnormal findings were reported to participants as early as possible.
Glaucoma Classification
Diagnosis of glaucoma was defined based on criteria detailed by Foster and associates that are consistent with the Rotterdam Eye Study criteria. The characterization of glaucoma is based on both structural damage and functional deficits. The vertical cup-to-disc ratio was used to identify glaucomatous loss of the neuroretinal rim. To be classified as an “abnormal” cup-to-disc ratio and/or cup-to-disc ratio asymmetry, the 97.5th and the 99.5th percentile values from subjects with normal visual fields were calculated along with the respective 95% confidence intervals (CI). A cup-to-disc ratio value or cup-to-disc ratio asymmetry value outside the 95% CI of the 97.5th percentile was considered to be possible glaucomatous optic neuropathy, while values outside the 95% CI of the 99.5th percentile were considered to be probable glaucomatous optic neuropathy. Visual field data were used to identify a glaucomatous visual field defect (GVFD), which was defined as an abnormal visual field based on the 2-2-1 algorithm as described above. The GVFD status (defect, no defect, no visual field test) was matched with glaucomatous optic neuropathy (GON) status (probable GON, possible GON, no GON) to reach a classification of definite, probable, possible, or no glaucoma based on the Rotterdam Eye Study criteria. Persons were excluded from the analysis if they had pathologies that had the potential to provide alternative explanation for any optic neuropathy. Exclusion criteria included anisometropia (right cylindrical diopter–left cylindrical diopter ≥2; right spherical diopter–left spherical diopter ≥2); retinal vascular disease (retinal artery occlusion, retinal branch vein occlusion, retinal central vein occlusion, retinal arteriovenous nicking, focal arteriolar narrowing, Hollenhorst plaque); macular degeneration; and cerebrovascular disease.
Undiagnosed and untreated glaucoma was defined as empirical evidence of “definite” glaucoma by the Rotterdam criteria, without self-report of glaucoma and evidence of glaucoma medication usage.
Statistical Analysis
Population quantities were estimated after applying the NHANES sampling weights. Because 4-year data were used, the weights from the 2005–2006 and 2007–2008 iterations were accordingly halved in order to maintain weighting consistent with the national population size determined from US Census data. Variables representing the multiple sampling levels related to each person were also included in statistical procedures to account for the complex, multistage probability sampling design used to select participants in the NHANES. Variables representing sample weights, clustering, and strata were made available by the NCHS in documentation and demographic files.
The study population included participants who had complete data for glaucoma medication usage, self-reported glaucoma status, and clinical glaucoma status and who did not meet the exclusionary criteria. The χ 2 test was used to compare the overall difference among all categories of each categorical demographic variable between participants included in the study population (with complete data) and excluded participants without complete data. Odds ratios (OR) were used to describe the degree to which undiagnosed and untreated glaucoma prevalence differ among strata of each demographic variable, with the reference level being the category presumed to lend the least risk for the disease. All OR and the corresponding 95% CI were calculated using age-corrected logistic regression models, except for the estimates for age, which were calculated using unadjusted logistic regression analysis. Age was stratified into a categorical variable (40–49 years old; 50–59 years old; 60–69 years old; 70 years old and older) for the purpose of inter-variable comparison between younger and older populations. However, the continuous age was used for age-corrected logistic regression models. All analysis was conducted using SAS software version 9.2 (SAS Inc, Cary, North Carolina, USA).
Results
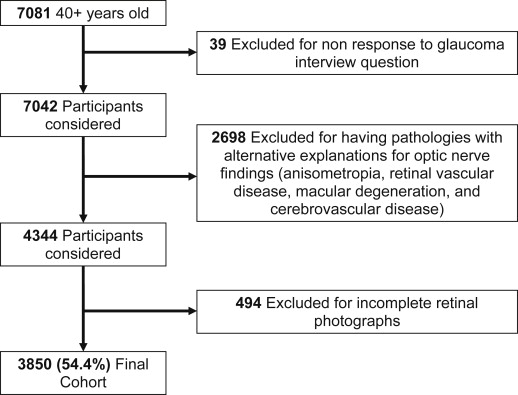
Out of the 7081 interviewed individuals over 40 years of age, 7042 responded to the glaucoma interview question, of whom 6760 also had a mobile examination center examination completed. Of these, the 3850 who had complete data for glaucoma medicine usage, self-reported glaucoma status, and clinical glaucoma status and who did not meet the exclusionary criteria constituted the study population ( Figure ). In comparison to persons with complete data who were included in the study population, persons with incomplete information (ie, not having either self-report or clinical examination) tended to primarily lack the clinical examination (98.7%), and tended to be older (21% vs 3% above 80 years old). A significantly greater proportion of those below the poverty level compared to those above the poverty level and those with public insurance compared to private insurance also had incomplete information ( Table 1 ). However, in these groups the proportion of participants with self-reported glaucoma is similar between those with and without complete data. For those in the 80 years old and older group, there was no statistically significant difference in the prevalence of self-reported glaucoma between those with and without complete data (13.9% and 14.8%, respectively, P = .9). Those with incomplete data and public insurance were more likely to have self-reported glaucoma (10.4% vs 5.1%) with an age-corrected OR of 1.7 (95% CI: 1.0, 3.0; P = .05). Those with incomplete data and below the poverty line had a higher prevalence of self-reported glaucoma (7.8%) than those who had complete data and were below the poverty line (4.2%), with an age-corrected OR of 1.0 (95% CI: 0.5, 2.0; P = .9).
| Characteristics | Participants With Complete Data N | % | Participants With Incomplete Data N | % | P Value a |
|---|---|---|---|---|---|
| Total (n) | 3850 | 3231 | |||
| Age | |||||
| 40–49 | 1276 | 33.1 | 517 | 16.0 | <.0001 |
| 50–59 | 1053 | 27.4 | 511 | 15.8 | |
| 60–69 | 909 | 23.6 | 778 | 24.1 | |
| 70–79 | 484 | 12.6 | 720 | 22.3 | |
| 80+ | 128 | 3.3 | 705 | 21.8 | |
| Mean ± SD | 56.4 ± 0.3 | 65.6 ± 0.5 | <.0001 | ||
| Sex | |||||
| Female | 1937 | 50.3 | 1638 | 50.7 | .1334 |
| Male | 1913 | 49.7 | 1593 | 49.3 | |
| Ethnicity | |||||
| Hispanic | 925 | 24.0 | 696 | 21.5 | .0025 |
| Non-Hispanic white | 1948 | 50.6 | 1740 | 53.8 | |
| Non-Hispanic black | 828 | 21.5 | 686 | 21.2 | |
| Other | 149 | 3.9 | 109 | 3.4 | |
| Education | |||||
| Less than high school | 1052 | 27.3 | 1205 | 37.4 | <.0001 |
| High school diploma (GED) b | 948 | 24.6 | 766 | 23.8 | |
| More than high school | 1849 | 48.0 | 1248 | 38.8 | |
| Family income-to-poverty ratio | |||||
| At or above poverty level (list level) | 3071 | 85.1 | 2353 | 81.1 | .0007 |
| Below poverty level | 539 | 14.9 | 547 | 18.9 | |
| Health insurance status | |||||
| None | 728 | 18.9 | 387 | 12.0 | <.0001 |
| Public | 821 | 21.3 | 1146 | 35.6 | |
| Private | 2301 | 59.8 | 1687 | 52.4 | |
a χ 2 test to compare the overall difference among all categories between participants with and without complete data.
b General Educational Development, or Certificate of High School Equivalency.
Reasons for no or incomplete eye examinations primarily included timing (came late/left early/no time), refusal, eye-specific limitations (empty orbital cavity or glass eye, small pupil size, cataract, unable to control blinking or keep eyes open or fixate adequately, or interference with drooping eyelids), physical limitations, illness, communication problems, equipment failures, or technician errors.
The prevalence of self-reported glaucoma in the US population over 40 years of age is 5.1%. The cup-to-disc ratio values and cup-to-disc ratio asymmetry values from this study corresponding to the 97.5th and 99.5th percentiles of the US population ( Table 2 ) differ slightly from those previously calculated by Swanson because calculations in our study used only subjects with a normal visual field to determine these values. Of the sampled individuals who completed a retinal examination and visual field test, 210 had a glaucomatous optic neuropathy and a visual field defect classifying them as having “definite” glaucoma by the Rotterdam Eye study criteria, leading to a prevalence of 3.7% for definite glaucoma. Based on the Rotterdam criteria 1295 participants were categorized as having probable glaucoma (1219 of whom had a visual field defect), 191 as having possible glaucoma (8 of whom had a visual field defect), and 2154 as having no glaucoma. In total, 1437 participants had a visual field defect, 1812 had no defect, and 601 had an incomplete visual field examination. The prevalence of undiagnosed and untreated glaucoma was 2.9%, approximately 2.4 million people in the US population and implying a rate of 78% (2.9%/3.7%) among individuals with definite glaucoma whose disease remained undiagnosed and untreated. Compared with persons with diagnosed glaucoma, those with previously undiagnosed and untreated glaucoma tended to be younger ( Table 3 ).
| Optic Disc Parameters | Percentile (95% CI) a | Classification | |
|---|---|---|---|
| Vertical cup-to-disc ratio | ≥97.5th | 0.61 (0.60,0.62) | Possible GON |
| ≥99.5th | 0.67 (0.65,0.69) | Probable GON | |
| Asymmetry in Vertical cup-to-disc ratio between both eyes | ≥97.5th | 0.19 (0.18,0.20) | Possible GON |
| ≥99.5th | 0.26 (0.22,0.29) | Probable GON | |
a Percentile and 95% confidence interval were estimated after applying weights for nationally representative sample.
| Characteristics | Diagnosed Glaucoma (n = 47) | Undiagnosed and Untreated Glaucoma (n = 163) | P Value a | ||
|---|---|---|---|---|---|
| n | % | n | % | ||
| Age | |||||
| 40–49 | 3 | 5.3 | 26 | 16.9 | .0009 |
| 50–59 | 6 | 10.1 | 41 | 38.6 | |
| 60–69 | 13 | 40.4 | 48 | 20.5 | |
| 70+ | 25 | 44.3 | 48 | 24.1 | |
| Sex | |||||
| Male | 27 | 51.1 | 92 | 53.8 | .9822 |
| Female | 20 | 48.9 | 71 | 46.2 | |
| Ethnicity | |||||
| Non-Hispanic white | 21 | 65.2 | 49 | 49.9 | .7187 |
| Hispanic | 8 | 7.4 | 41 | 11.7 | |
| Non-Hispanic black | 15 | 20.1 | 61 | 23.8 | |
| Other | 3 | 7.2 | 12 | 14.6 | |
| Education | |||||
| More than high school | 21 | 56.5 | 70 | 49.7 | .3865 |
| High school diploma (GED) b | 12 | 23.0 | 41 | 33.9 | |
| Less than high school | 14 | 20.6 | 52 | 16.3 | |
| Income | |||||
| At or above poverty level | 34 | 94.3 | 128 | 89.7 | .3470 |
| Below poverty level | 4 | 5.7 | 25 | 10.3 | |
| Health insurance status | |||||
| Private | 34 | 77.4 | 81 | 61.9 | .3462 |
| Public | 9 | 17.5 | 55 | 26.0 | |
| None | 4 | 5.1 | 27 | 12.1 | |
a All comparisons were based on age-corrected logistic regression analysis, except for the comparison for age, which was based on unadjusted logistic regression analysis.
b General Educational Development, or Certificate of High School Equivalency.
In comparison to non-Hispanic whites, Hispanics and blacks have significantly higher age-adjusted odds of having undiagnosed and untreated glaucoma (2.5 [95% CI: 1.5, 4.3] and 4.4 [95% CI: 2.9, 6.7], respectively) ( Table 4 ). Among those with definite, possible, and probable glaucoma, 85% of blacks and 81% of Hispanics were undiagnosed and untreated compared with 73% of non-Hispanic whites.


