Purpose
To determine if asymmetry in thickness of the retinal nerve fiber layer (RNFL), ganglion cell layer, ganglion cell complex, and total retina between upper and lower macula halves can predict glaucoma.
Design
Retrospective case-control series.
Methods
One hundred twenty-two eyes of 122 patients (30 normal eyes and 30 preperimetric, 31 early, and 31 advanced glaucoma eyes) were studied. The RNFL, ganglion cell layer, ganglion cell complex, and total retina were segmented and measured on 10 vertical B-scans over a 30 × 15 degree macular area. The equation asymmetry index =|log 10 (lower hemiretinal thickness/upper hemiretinal thickness)| was used to calculate asymmetry indices for 8 pairs of upper and lower 0.5-mm segments equidistant from the fovea on each scan. Areas under the receiver operating characteristic curve (AROCs) for mean thickness and mean asymmetry index of 10 B-scans were compared.
Results
The overlap in values for normal and glaucomatous eyes was minimal for the ganglion cell layer asymmetry index. Thickness parameters decreased with the severity of glaucoma, whereas asymmetry indices did not. AROCs for thickness measurements tended to increase with increasing glaucoma severity (preperimetric, 0.746–0.808; early, 0.842–0.940; advanced, 0.943–0.995), whereas AROCs for asymmetry indices did not have distinct ranges according to glaucoma severity (advanced, 0.819–0.996; early, 0.861–0.998; preperimetric, 0.773–0.994). The AROC for the ganglion cell layer asymmetry index remained almost perfect regardless of glaucoma severity (0.994–0.998).
Conclusions
Macular retinal layer thickness asymmetry indices, particularly for the ganglion cell layer, show promise as early indicators of glaucomatous retinal damage.
Glaucoma is characterized by progressive loss of retinal ganglion cells (RGCs) attributable to damage to ganglion cell axons within the optic disc. This RGC loss leads to thinning of the neuroretinal rim with enlargement of the cup of the optic disc and to thinning of RGC-related retinal layers, such as the retinal nerve fiber layer (RNFL) and ganglion cell layer. These changes lead to visual field (VF) defects, but the structural damage can be detected several years before VF defects appear. For this reason, changes in retinal layer thickness show promise as a biomarker of early glaucomatous damage.
Spectral-domain optical coherence tomography (SD OCT) yields high-axial-resolution images of the retina, thereby allowing reproducible measurement of the thicknesses of RGC layers. Studies using this technology found that thicknesses of single or combined inner retinal layers, such as the RNFL, ganglion cell layer + inner plexiform layer (termed GCIPL [Carl Zeiss Meditec, Dublin, California, USA] or GCL+ [Topcon, Tokyo, Japan]), and RNFL + ganglion cell layer + inner plexiform layer (termed ganglion cell complex [GCC]), in the macula were more accurate than total macular thickness and were comparable to circumpapillary (cp) RNFL thickness in discriminating between glaucomatous and nonglaucomatous eyes. However, these thickness parameters do not satisfactorily discriminate between normal and preperimetric glaucoma eyes: areas under the receiver operating characteristic curve for average, superior, and inferior macular retinal layer thicknesses were reported as 0.78, 0.68–0.78, 0.71–0.77, 0.746–0.860, 0.745–0.815, 0.891, and 0.76–0.79, and at ≥95% specificity, sensitivities were reported as 43.8–59.5% and 31.3–43.8.
One possible reason for this limitation of retinal thickness parameters in detecting glaucoma before VF defects appear is that there is a wide overlap in the thickness distribution of these structure parameters between normal and early-diseased eyes. It is difficult to statistically distinguish 2 groups with a wide overlap. For a change in a structure to be a reliable indicator of early glaucoma, the range of abnormal values for the structure must have minimal overlap with the range for this structure in normal eyes.
The distribution of RGC axons and soma is highly symmetrical between the superior and inferior halves of the retina in normal eyes. Standard automated perimetry (SAP) shows that visual sensitivity also has hemifield symmetry in normal eyes, and hemifield asymmetry detected using the SAP 30-2/24-2 Swedish Interactive Threshold Algorithm (Humphrey Field Analyzer; Carl Zeiss Meditec) has been established as a sensitive and specific indicator of early glaucomatous VF defects. With regard to structure, it was reported that the difference between retinal hemispheres in total retinal thickness in the macula (Posterior Pole Asymmetry Analysis; Heidelberg Engineering, Dossenheim, Germany) is an indicator of early glaucomatous damage.
Recent studies showed that the thickness profiles of the RNFL, ganglion cell layer, ganglion cell layer + inner plexiform layer, and ganglion cell complex in the macula as measured with SD OCT are highly symmetrical in upper and lower retinal hemispheres in normal eyes. We speculated that hemiretinal asymmetry in thicknesses of the RNFL, ganglion cell layer, and ganglion cell complex might have less overlap than conventional thickness parameters between normal and early-diseased eyes, and could improve the performance in distinguishing between these eyes. This study investigated the potential usefulness of this new approach in early glaucoma diagnosis.
Methods
This retrospective cross-sectional case-control study adhered to the tenets of the Declaration of Helsinki and was approved in a retrospective manner by the Institutional Review Board and Ethics Committee of Kyoto University Graduate School of Medicine. Informed consent for all examinations was obtained from all participants.
Participants
Study candidates comprised patients who were screened for glaucoma at the Kyoto University Hospital from March 7, 2011, through November 19, 2012, and who had undergone a comprehensive ophthalmic examination, including measurement of best-corrected visual acuity (BCVA, 5 m Landolt chart), refraction, keratometry, slit-lamp examination, axial length measurement (IOL Master 500; Carl Zeiss Meditec), Goldmann applanation tonometry, gonioscopy, indirect ophthalmoscopy, dilated slit-lamp optic nerve head examination, fundus photography, stereo disc photography (3-Dx simultaneous stereo disc camera; Nidek, Gamagori, Japan), and red-free fundus photography (Heidelberg Retina Angiography 2 [HRA2]; Heidelberg Engineering, Heidelberg, Germany). The VF was determined with standard automated perimetry (SAP) (Humphrey Visual Field Analyzer, Carl Zeiss Meditec with the 24-2 Swedish Interactive Threshold Algorithm [SITA] standard program), and SD OCT examinations were performed with the Spectralis HRA+OCT system (Heidelberg Engineering, Heidelberg, Germany).
We only included eyes with a BCVA of >20/30, a spherical equivalent refractive error between −6 and +3 diopters, a normal anterior chamber on slit-lamp examinations, a normal open angle on gonioscopy, and reliable SAP test results. We excluded those with opaque media, diabetic retinopathy or another ophthalmic disease that could cause VF defects or fundus abnormalities, or a history of eye trauma or intraocular surgery, as well as patients with a history of systemic or neurologic disease that could affect the visual field. When both of a patient’s eyes were eligible, 1 eye was randomly chosen for the study.
We compared normal eyes and 3 groups of glaucomatous eyes: those with preperimetric glaucoma, those with perimetric glaucoma with mean deviation (MD) better than −6 dB (termed early glaucoma), and those with perimetric glaucoma with MD worse than −6 dB (termed advanced glaucoma), as defined by the Hodapp–Parrish–Anderson grading scale of severity of VF defects.
Normal eyes had an intraocular pressure (IOP) of ≤21 mm Hg, a normal-appearing optic disc, and normal VF test results. Eyes with preperimetric glaucoma showed evident glaucomatous appearance of the optic disc and normal VF results. Eyes with early glaucoma or advanced glaucoma showed glaucomatous appearance of the optic disc and/or RNFL defects that corresponded with typical reproducible VF defects on SAP as confirmed on 2 reliable consecutive tests. Anderson and Patella’s criteria were used to define glaucomatous VF results on SAP: glaucoma hemifield test outside normal limits; a pattern standard deviation (PSD) probability of <5%; or a cluster of 3 or more adjacent non-edge points in typical glaucomatous locations that did not cross the horizontal meridian, all of which were depressed on the pattern deviation (PD) plot at P < 5%, and 1 of which was depressed at P < 1%, on at least 2 consecutive examinations. VF results were considered reliable on the basis of a fixation loss of ≤15%, a false-positive rate of ≤15%, and a false-negative rate of ≤15%.
Three glaucoma specialists (M.H., H.O.I., and T.A.) evaluated optic disc appearance on stereo disc photographs and RNFL defects on red-free fundus photographs. Evaluators were masked to all other patient and ocular data, and an eye was excluded from analyses if a consensus could not be reached. A glaucomatous appearance of the optic disc was defined as the presence of localized or diffuse neuroretinal rim thinning. A localized RNFL defect, when identified on red-free photographs, was classified as glaucomatous when its width at a 1-disc-diameter distance from the edge of the disc was larger than that of a major retinal vessel, it diverged from the edge of the optic disc in an arcuate or wedge shape, and it could not be explained by any cause other than glaucoma.
Spectral-Domain Optical Coherence Tomography
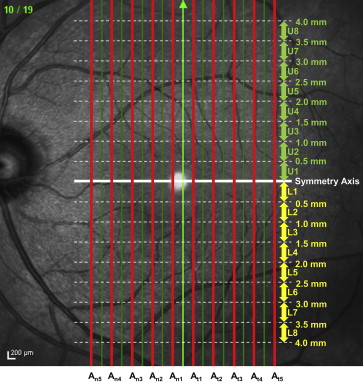
The Spectralis HRA+OCT system employs confocal laser scanning ophthalmoscopy (SLO). This system enables real-time 3-dimensional tracking of eye movements and accurate averaging of up to 100 B-scans (7 μm axial resolution) acquired at an identical location of interest on the retina, which efficiently reduces speckle noise. Our macular scan protocol consisted of 19 vertical scan lines over a 30 × 15 degree area of the macula centered at the fovea. The B-scan image on each scan line was obtained by averaging 50 scans ( Figure 1 ).
Delineation of Retinal Layer Boundaries and Thickness Measurements
On each averaged B-scan SD OCT image, the Spectralis software automatically determined the vitreoretinal interface and the posterior border of the retinal pigment epithelium. To measure retinal layer thicknesses (RNFL, ganglion cell layer, ganglion cell complex, and total retina), the boundary lines between the RNFL and ganglion cell layer and between the ganglion cell layer and inner plexiform layer delineated by prototype function of the Spectralis software were manually revised using a reliable method described previously. Briefly, boundary lines between layers were manually revised by the first delineator (H.Y.) and then by the second delineator (N.N.), who was masked to the results of the first delineator. Then a reviewer who was masked to clinical information about the eyes reviewed the results in a group with the first and second delineators. If both delineators’ results were judged to be accurate by the entire group, the results of the first delineator were used for analysis. If the results of the first delineator were judged to be inaccurate by group review, the results of the second delineator were used for analysis. If both delineators’ results were judged to be inaccurate by group review, the results as corrected by the group review were used for analysis. After the borders to be used had been agreed upon, the software automatically calculated the distance in pixels between the inner and outer boundary lines of each layer and converted the results to micrometers.
Asymmetry Index Calculations
We calculated asymmetry indices by using averages for 10 scan lines (alternate lines starting with the first of the 19 scan lines, Figure 1 ). The horizontal line (perpendicular to the direction of scanning) that passed through the fovea was used as the axis of symmetry (white line in Figure 1 ). To compare upper (U) and lower (L) hemiretinal thickness values, we first calculated “A,” the asymmetry in thickness of each of 8 pairs of 0.5 mm segments (x) in the upper (U) and lower (L) retinal hemispheres ( Figure 1 ), by using the following equation, where U x and L x are the thicknesses of each parameter (RNFL, ganglion cell layer, ganglion cell complex, and total retina) within the x -th segment from the symmetry axis in the upper (U) and lower (L) hemispheres in a single scan:
A (asymmetry for selected scan of selected retinal layer for segment x) = | log 10 (U x /L x ) |
Then we calculated the asymmetry index (AI) for the 8 segments on each of the nasal (A n1∼5 ) and temporal (A t1∼5 ) macular scans as follows ( Figure 1 ):
AI for each scan ( n 1 ∼ 5 / t 1 ∼ 5 ) = |log 10 ( U 1 /L 1 ) | + | log 10 ( U 2 /L 2 ) | + • • • + | log 10 ( U 8 /L 8 ) | 8
Finally, we calculated the asymmetry index (AI) for each eye by using the following equation:
AI for each eye = A n 1 + A n 2 + A n 3 + A n 4 + A n 5 + A t 1 + A t 2 + A t 3 + A t 4 + A t 5 10
Stay updated, free articles. Join our Telegram channel

Full access? Get Clinical Tree


