Purpose
To investigate relationships between contrast sensitivity (CS), color vision, and retinal nerve fiber layer (RNFL) among people with human immunodeficiency virus (HIV) infection; to evaluate the effect of time since diagnosis of HIV infection on RNFL thickness.
Design
Noninterventional cross-sectional study.
Methods
We evaluated 102 eyes of 57 HIV-infected individuals without ocular opportunistic infections. Peripapillary RNFL thickness was determined with spectral-domain optical coherence tomography in 4 quadrants. CS was measured with the Pelli-Robson technique (expressed as logCS); color vision was measured with the Lanthony desaturated 15-hue technique (expressed as color confusion index [C-index], with higher scores indicating worse color vision). Correlations between values were assessed using Spearman correlation coefficients.
Results
Median RNFL thickness (average of 4 quadrants) was 102.9 μm (range, 75.0–134.7 μm). Median logCS was 1.90 (range, 1.25–1.95). Median C-index was 1.58 (range, 0.96–4.07). Temporal RNFL thickness was correlated with logCS (r = 0.295, P = .003) and C-index (r = −0.338, P = .0005). Time since diagnosis of HIV infection was shorter for those with thick average RNFL than for those with thin average RNFL ( P = .18).
Conclusions
Both worse CS and worse color vision are correlated with thinning of the temporal RNFL, with possible threshold effects. Increased prevalences of abnormal CS and abnormal color vision in this population are therefore likely attributable to neuroretinal compromise. This pattern of structural and functional losses may reflect preferential damage to small-caliber axons in the maculopapillary bundle, possibly associated with mitochondrial dysfunction, providing a potential disease mechanism for HIV-associated “neuroretinal disorder.”
Subtle vision abnormalities (reduced contrast sensitivity [CS], altered color vision, visual field loss ), in the absence of ocular opportunistic infections, are more common in people with human immunodeficiency virus (HIV) disease than in the general population, even among those whose immune function has improved because of antiretroviral therapy. Changes in vision are thought to be caused by HIV-associated “neuroretinal disorder,” which is characterized by changes in the retinal nerve fiber layer (RNFL). Autopsy studies have revealed a 40% reduction of axons in the optic nerves of people with AIDS, with severe degeneration of the axons that remain, when compared to normal controls. Previous studies have suggested that host genetic factors and certain mitochondrial haplogroups may be associated with an increased risk of developing neuroretinal disorder. Proposed mechanisms for neuroretinal disorder include direct damage of neural tissue by HIV, collateral damage from the body’s immunologic response to HIV infection, and cumulative damage to the retina and optic nerve from a long-standing microvasculopathy and associated hemorheologic abnormalities.
Visual field loss has been associated with RNFL thinning in HIV-infected individuals, as measured by optical coherence tomography (OCT), but similar direct relationships have not yet been shown for other measures of visual function. In this study, we compared RNFL thickness to CS and color vision among HIV-infected individuals without clinically apparent retinal infections. We hypothesize that the increased prevalences of psychophysical losses seen in this population are attributable to a retinopathy that manifests as changes in the RNFL of susceptible individuals.
Methods
We recruited volunteer study participants from the Los Angeles County – University of Southern California (USC) Medical Center and from among individuals enrolled in the Longitudinal Study of the Ocular Complications of AIDS (LSOCA) at the Jules Stein Eye Institute, University of California, Los Angeles (UCLA). Inclusion criteria were the following: HIV infection; at least 1 eye with best-corrected visual acuity (BCVA) of 20/25 or better; clear media; and no retinal, choroidal, or optic nerve lesions that could affect visual function, such as cytomegalovirus retinitis, other ocular opportunistic infections, neoplasia, glaucoma, or other maculopathies. All participants were evaluated during the period October 2009 through April 2011. Data relevant to the study for those participants enrolled in LSOCA were extracted from the LSOCA database. Data were collected from participants not involved in LSOCA by identical techniques.
The following demographic and medical data were collected from all subjects: age; sex; race/ethnicity; HIV risk factor (men who have sex with men [MSM], intravenous drug use [IDU], other); weight; interval since HIV diagnosis; interval since AIDS diagnosis; CD4+ T-lymphocyte count (nadir and most recent); CD8+ T-lymphocyte count (nadir and most recent); HIV RNA blood levels (maximum ever and most recent); and antiretroviral drug use. Participants were asked during the study visit to self-report presence or absence of the following comorbidities: hypertension; diabetes mellitus; cardiovascular disease (myocardial infarction, peripheral vascular disease, coronary artery disease); stroke; renal disease; and smoking history (current smoker, past smoker, never smoked). These comorbidities were confirmed by review of medical records and laboratory reports, when available.
The following ophthalmic data were collected for each eye of all study participants: BCVA, CS, color vision measurement, and intraocular pressure. All examinations for an individual study participant were performed on the same day. Data from both eyes of each participant were used for the analyses, unless there were ocular abnormalities that could affect visual function in 1 eye.
BCVA was measured by the Snellen method. CS was determined using the Pelli-Robson chart and technique. The log of the CS measurement (logCS) was calculated and used in analyses. It has been determined that different Pelli-Robson charts can result in different CS measurements (M.L. Van Natta, SOCA Coordinating Center, Johns Hopkins Bloomberg School of Public Health, personal communication, October 2009). To standardize CS scores between the 2 study sites, which used 2 different Pelli-Robson charts, a statistical correction factor was determined by external justification. Based on the results of 13 individuals who were tested with both charts, a correction factor of 3 (mean difference between charts for the external group) was added to the CS score for each study participant who was examined at USC. Individuals in the external group consistently saw more letters on the UCLA chart than on the USC chart, under identical lighting conditions. A logCS value of 1.5 or below was considered abnormal; the rationale for using this method and threshold is described in a previous publication.
Color vision was determined using the Lanthony desaturated 15-hue color vision test. This test is more sensitive to subtle color discrimination deficiencies and is easier to administer and score than the Farnsworth-Munsell 100-hue test (FM-100). Feitosa-Santana and associates confirmed the validity of the technique as a reliable measure of subtle color vision losses, when compared to the Cambridge Colour Test, in a study of participants with type 2 diabetes mellitus who did not have clinically apparent retinopathy. Testing was performed in ambient light with test materials viewed under standard illuminant conditions. Participants used near vision correction, if needed, and were allowed 5 minutes to complete the test. Color confusion index (C-index), as described by Vingrys and King-Smith, was determined for each eye by inputting participant responses into a web-based application available at http://www.univie.ac.at/Vergl-Physiologie/colortest/colortestF-en.html . Higher values indicate worse color vision. The minimum possible score for C-index is 0.96. A C-index value of 1.78 or higher was considered abnormal, as described by Vingrys and King-Smith.
RNFL thickness was obtained using the RTVue spectral-domain optical coherence tomographer (Optovue Inc, Fremont, California, USA). RTVue uses a scanning laser diode with a wavelength of 840 ± 10 nm to provide images of ocular microstructures. A peripapillary RNFL protocol was used to determine RNFL thickness in this study; this technique and normal values for average and quadrant-specific RNFL thickness (superior, temporal, inferior, nasal) are described in detail by Rao and associates.
We compared logCS and C-index with average and quadrant-specific RNFL thickness for each eligible eye of each study participant. To evaluate for cumulative effects of chronic HIV infection on the RNFL, we compared time since diagnosis of HIV infection to average and temporal RNFL thickness. We separated study participants into 2 groups: those diagnosed with HIV infection less than vs greater than 180 months previously (the midpoint for the longest duration of any study participant). Both subgroups were evaluated for correlations between time since diagnosis of HIV infection and RNFL thickness. We also sought a relationship between temporal RNFL thickness and use of the following nucleoside reverse transcriptase antiviral drugs, which are known to have mitochondrial toxicity: zidovudine, stavudine, didanosine, zalcitabine.
Statistical Analysis
Statistical analyses were performed using software SAS version 9.2 (SAS Institute, Cary, North Carolina, USA). Spearman correlation coefficients were used to assess relationships between time since diagnosis of HIV infection, logCS, C-index, and RNFL thickness. The following assessments were repeated in multivariate analyses: 1) comparisons of logCS and of C-index between those with thin vs those with normal temporal RNFL thickness; and 2) correlations of logCS and of C-index with temporal RNFL thickness. Adjustment was performed using repeated-measures linear regression models with a compound symmetry covariance structure to account for correlations between the 2 eyes of same participants and with the inclusion of the following covariates to account for potential confounding effects: study sites; age; race/ethnicity (white vs nonwhite); duration of HIV infection; nadir CD4+ T-lymphocyte count; hypertension; and history of smoking (ever smoked vs never smoked). A P value less than .05 was considered to be statistically significant.
Results
We enrolled 57 study participants; 102 eyes met inclusion criteria. Eyes were excluded because of visually significant cataract (4 eyes), primary open-angle glaucoma (2 eyes), macular hole (2 eyes), amblyopia (1 eye), epiretinal membrane (1 eye), traumatic optic neuropathy (1 eye), and unexplained vision loss worse than 20/25 (1 eye).
Table 1 shows demographic, medical, and laboratory characteristics of all study participants. Median intraocular pressure was 14 mm Hg (range, 9–21 mm Hg; mean ± standard deviation [SD], 14.3 ± 2.93 mm Hg). No study participants included in the analysis had undergone previous cataract extraction. Table 2 shows visual function results for the 102 study eyes. There was substantial variation in measured values for both parameters, but the majority of individuals had values considered to be normal. Only 2.9% of eyes (3/102) had abnormal CS; 40.2% of eyes (41/102) had abnormal color vision, based on study definitions.
| Characteristics | Summary Statistics |
|---|---|
| Study site (n [percentage]) a | |
| USC | 21 (37%) |
| UCLA | 36 (63%) |
| Age (years) | |
| Mean ± SD | 51.9 ± 9.9 |
| Median (range) | 53 (27 to 72) |
| Male sex (n [percentage]) a | 56 (98%) |
| Race/ethnicity (n [percentage]) a | |
| White | 31 (54%) |
| Black | 8 (14%) |
| Hispanic | 17 (30%) |
| Asian | 1 (2%) |
| HIV risk factor, (n [percentage]) a , b | |
| MSM only | 41 (75%) |
| IDU only | 4 (7%) |
| Both MSM and IDU | 1 (2%) |
| Heterosexual | 7 (12%) |
| IDU and heterosexual | 1 (2%) |
| Other | 1 (2%) |
| Time since diagnosis of HIV infection (months) | |
| Mean ± SD | 187.1 ± 91.7 |
| Median (range) | 194 (3 to 359) |
| Diagnosis of AIDS (n [percentage]) a | 51 (89%) |
| Time since diagnosis of AIDS (months) | |
| Mean ± SD | 134.4 ± 67.7 |
| Median (range) | 149 (0 to 247) |
| Current CD4+ T-lymphocyte count (cells/μL) | |
| Mean ± SD | 473.9 ± 226.7 |
| Median (range) | 420 (80 to 1037) |
| Nadir CD4+ T-lymphocyte count (cells/μL) | |
| Mean ± SD | 118.2 ± 139.8 |
| Median (range) | 66 (0 to 602) |
| Current HIV blood level (RNA copies/μL) | |
| Mean ± SD | 6011 ± 27816 |
| Median (range) | 0 (0 to 188393) |
| Smoking history (n [percentage]) a | |
| Current smoker | 11 (19%) |
| Former smoker | 1 (2%) |
| Never smoked | 45 (79%) |
| Comorbidities (n [percentage]) a | |
| Hypertension | 23 (40%) |
| Diabetes mellitus | 7 (12%) |
| Cardiovascular disease | 2 (4%) |
| Cerebrovascular accident | 0 |
| Renal disease | 3 (5%) |
a Number of individuals with characteristic among 57 study participants evaluated, unless otherwise stated.
| Visual Function | Summary Statistics |
|---|---|
| Visual acuity a (median [range]) | 20/20 (20/20 to 20/25) |
| Contrast sensitivity b (logCS) | |
| Mean ± SD | 1.85 ± 0.14 |
| Median (range) | 1.90 (1.25 to 1.95) |
| <1.5 (abnormal; c n [percentage] d ) | 3 (2.9%) |
| Color vision e (C-index) | |
| Mean ± SD | 1.74 ± 0.74 |
| Median (range) | 1.58 (0.96 to 4.07) |
| ≥1.78 (abnormal; f n [percentage] d ) | 41 (40.2%) |
b Determined using the Pelli-Robson technique.
c Based on criteria described by Shah and associates.
d Number of eyes (percentage of 102 eyes).
e Determined using the Lanthony D-15 technique.
f Based on a cohort of HIV-negative individuals, as described by Vingrys and King-Smith.
Mean RNFL thickness values reported by Rao and associates for a population of HIV-negative individuals were considered to be normal values. For purposes of analysis, study participants were considered to have normal RNFL thickness if their measurement values fell within the range mean ± 1 SD for the corresponding control population measurements (104.68 ± 12.61 μm for average peripapillary RNFL; 79.78 ± 14.62 μm for temporal RNFL). There were participants whose average and temporal RNFL thickness values were greater than normal and others whose thickness values were less than normal, based on these defined ranges.
Table 3 shows relationships of average RNFL thickness values (grouped as thick, normal, and thin) with visual function results and with time since diagnosis of HIV infection. There was a statistically significant association between thin average RNFL and worse logCS when compared to the normal average RNFL thickness group.
| Normal RNFL a (n = 74) | Thick RNFL a (n = 10) | P Value b | Thin RNFL a (n = 18) | P Value c | |
|---|---|---|---|---|---|
| RNFL thickness (μm) | |||||
| Mean ± SD | 104.4 ± 6.4 | 121.4 ± 5.1 | 82.5 ± 4.6 | ||
| Median (range) | 104.0 (93.3 to 116.5) | 119.7 (117.3 to 134.7) | 83.1 (75.0 to 90.0) | ||
| LogCS | .43 | .009 | |||
| Mean ± SD | 1.87 ± 0.12 | 1.84 ± 0.14 | 1.78 ± 0.19 | ||
| Median (range) | 1.90 (1.45 to 1.95) | 1.90 (1.50 to 1.95) | 1.85 (1.25 to 1.95) | ||
| C-index | .47 | .42 | |||
| Mean ± SD | 1.72 ± 0.71 | 1.53 ± 0.60 | 1.95 ± 0.88 | ||
| Median (range) | 1.58 (0.96 to 4.07) | 1.31 (0.96 to 2.45) | 1.72 (0.96 to 3.50) | ||
| Time since diagnosis of HIV infection (months) | |||||
| Mean ± SD | 187.3 ± 94.7 | 159.5 ± 76.6 d | 216.4 ± 81.2 d | ||
| Median (range) | 202 (3 to 359) | 167 (29 to 243) | 209.5 (75 to 332) |
a Study participants were included in the normal subgroup if their measurements fell within 1 standard deviation of the mean value (104.68 ± 12.61 μm) of parapapillary RNFL measurements in 4 quadrants (superior, temporal, inferior, nasal) for a population of HIV-negative individuals described by Rao and associates. Participants with values above or below that range were included in the thick and thin subgroups respectively.
b Based on Kruskal-Wallis test for the comparison of the thick RNFL subgroup to normal RNFL subgroup.
c Based on Kruskal-Wallis test for the comparison of the thin RNFL subgroup to normal RNFL subgroup.
d P value = .18 for the comparison of time since diagnosis of HIV infection between eyes with thin and thick RNFL.
Time since diagnosis of HIV infection was shorter for those with thick average RNFL than for those with thin average RNFL, but the difference did not reach statistical significance ( P = .18). Figure 1 shows a comparison of average RNFL thickness to time since diagnosis of HIV infection. Review of the scatterplot suggests increasing thickness vs time among those with shorter durations of disease, but decreasing thickness vs time among those with longer durations of disease. When lines of best fit are plotted as a linear function for the intervals ≤180 months and >180 months ( Figure 1 , Bottom), there is a slightly positive slope for the shorter interval (slope ± standard error [SE] = 0.014 ± 0.04 μm per month) and a slightly negative slope for the longer interval (-0.026 ± 0.03 μm per month), although the values were not statistically significant ( P = .76 and P = .40, respectively).
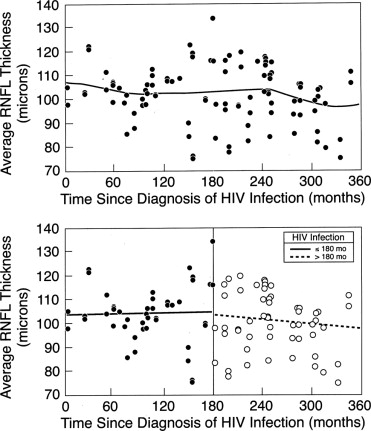
Table 4 shows relationships of temporal RNFL thickness (grouped as thick, normal, and thin) with visual function results. There were statistically significant associations between thin temporal RNFL and both worse logCS and worse C-index when compared to the normal temporal RNFL thickness group. After adjusting for possible correlation between eyes and for other potential confounders, the relationship between reduced CS and thin temporal RNFL remained statistically significant ( P = .027), while the relationship between the abnormal color vision and thin temporal RNFL group did not ( P = .12). Time since diagnosis of HIV infection was not found to be related to temporal RNFL thickness. We could not identify a relationship between the use of specific nucleoside reverse transcriptase inhibitors and temporal RNFL thickness (data not shown).
| Normal RNFL a (n = 76) | Thick RNFL a (n = 9) | P Value b | Thin RNFL a (n = 17) | P Value c | |
|---|---|---|---|---|---|
| RNFL thickness (μm) | |||||
| Mean ± SD | 77.9 ± 7.7 | 103.1 ± 8.6 | 57.6 ± 7.0 | ||
| Median (range) | 78.5 (65.7 to 93.0) | 100.7 (94.7 to 119.0) | 58.0 (37.7 to 65.0) | ||
| LogCS | .99 | .030 | |||
| Mean ± SD | 1.86 ± 0.12 | 1.88 ± 0.07 | 1.76 ± 0.21 | ||
| Median (range) | 1.90 (1.45 to 1.95) | 1.90 (1.75 to 1.95) | 1.80 (1.25 to 1.95) | ||
| C-index | .24 | .018 | |||
| Mean ± SD | 1.69 ± 0.70 | 1.37 ± 0.64 | 2.16 ± 0.83 | ||
| Median (range) | 1.58 (0.96 to 4.07) | 1.10 (0.96 to 3.04) | 2.02 (1.10 to 3.53) | ||
| Time since diagnosis of HIV infection (months) | |||||
| Mean ± SD | 188.0 ± 96.3 | 208.9 ± 58.0 d | 187.2 ± 85.4 d | ||
| Median (range) | 198.5 (3 to 359) | 213 (110 to 314) | 194 (29 to 332) |
Stay updated, free articles. Join our Telegram channel

Full access? Get Clinical Tree


